Comparative Analysis of Speech Compression
Algorithms with Perceptual and LP based Quality
Evaluations
Nasir Saleem
Institute of Engineering and Technology, Gomal University,
D.I.Khan, KPK, Pakistan
Sunniya Nasir
Institute of Engineering and Technology, Gomal University,
D.I.Khan, KPK, Pakistan
Sher Ali
City University of science and Information Technology, Peshawar, KPK, Pakistan
ABSTRACT
Speech compression is one of the leading vicinity of digital signal processing that spotlight on dipping the bit rate of speech signals for transmission and storage devoid of considerable loss of quality. In past decades many speech coding techniques have been proposed for speech analysis. This paper attempts to assess and compare two compression techniques on speech signals. To execute this idea we have chosen two low bit rate and widely used speech analysis methods called VELP and MELP. The performances of both are evaluated by performing objective quality tests including PESQ, IS and CEP. Similar speech files are tested with both coders. The objective assessments show that at low bit rate the MELP shows better performance as compared to VELP.
Keywords
MELP, VELP, PESQ, IS, Cepstrum distance, MOS.
1.
INTRODUCTION
The aim of the Speech compression system (SCS) is to transform the speech signals to a more compact representation which can be transmitted across the channel with comparatively lesser storage memory. Practically it is not possible that one gets full access to entire bandwidth of the network; consequently, networks require compressing the speech signal. In general the speech compression techniques [1],[3],[4] are utilized in long distance communication, excellent quality storage and message encryption. For example in digital cellular system (DCS) and VoIP networks number of consumers contribute to the same bandwidth. As bandwidth is limited in networks therefore speech compression permits additional consumers to acquire access to the accessible network. Another example of SCS is the digital storage of voice. For fixed on hand memory, the speech compression makes it achievable to accumulate the message for extended time. Speech coding is fundamentally the lossy category of coding where reconstructed speech is not the precise replica of novel speech and also does not sound similar to the original speech. Numerous speech coding techniques are available like waveform coding, vocoding including Mixed Excited Linear Predictive Coding (MELP) [2],[5], Linear Predictive Coding (LPC) and Voice Excited Linear Predictive Coding(VELP) [6], [11] , and hybrid coding. The speech attempts to be compressed are wideband in nature surrounds frequency range 0 to 8 KHz. The sampling frequency for these speech signals according to sampling theorem must be 16 KHz with end-to- end delay limit of 100 ms. Time delay limitations depend upon application to application. Like in telephony network only 1 msec delay is tolerable while 500 msec time delay is acceptable in video telephony. Among these limitations, One more limitation is
that the overall bit rate should not go beyond the 16 kbps. With all these constraints, the specific system ought to have less than 20 MOPS. Normally the speech coders are categorized into waveform coding, parametric and hybrid coders. Waveform coders including PCM and ADPCM [12] try to maintain the novel shape of speech and works at 32 kbps and higher. In parametric coders [13] the parameters of the speech are extracted and same parameters are utilized in synthesis process. The bit rate range for parametric codes is 2 to 5 kbps. MELP and LPC are the examples of this class. While hybrid coders are the arrangement of waveform and parametric coders and bit rate range is 5 to 32 kbps. In this paper the developed speech coders (MELP and VELP) are measured for quality with objective quality measurements. The objective investigation is launched in order to assess the speech quality and minimize the human preconception. The objective quality has been achieved by figure out the PESQ, IS and Cepstral distance for the novel and reconstructed speech signals.
2.
HUMAN SPEECH GENERATION
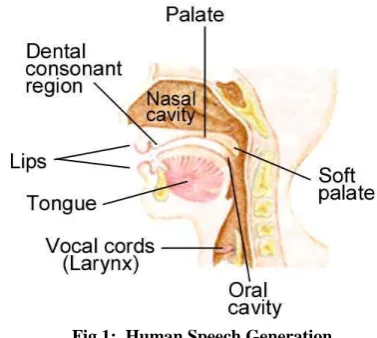
This section includes explanation of human anatomy of speech generation and is sketched in figure 1. [image:1.595.327.516.469.638.2].
Fig 1: Human Speech Generation
On the basis of above human speech production model following observations has been made
In support of voiced sounds, the vocal cords tremble. The rate at which the vocal cords tremble is known as Pitch period of voice.
In support of unvoiced sounds, there is no vocal trembling subsequently having no pitch.
For nasal sounds, the vocal tract is acoustically coupled with nasal cavity.
The first and last type of sounds is classified as voiced, while in remaining two forms the vocal cords stay unlock and there is no vibration for these kinds of sound so they are called as unvoiced.
The nature of the vocal tract resolves the type of sound.
Throughout the speech generation process, vocal tract transforms the shape which fallout in diverse sounds.
Vocal tract is regarded as to be non-uniform and time varying tube.
3.
MELP CODING
[image:2.595.309.555.76.284.2] [image:2.595.54.270.380.544.2]The figure 2 represents the speech generation model for MELP coder which principally develops on the basis of LPC model [14]. The MELP decoder employs a complicated interpolation to level out the inter-frame shift. An arbitrarily pitch jitter is produced in order to disturb value of pitch period hence produces an A-periodic train of impulse. In MELP coder the sound classification is expanded to three groups, the voiced, unvoiced and additional class of sounds the jittery voiced. The jittery voiced situation in MELP is managed by the pitch jitter parameter and a random number. The jittery voicing situation matches to condition when the excitation is A-periodic but not wholly random which is present in voicing transitions.
Fig 2: MELP model of speech generation
The excitation pulse shape in case of periodic excitation is detached from speech and detached parameters sent out decoder for synthesis purpose. The pulse shapes hold significant information about speech and are computed via Fourier magnitudes of prediction error. The computed parameters are utilized to produce the impulse response of the pulse generation filter [Figure 2] which is accountable for the creation of periodic excitation. Periodic and noise excitations are filtered with the help of pulse and noise shaping filers respectively. Afterward these excitations are combined to acquire the entire mixed excitation. That’s why called mixed excited LPC. The frequency responses of shaping filters are directed by the parameters called as voicing potencies that computes the voicedness. These responses of filters are changeable with the passage of time.
3.1 Pulse Shaping Filters
In MELP, every pulse shaping filter is composed of five filters recognized as synthesis filters. Among five filters every
synthesis filter manages one specific band of frequencies with pass bands classified as:
Filter 1: 0-500 Hz Filter 2: 500-1000 Hz Filter 3: 1000-2000 Hz Filter 4: 2000-3000 Hz Filter 5: 3000-40000 Hz.
These synthesis filters are linked in parallel and depicts frequency responses of shaping filters. Figure 3 expresses this idea.
Fig 3: Pulse shaping filters
3.2
Bit Allocation
The MELP coder splits 8Kbps speech to 22.5 msec frame for analysis. Depends on nature of speech, the inter-frame redundancy can be developed to proficiently quantize parameters. The bits provision is summarized in table 1. Total 54 bits are put on the air per frame with frame length of 22.5 msec. 2.4 kbps bit rate is desired to transmit the 54 bits/frame.
Table 1 Bits allocation for MELP coder
Parameters Voiced Unvoiced
LPC
Pitch Period/Low band voicing strength Band pass voicing strength
First gain Second gain Aperiodic flag Fourier magnitudes Synchronization Error protection 25 7 4 3 5 1 8 1 _ 25 7 - 3 5 - - 1 13
Total 54 54
4.
VELP CODING
The LPC on speech fames is utilized to approximate the parameters like pitch [15], formants, intensity, loudness and spectra of speech. The theory following the LPC is to trim down the sum of squared difference between original and anticipated speech over a restricted period. This process is carried out to provide distinctive set of predictor coefficients. These predictor coefficients are approximated for each frame of 20 msec. The coefficients are symbolized as ak. An additional essential parameter is gain (G). The transfer function for filter is:
H(z) =
(4.1)
The summation is computed from k=1 to k=p. In case of LPC this is 10 means that 10 coefficients are sent for synthesis.
Synthesis Filter 1 I/P to Shaping Filter O/P of Shaping Filter Synthesis Filter 2 Synthesis Filter 5 G G White Noise Generator Noise Shaping Filter Impulse Train generator Pulse generation Filter Pulse Shaping Filter Synthesis Filter Pitch Period Period
Jitter Impulse Response Filter Coefficients Gain Voicing Strengths Speech
G = Gain
Two key practices are utilized to compute coefficients, the autocorrelation and covariance. Here the autocorrelation scheme is utilized as the roots of polynomials in denominator causes the poles to be located within unity circle which shows stable system. The Levinson-Durbin scheme is took up in order to compute the parameters for autocorrelation. The LPC analysis of frames is carried out to answer the question that specific frame is voiced or unvoiced? In favor of voiced segment, the impulse train is utilized. The precise pitch detecting algorithm is used to conclude the pitch. We deployed autocorrelation function to decide pitch of segment. In case of unvoiced segment, white noise is utilized for demonstration. Hence impulse train or white noise is used as excitation for synthesis filer. Mathematical model for speech production is given in figure 4.
Fig 4: Mathematical Modeling of Speech Generation
[image:3.595.58.211.250.322.2]Generally the predictor coefficients are not quantized directly as they do not guarantee the stability. To guarantee the stability, reasonably elevated accuracy is mandatory. A minute variation in predictor coefficients is responsible for the great change in pole locations. The LD algorithm creates intermediate values. Therefore quantization of intermediate values is less challenging. The core proposal following the voice excitation is to keep away from the inaccurate discovery of pitch and exercise of impulse train for synthesis of speech. As a result, the incoming speech in frames is filtered out with predictable TF of LPC analyzer. This filtered outcome is known as residual signal. By transmitting the residual signal to receiver, we can search out better quality speech. The block diagram for VELP is given in figure 5.
Fig 5: VELP vocoder block diagram
For rebuilding of excitation merely low frequencies of residual signal are desired. We have applied the discrete cosine transform (DCT) as it focused the majority of the energy in first few coefficients. Therefore transmit the coefficients as they hold nearly all energy. The receiving side employs inverse DCT to recreate signal with the intention of excitation of voice.
4.1 Bits Allocation
The speech segment in VLPC encloses 88-bits as additional 49 bits are needed for DCT. The 8000 samples/second are
wrecked down to 180 samples segments as sampling rate is 8000 samples/second. Thus approximately 44.44 frames/second fallout in approximately 4kbps. The bits allocation is summarized in table 2.
Table 2 Bits allocation for VELP coder
Parameters Bits
DCT K1 and K2
K3 and K4
K5, K6, K7 and K8
K9
K10
Gain
Synchronization
40 10 10 16 03 02 05 01
Total 88
5.
WAVEFORM ANALYSIS
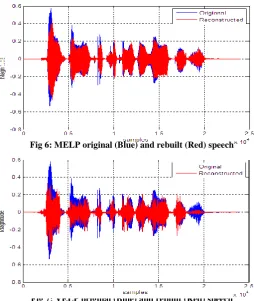
[image:3.595.296.551.353.655.2]The assessment has been completed with help of original speech sentences spoken by different speakers against the VELP and MELP regenerated speech. In both schemes, the reconstructed speech has poor quality than original. The MELP reconstructed speech waveform is superior to VELP and are plotted in figure 6 and 7 respectively.
Fig 6: MELP original (Blue) and rebuilt (Red) speech
Fig 7: VELP original (Blue) and rebuilt (Red) speech
It can be clearly observed from figures (6,7) that the reconstructed speech waveforms are close to novel in MELP as compared to VELP.
6.
PERCEPTUAL MEASUREMENT
6.1PESQ
The aim of the PESQ [6],[7],[8] algorithm is to measure the quality of the speech. The quality evaluation process is carried out by the comparison of the original and the degraded speech
Impulse Train generator
Glottal Pulse Model
LPC Analyzer
Coder Channel Decoder
LPC Synthesizer
Excitation Detector
S(t)
[image:3.595.53.289.528.634.2]2.8012 2.9792
5.755 5.5365
0 2 4 6 8
Male Speaker Female Speaker
MELP Coder VELP Coder
3.1033 3.1068
2.4216
2.1147
0 1 2 3 4
Male Speaker Female Speaker
MELP Coder VELP Coder
due to the compression. For the comparison process the PESQ takes the help of stochastic and cognitive models and is associated with MOS [16]. PESQ score is calculated by the linear grouping of the average disturbance (Dave) and the average asymmetrical disturbance (Aave) values respectively and is given by the formula:
PESQ = ao +a1Dave + a2Aave (6.1)
The PESQ results for MELP are better than VELP shown in
Chart 1: PESQ computation for coders
7.
LPC BASED OBJECTIVEMEASURES
7.1 Cepstrum Distance (CEP)
CEP distance [17],[8] is the estimate of log-spectrum distance between original and reconstructed speech and is computed by taking the log of spectrum and retransformed to time-domain. With this process the excitation signal of speech is separated from the convolved vocal tract characteristics. CEP distance can be computed from equation:
DCEP = 10/Log10 √ 2 Σ |Cc (k) – Cp (k) |2 (7.1)
The CEP computation for MELP coder has better performance as compared to the VELP and shown in chart 2. Smaller the distance higher will be the quality and vice versa.
Chart 2: CEP distance for coders
7.2
Itakura Saito Distance
IS [18] evaluates the perceptual distance between original spectrum and an approximation of that spectrum. The estimation is based on divergence between power spectra of original and reconstructed speech. If the distance is high for a specific speech then algorithm is performing badly, but if the distance is low then the algorithm performs well for that speech. Here in MELP, the IS distance is low while VELP distance is higher means low performance. The chart 3 shows the IS computations for both coders.
Chart 3: IS distance for Speech coders
8.
CONCLUSION AND FUTURE WORK
Speech compression has been carried out with help of two algorithms having well different bit rates. Although the bit rate for the VELP is much higher (almost twice) than MELP still the quality of compressed speech obtained from the MELP is better than the Voice Excited LPC. When the PESQ, CEP and IS for both methods were compared, it was observed that the speech degradation is more in voice excited LPC. The mixed excited LPC performed better for both kinds of speakers, that is, male and female. The signal level is weak for voice excited LPC while strong signal level is observed for mixed excited LPC. Whenever we reconstruct the speech and its signal level is relatively weak to prearranged threshold level we can conclude that the system is performing not well for specific speech signals. In this work we tested clean speech signals and for English language only. In future we can extend this work to compute distortion introduced by the coder in noisy background and the behavior of coders towards other languages.
9. REFERENCES
[1] Milan Z. Markovic, “Speech Compression – Recent Advances and Standardization”, 19-21 September 2001, NiS, Yugoslavia.
[2] John S. Collura, Diane F. Brandt, Douglas J. Rahikka, “The 1.2 Kbps/2.4Kbps MELP Speech Coding Suite with Integrated Noise Pre Processing”, IEEE, National Security Agency, 2002.
[3] Chin-Chen Chang, Richard Char-Tung Lee, Guang- Xue Xiao, Tung-Shou C!hen, “A New Speech Hiding Scheme Based upon Sub-Band Coding”, ICICS-PCM, 15-18DemnbcrZ003 Singapore.
[4] G. Rajesh,
A. Kumar, K.Ranjeet
, “Speech Compression using Different Transform Techniques International Conference on Computer & Communication Technology (ICCCT), 2011.[5] Lann M Supplee, Ronald P Cohn, John S. Collura from US DOD and Alan V McCree from Corporate R&D , TI, Dallas, MELP: The New Federal Standard at 2400 bps. [6] ITU-T: ITU-T Recommendation P.862: Perceptual
Evaluation of Quality (PESQ): An Objective Method for End-to-End Speech Quality Assessment of Narrow-Band Telephone Networks and Speech Codecs (2001).
[7] Ma, J., Hu, Y., Loizou, P.C.: Objective measures for predicting speech intelligibility in the noisy
1.1221 1.0444
13.2305 13.5837
0 5 10 15
Male Speaker Female Speaker
conditions based on new band-importance functions. J. Acoust. Soc. Am. 125(5), 3387–3405 (2009). [8] Hu, Y., Loizou, P. C.: Evaluation of objective quality
measures for speech enhancement. IEEE Trans. Audio Speech Lang. Process.16(1), 229–238(2008). [9] B. S. Atal, M. R. Schroeder, and V. Stover,
"Voice-Excited Predictive Coding System for Low Bit-Rate Transmission of Speech", Proc. ICC, pp.30-37 to 30-40, 1975.
[10] C. J. Weinstein, "A Linear Predictive Vocoder with Voice Excitation", Proc. Eascon, September 1975. [11] Raza, M.A., “Implementation of Voice Excited Linear
Predictive Coding (VELP) on TMS320C6711 DSP Kit”, 9th International Multitopic Conference, IEEE INMIC, 2005.
[12] McPherson, T., Jr , “PCM speech compression via ADPCM/TASI”, Acoustics, Speech, and Signal Processing, IEEE International Conference on ICASSP '77. 1977.
[13] Madrid, K.M. , Tan, E.C. , Guevara, R.C.L, “Low bit-rate wideband LP and wideband sinusoidal parametric speech coders” ,TENCON 2004. 2004 IEEE Region 10 Conference.
[14] Haagen, J. Nielsen, H. ; Hansen, S.D., “A 2.4 kbps high-quality speech coder”, Acoustics, Speech, and Signal Processing, 1991. ICASSP-91, 1991 International Conference on 14-17 Apr 1991.
[15] Barbara Resch, Mattias Nilsson , Anders Ekman , W. Bastiaan Kleijn, “Estimation of the Instantaneous Pitch of Speech”, Audio, Speech, and Language Processing, IEEE Transactions on March 2007.
[16] Itoh, Y. Tajima, K. ; Kuwabara, N., “Measurement of subjective communication quality for optical mobile communication systems by using mean opinion score”, Personal, Indoor and Mobile Radio Communications, 2000. PIMRC 2000. The 11th IEEE International Symposium on 2000.
[17] Kitawaki, N.Nagabuchi, H. Itoh, K., “Objective quality evaluation for low-bit-rate speech coding systems “, Selected Areas in Communications, IEEE Journal, Feb 1988.
[18] Enqvist, P. Karlsson, J., ” Minimal Itakura-Saito distance and covariance interpolation”, Decision and Control, 2008. CDC 2008. 47th IEEE Conference 9-11 Dec. 2008