© 2018, IRJET | Impact Factor value: 6.171 | ISO 9001:2008 Certified Journal | Page 1038
Risk Measures for Controlling Variations on Forecasted Construction
Cash Flows of Building Projects
Kimata N. Malekela
11
School of Architecture, Construction Economics and Management, Ardhi University, Dare es Salaam, Tanzania
---***---Abstract –
There are significant variations on forecastedconstruction cash flows which make a great challenge in establishing an accurate forecast of construction cash flows. These variations are mainly caused by risk factors prevailing in construction projects. This makes clients end up to pay more than what was planned to be paid at particular time. It is a fact that for the smooth running of building projects, variations need to be corrected immediately with the use of proper risk measures whenever they occur. This research is therefore aimed to identify the significant risk measures for controlling variations on forecasted construction cash flows of building projects in Dar es Salaam, Tanzania. The study was conducted through questionnaire survey administered on 44 building contractors and 42 quantity surveyors based in Dar es Salaam, Tanzania. The primary data were mainly analyzed using statistical package for social sciences (SPSS) Version 20.0. The study found five significant risk measures for controlling variations on forecasted construction cash flows of building projects. These risk measures aredesign detailing, use of clear and complete specifications and standards, design review, effective communication among project participants, and regular inspection of works and audits. It is therefore recommended that stakeholders in building industry should use simultaneously all identified significant risk measures where necessary for minimising variations on forecasted construction cash flows. Also, the use of identified significant risk measures should be improved by establishing a proper framework for monitoring risks so as to successfully minimise variations on forecasted construction cash flows.
Key Words: Construction cash flows, Risk measures,
Variations, Building projects, Tanzania
1. INTRODUCTION
Construction projects always require a clear and appropriate project cash flow (Melik, 2010) [9]. Normally, project cash flow is affected by the risks associated with construction projects. These risks may result into variations on forecasted construction cash flows (Malekela et al., 2017a) [7]. Although risks cannot be completely eliminated in live projects but strategies have always been taken to reduce them to an acceptable level (Kerzner, 2009) [5]. According to Flanagan and Norman (1993) [3], there are four basic forms to deal with risks in projects namely risk reduction, risk transfer, risk avoidance and risk retention.
One of the alterations caused by risk factors in construction projects is the variations on the forecasted construction cash flows (FCCFs). There is large number of
researches conducted in the area of construction cash flows but yet risk factors are still posing a great challenge in establishing an accurate forecast of construction cash flows (Odeyinka and Lowe, 2002)[14]. Due to risk factors involved in construction projects, there are great variations on FCCFs that affects the effort of client meeting contractors’ expectation in financing the project. This has led to poor cost performance of construction project (Malekela et al., 2017a).
Generally, project managers in construction project have the same project goals for achieving quality product in time and within the estimated budget. But, in most cases these goals are not achieved as planned due to risk factors prevailing in construction projects (Mishra and Mishra, 2016). The effects of these risk factors in construction projects extend further to the forecasting of construction cash flows, in causing variations between the forecasted cash flows and the actual construction cash flows (Malekela et al., 2017a) [7].
For the smooth running of construction projects, variations need to be corrected immediately with the use of appropriate risk measures whenever they occur (Pitkanen, 2016) [18]. In that sense, the study aimed to identify significant risk measures for controlling variations on forecasted construction cash flows of building projects. Also, this enabled to identify frequently used risk measures and most effective risk measures for controlling variations on FCCFs of building projects.
2. LITERATURE REVIEW
Cash flow management has been one of the challenges in running construction projects due to large variations occurring on FCCFs (Malekela et al., 2017a) [7]. In this study, variation is the difference between actual and forecasted construction cash flows in executing the construction project (Odeyinka and Lowe, 2002) [14]. Also, according to Malekela et al., (2017b) [8], forecasted construction cash flow is the estimated/projected amounts of money to be received by contractor from client after completion of various work activities of the project at particular time or stage of the contract. While actual construction cash flows are the actual amounts of money paid to contractor for the various completed work activities of the project at particular time or stage of the contract after being valued at the site and certified.
© 2018, IRJET | Impact Factor value: 6.171 | ISO 9001:2008 Certified Journal | Page 1039 specifications (RICS, 2012) [19], changes in geological
conditions, project complexity, estimating error specifications (Odeyinka and Lowe (2000) [13], inclement weather, shortage of key resources, compliance with regulations, contractor’s lack of resources (Odeyinka et al., 2012) [16].
Controlling variations on FCCFs of building projects is the subject matter embedded in risk management. Therefore, dealing with this problem, different methods have been suggested with different researchers broadly grouped into four main categories which are risk retention, risk avoidance, risk transfer and risk reduction (Flanagan and Norman, 1993 [3]; Kerzner, 2009 [5]; and Cooper et al., 2005 [2]). Under the category of risk retention measures includes inflating BOQ rates (Kamane and Mahadik, 2009) [4], using contingency margin (Cooper et al., 2005 [2]; Kamane and Mahadik, 2009 [4]) and the use of company cash reserves
(
Kerzner, 2009 [5]; and Odeyinka et al., 2003 [12]). On the category of risk reduction, the measures include design review (Kamane and Mahadik, 2009 [4]; and Kerzner, 2009 [5]), the use of clear and complete specifications and standards, timely payments (Kerzner, 2009) [5], tender unbalancing(Melik, 2010) [9], valuations control, regular cash flow updating (RICS, 2012 [19]; and Odeyinka et al., 2003 [12]), the use of bank overdraft (Pitkanen, 2016 [18]; and Odeyinka et al., 2003 [12]), site meetings (Otim et al., 2011) [17] and the use of stable currency(
Odeyinka and Lowe, 2000) [13].The category of risk avoidance measures includes use of detailed design, effective communications among project participants,conducting detailed feasibility study (Kerzner, 2009) [5], the use of contract exemption clause (Ashworth, 2004 [1]; and Cooper et al., 2005 [2]), regular inspection of works and audits
, and
assessment of other parties in the contract(
Ashworth, 2004) [1]. Lastly, the category of risk transfer measures includes the use of compensation from insurance (Cooper et al., 2005 [2]; Flanagan and Norman, (1993) [3]), delaying payment to the sub-contractors and delaying payments to materials suppliers(
Odeyinka et al., 2003) [12].3. METHODOLOGY
The data used are primary data obtained through a questionnaire survey for addressing the objective of the research. The questions were centred on the frequencies of using risk measures and the effectiveness of those risk measures for controlling variations on FCCFs of building projects.
3.1 Questionnaire Design
This research intended to identify significant risk measures for controlling variations on FCCFs of building projects. The questionnaire design targeted to collect the data related to the objective of this study from building contractors and quantity surveyors (consulting firms) based in Dar es Salaam City. It should be noted that significant risk
measures were identified from analysis of the frequencies and effectiveness of risk measures. Therefore, a questionnaire survey was used to collect the data for identifying the frequencies of using risk measures and determining the effectiveness of those risk measures for controlling variations on FCCFs of building projects. The risk measures were obtained from broad literature review as previously discussed and finally compiled basing on the refined list of risk measures after conducting a pilot study. The pilot study was carried out to test the variables used in designing the questionnaire and improve reliability of the questions. Furthermore, the closed ended questions were used to collect the data of this study because they can be analyzed easily as recommended by Naoum (2003) [11]. Also, the scales were developed basing on a 5-point Likert scale defined as “very frequent (VF) = 5”, “frequent (F) = 4”, “average (A) = 3”, “rare (R) = 2” and “very rare (VR) = 1”. Another scale used for effectiveness of risk measures is “very effective (VE) = 5”, “effective (E) = 4”, “average (A) = 3”, “poor (P) = 2” and “very poor (VP) = 1”. These rating scales were used by respondents to provide their views on the frequencies of using risk measures and effectiveness of those risk measures in controlling variations on FCCFs of building projects by rating each of the statements in terms of those scales. A questionnaire survey was therefore used to collect these data through quantitative approach.
3.2 Data Collection
Risk measures for controlling variations on FCCFs of building projects were identified through literature review. A questionnaire survey was then used to collect data on the frequencies of using risk measures and effectiveness of those risk measures for controlling variations on FCCFs of building projects from building contractors and quantity surveyors (consulting firms) based in Dar es Salaam. It indicates that most of building contractors and quantity surveyors had enough experience in executing the building projects because the response showed that most of them had experience of more than 10 years in executing the building projects.
3.3 Sample Size and Responses to Questionnaires
The sample sizes for building contractors and quantity surveyors based in Dar es Salaam, Tanzania were 44 and 42 respectively. Therefore, 86 questionnaires were distributed to building contractors and quantity surveyors. Building contractors were included in the study sample because they are main builders in execution of the building projects. Also, quantity surveyors were included in a sample because they are the ones who deal directly with cash flow management during execution of the building projects in Tanzania.
3.4 Responses to Questionnaires
© 2018, IRJET | Impact Factor value: 6.171 | ISO 9001:2008 Certified Journal | Page 1040
4. RESULTS AND DISCUSSION
The data are mainly analyzed using statistical package for social sciences (SPSS) Version 20.0 for the data's obtained from questionnaires. Descriptive statistics that measures of central tendency and relative position to analyze its data were used by the researcher. Also, Spearman rank correlation coefficient was used in analysing data.
The indices and Spearman rank correlation coefficient were calculated using the following formulae:
51
)
(
k j
NR
nRjk
Rpjk
I
(1))
1
(
6
2 2
N
N
di
Rho
(2)Ij = Index for risk factor j
Rpjk = Rating point (ranging from 1-5)
nRjk = Number of respondents belongs to rating point k, for risk factor j
NR = Number of respondents
Rho = Spearman rank correlation coefficient
di2 = Difference in ranking between each pair of factors
N = Number of factors
In the test of significance of the computed value of Spearman rank correlation coefficient, the null hypothesis (HO) assumes that no significant correlation exists between
the two sets of ranks of n attributes computed from the ratings of building contractors and quantity surveyors. This implies that the computed rho (P) is less than the critical rho (Pα) from the table of critical values of rho. In this study, an
alternative hypothesis (H1) assumes that a significant and
positive correlation exists between the two sets of ranks of n attributes at one-tailed test. At 5% level of significance, both HO and HA could be stated as follows:
HO: P <
P
α (i.e. no significant correlation exist) (3)H1:P ≥ Pα (i.e. significant and positive correlation exits) (4)
The analysis was based on 73 respondents (36 building contractors and 37 quantity surveyors) to identify significant risk measures for controlling variations on FCCFs of building projects. As previously stated,significant risk measures were identified from analysis of the frequencies and effectiveness of risk measures. Therefore, the analysis was also used to identify the frequencies of using risk measures, and to determine the effectiveness of those risk measures for controlling variations on FCCFs of building projects as shown in Table 2 and 3 respectively. The risk measures and other general terms have been presented in abbreviations (short forms) to save space during presenting the data in tabular
form. The clarifications of these abbreviations are given in Table 5 and 6.
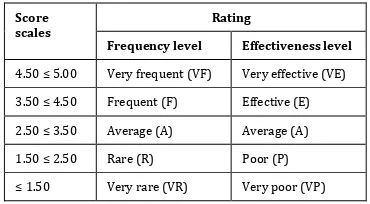
The rating levels indicated in Table 1 were used to discuss the degree of indices. But the risk measures scales used in Table 1 were modified from the study of Malekela (2008) [6].
Table 1: Levels of the Risk Measures for Controlling Variations on FCCFs of Building Projects
Score scales
Rating
Frequency level Effectiveness level
4.50 ≤ 5.00 Very frequent (VF) Very effective (VE) 3.50 ≤ 4.50 Frequent (F) Effective (E) 2.50 ≤ 3.50 Average (A) Average (A) 1.50 ≤ 2.50 Rare (R) Poor (P) ≤ 1.50 Very rare (VR) Very poor (VP)
In this study, the risk measures that have frequency indices above 3.5 (i.e. 3.5/5 = 70%) are classified as most frequently used risk measures for controlling variations on FCCFs. Based on Table 1, these risk measures are either very frequently or frequently used for controlling variations on FCCFs. Similarly, the risk measures that have effectiveness indices above 3.5 are classified as most effective risk measures for controlling variations on FCCFs. This implies that the risk measures are either very effective or effective for controlling variations on FCCFs as indicated in Table 1.
Furthermore, any risk measures with frequency indices and effectiveness indices above 3.5 are classified as significant risk measures for controlling variations on FCCFs of building projects. But, these indices used were based on average perception from building contractors and quantity surveyors. These are passing criteria which used for discussion so as to identify significant risk measures.
This part involves mainly three sections namely frequencies of using risk measures, effectiveness of the risk measures, and identification of significant risk measures for controlling variations on FCCFs of building projects as discussed hereafter.
4.1 Frequencies of Using Risk Measures for Controlling Variations on FCCFs of Building Projects
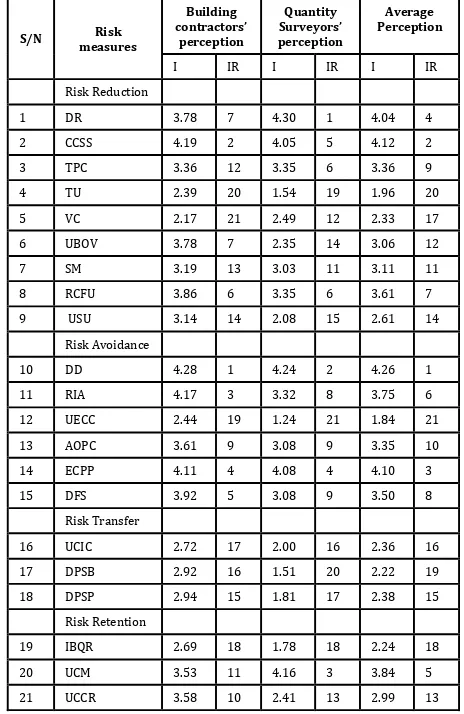
Based onaverage perceptions from building contractors and quantity surveyors (Table 2), it was found that there are eight risk measures which are frequently used for controlling variations on FCCFs of building projects which have indices above passing index of 3.5. Design detailing (DD) was found to be the most frequently risk measure with index of 4.26. While the use of exemption clauses of the contract (UECC) was the least frequently risk measure with index of 1.84.
[image:3.595.341.526.192.294.2]© 2018, IRJET | Impact Factor value: 6.171 | ISO 9001:2008 Certified Journal | Page 1041 using clear and complete specifications and standards (CCSS),
and regular inspection of works and audits (RIA) with the indices of 4.28, 4.19 and 4.17 respectively (Table 2). While basing on quantity surveyors’ perception, top three frequently used measures are design review (DR), design detailing (DD) and the use of contingency margin (UCM) with indices of 4.30, 4.24 and 4.16 respectively (Table 2).
Furthermore, building contractors’ perceptionshows that least three frequently used measures are valuation control (VC), tender unbalancing (TU) and the use of exemption clauses of the contract (UECC) with indices of 2.17, 2.39 and 2.44 respectively (Table 2). While basing on quantity surveyors’ perception, use of exemption clause of the contract (UECC), delaying payment to sub-contractors (DPSB), and tender unbalancing (TU) are the least three frequently used risk measures. Their indices are 1.24, 1.51 and 1.54 respectively (Table 2).
Through Spearman rank correlation coefficient, the results revealed that perceptions of the building contractors and quantity surveyors on frequencies of using risk measures for controlling variations on FCCFs of building projects were significantly correlated (i.e. P ≥ Pα; P = 0.768 and Pα = 0.359). H1 was accepted, this indicates that a significant and positive
correlation exists between the two sets of ranks on frequencies of 21 risk measures computed from the ratings of building contractors and quantity surveyors.
It was expected for design detailing (DD) to be among the top three frequently used risk measures in controlling variations on FCCFs of building projects. Normally, the importance of details in the design cannot be underestimated in the whole process of preparing accurate bills of quantities, work programme and later on the preparation of conscious project cash flow forecast. Therefore, design detailing helps most of variations on FCCFs of building projects to be avoided.
It is a fact that using clear and complete specifications and standards (CCSS) controls cash flow variations by insuring timely payment since everything is in accordance with original contract documents. Hence, this saves time for negotiations and clarifications during execution of building projects. Also, this risk measure controls variations on FCCFs of building projects by avoiding reworks which have a substantial effect on the cost and schedule as well the cash flow forecast.
[image:4.595.317.549.116.473.2]It is not surprising that tender unbalancing (TU) to be one of the least three frequently used risk measures. This is because sometimes tender unbalancing looks like a cause of variations itself on FCCFs. It is difficult to use this risk measure because it is not preferable in practice and tenders priced in this way are unlikely to pass the evaluation process. According to Melik (2010), the morality behind the use of this risk measure is still questionable.
Table 2: Frequencies of Using Risk Measures for Controlling Variations on FCCFs of Building Projects
S/N measures Risk
Building contractors’
perception
Quantity Surveyors’ perception
Average Perception
I IR I IR I IR Risk Reduction 1 DR 3.78 7 4.30 1 4.04 4 2 CCSS 4.19 2 4.05 5 4.12 2 3 TPC 3.36 12 3.35 6 3.36 9 4 TU 2.39 20 1.54 19 1.96 20 5 VC 2.17 21 2.49 12 2.33 17 6 UBOV 3.78 7 2.35 14 3.06 12 7 SM 3.19 13 3.03 11 3.11 11 8 RCFU 3.86 6 3.35 6 3.61 7 9 USU 3.14 14 2.08 15 2.61 14 Risk Avoidance 10 DD 4.28 1 4.24 2 4.26 1 11 RIA 4.17 3 3.32 8 3.75 6 12 UECC 2.44 19 1.24 21 1.84 21 13 AOPC 3.61 9 3.08 9 3.35 10 14 ECPP 4.11 4 4.08 4 4.10 3 15 DFS 3.92 5 3.08 9 3.50 8 Risk Transfer 16 UCIC 2.72 17 2.00 16 2.36 16 17 DPSB 2.92 16 1.51 20 2.22 19 18 DPSP 2.94 15 1.81 17 2.38 15 Risk Retention 19 IBQR 2.69 18 1.78 18 2.24 18 20 UCM 3.53 11 4.16 3 3.84 5 21 UCCR 3.58 10 2.41 13 2.99 13
Spearman rank Correlation Coefficient (Building contractors’ versus Quantity Surveyors’ rankings for frequencies) 0.768
Critical rho (n = 21) 0.359
Results: (sc = significantly correlated at 5% alpha) SC
4.2 Effectiveness of Risk Measures for Controlling Variations on FCCFs of Building Projects
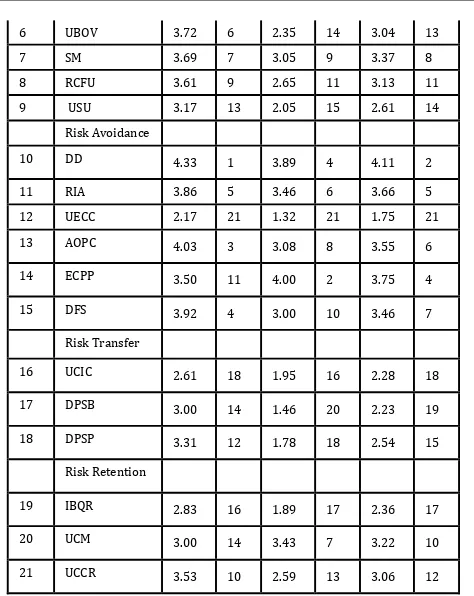
Based on average perceptions from building contractors and quantity surveyors (Table 3), the results showed that there are six risk measures which are most effective for controlling variations on FCCFs of building projects. Their means are all above passing index of 3.5. The use of clear and complete specifications and standards was found to be the most effective risk measure with index of 4.15. While the use of exemption clauses of the contract (UECC) was also the least effective risk measure with index of 1.75.
© 2018, IRJET | Impact Factor value: 6.171 | ISO 9001:2008 Certified Journal | Page 1042 three most effective risk measures are clear and complete
specifications and standards (CCSS), effective communication among project participants (ECPP) and design review (DR) with indices of 4.14, 4.00 and 4.00 respectively.
Lastly, the building contractors’ perception shows that least three effective risk measures are the use of exemption clauses of the contract (UECC), tender unbalancing (TU) and valuations control (VC) 5 with indices of 2.17, 2.31 and 2.36 respectively (Table 3). While on the side of consultants’ perception, least three effective risk measures are the use of exemption clauses of the contract (UECC), delaying payments to subcontractors (DPSB) and tender unbalancing (TU) with indices of 1.23, 1.46 and 1.54 respectively (Table 3).
Through Spearman rank correlation coefficient, it was observed that there was a significant and positive correlation exists between the two sets of ranks for building contractors and quantity surveyors on effectiveness of 21 risk measures (i.e. P ≥ Pα; P = 0.601 and Pα = 0.359). H1 was accepted; this is
interpreted to mean that all the surveyed building contractors and quantity surveyors experienced the effectiveness of 21 risk measures for controlling variations on FCCFs of building projects in the same way.
The study found that using detailed design in controlling variations on FCCFs is one of the most effective risk measures. When the design is well detailed and covers all necessary requirements for execution of the project, a more accurate cash flow forecast is produced. Therefore, the effectiveness of this measure is due to the direct relations with the process of preparing cash flow forecast. For instance, dealing with insufficient design involves a lot of assumptions in preparing cash flow forecast. This means a lot of changes will be waiting to affect cash flow forecast.
[image:5.595.317.554.71.369.2]The least three effective risk measures are also the least frequently used risk measures for controlling variations on FCCFs of building projects. These risk measures are the use of exemption clauses of the contract (UECC), tender unbalancing (TU) and delaying payments to subcontractors (DPSB). These measures by themselves look like the causes of variations instead of the solutions to the variations on FCCFs. Hence, their applicability is still the challenge in the construction market.
Table 3: Effectiveness of Risk Measures Used for Controlling Variations on FCCFs of Building Projects
S/N measures Risk
Building contractors’
perception
Quantity Surveyors’ perception
Average Perception
I IR I IR I IR Risk Reduction 1 DR 3.64 8 4.00 2 3.82 3 2 CCSS 4.17 2 4.14 1 4.15 1 3 TPC 2.72 17 3.84 5 3.28 9 4 TU 2.31 20 1.54 19 1.92 20 5 VC 2.36 19 2.62 12 2.49 16
6 UBOV 3.72 6 2.35 14 3.04 13 7 SM 3.69 7 3.05 9 3.37 8 8 RCFU 3.61 9 2.65 11 3.13 11 9 USU 3.17 13 2.05 15 2.61 14 Risk Avoidance 10 DD 4.33 1 3.89 4 4.11 2 11 RIA 3.86 5 3.46 6 3.66 5 12 UECC 2.17 21 1.32 21 1.75 21 13 AOPC 4.03 3 3.08 8 3.55 6 14 ECPP 3.50 11 4.00 2 3.75 4 15 DFS 3.92 4 3.00 10 3.46 7 Risk Transfer 16 UCIC 2.61 18 1.95 16 2.28 18 17 DPSB 3.00 14 1.46 20 2.23 19 18 DPSP 3.31 12 1.78 18 2.54 15 Risk Retention 19 IBQR 2.83 16 1.89 17 2.36 17 20 UCM 3.00 14 3.43 7 3.22 10 21 UCCR 3.53 10 2.59 13 3.06 12
Spearman rank Correlation Coefficient (Building contractors’ versus Quantity Surveyors’ rankings for effectiveness) 0.601
Critical rho (n = 21) 0.359
Results: (sc = significantly correlated at 5% alpha) SC
4.3 Identification of Significant Risk Measures
Based on the passing criteria mentioned above (i.e. the significant risk measures should have frequency indices and effectiveness indices greater than 3.5). Also, these indices were based on average perception of building contractors and quantity surveyors. From Table 4, design detailing (DD), use of clear and complete specifications and standards (CCSS), design review (DR),effective communication among project participants (ECPP) and regular inspection of works and audits (RIA) were identified as significant risk measures for controlling variations on FCCFs of building projects. These five significant risk measures are equivalent to 23.81% of all potential risk measures for controlling variations on FCCFs of building projects (i.e. 5/21). But design detailing is the most significant risk measure because it has highest index of 4.19 (established from average of frequency index and effectiveness index) as indicated in Table 4.
Table 4: Significant Risk Measures for Controlling Variations
on FCCFs of Building Projects
S/N measuresRisk
Average Perception
Frequency Effectiveness frequency & Average of effectiveness
© 2018, IRJET | Impact Factor value: 6.171 | ISO 9001:2008 Certified Journal | Page 1043
2 CCSS 4.12 2 4.15 1 4.14 2 Risk Avoidance
3 DD 4.26 1 4.11 2 4.19 1 4 RIA 3.75 5 3.66 5 3.71 5 5 ECPP 4.10 3 3.75 4 3.92 4
5. CONCLUSIONS
The emphasis of this paper has been on identifying the significant risk measures for controlling variations on FCCFs of building projects. The identified risk measures have been analyzed basing mainly on index analysis. From the list of potential risk measures, only five risk measures were identified as the significant risk measures for controlling variations on FCCFs of building projects. Therefore, it can be concluded that design detailing, use of clear and complete specifications and standards, design review, effective communication among project participants and regular inspection of works and audits are the significant risk measures for controlling variations on FCCFs of building projects in Tanzania.
Based on analysis (Table 4), design detailing is the most significant risk measure for controlling variations on FCCFs of building projects in Tanzania. Also, the use of clear and complete specifications and standards was identified to be the second most significant risk measure for controlling variations on FCCFs.
[image:6.595.307.542.307.679.2]Furthermore, the study found that risk reduction and risk avoidance are the best methods for controlling variations on FCCFs of building projects because all five significant risk measures fall under these two categories. Lastly, these identified significant risk measures are of important value in minimising variations on FCCFs and they provide direction for developing a framework for monitoring risks in building projects.
Table 5: List of Abbreviations of the General Terms
Statement Abbreviation
Very frequent VF Frequent F Average A Rare R Very rare VR Very effective VE Effective E Poor P Very poor VP Index I Index Rank IR significantly correlated sc not significantly correlated nsc
6. RECOMMENDATIONS
The study recommends that stakeholders in building industry should use simultaneously all identified significant risk measures where necessary during execution of building projects. This combination of risk measures will minimise variations on FCCFs of building projects. Also, design detailing should be done thoroughly before execution of building projects. This will avoid most of variations to occur on FCCFs of building projects.
Furthermore, the use of identified significant risk measures should be improved by establishing a proper framework for monitoring risks in building projects. This will enable integration of the use of risk measures and monitoring procedures so as to successfully minimise variations on FCCFs of building projects.
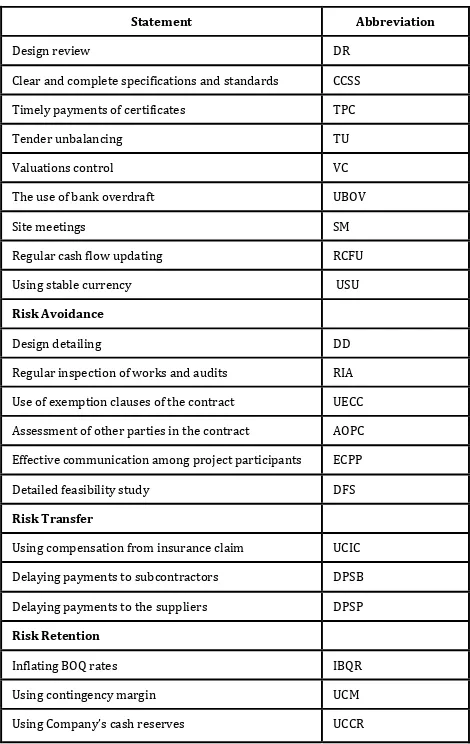
Table 6: List of Abbreviations of the Risk Measures
Statement Abbreviation
Design review DR Clear and complete specifications and standards CCSS Timely payments of certificates TPC Tender unbalancing TU Valuations control VC The use of bank overdraft UBOV Site meetings SM Regular cash flow updating RCFU Using stable currency USU
Risk Avoidance
Design detailing DD Regular inspection of works and audits RIA Use of exemption clauses of the contract UECC Assessment of other parties in the contract AOPC Effective communication among project participants ECPP Detailed feasibility study DFS
Risk Transfer
Using compensation from insurance claim UCIC Delaying payments to subcontractors DPSB Delaying payments to the suppliers DPSP
Risk Retention
Inflating BOQ rates IBQR Using contingency margin UCM Using Company’s cash reserves UCCR
REFERENCES
[1] Ashworth, A. (2004). Cost Studies of Buildings, 4th
Edition. Pearson Education Limited, London.
[2] Cooper, D., Grey, S., Raymond, G. and Walker, P., (2005).
[image:6.595.163.531.309.771.2]© 2018, IRJET | Impact Factor value: 6.171 | ISO 9001:2008 Certified Journal | Page 1044 Large Projects and Complex Procurements. John Wiley
and Sons Inc., London.
[3] Flanagan, R. and Norman, G., (1993). Risk Management
and Construction. Blackwell Science, London.
[4] Kamane, S. K. and Mahadik, S. A., (2009). Risk
Management in Construction Industry. Journal of Mechanical and Civil Engineering, pp. 59-65.
[5] Kerzner, H., (2009). Project Management: A System
Approach to Planning, Scheduling and Control, 10th
Edition. John Wiley and Sons Inc., New York.
[6] Malekela, K. N., (2008). Risks in Implementing Public
Private Partnership (PPP) Building Projects in Tanzania: The Case of National Housing Corporation. Ardhi University, MSc Dissertation.
[7] Malekela, K. N., Mohamed, J., Ntiyankunze, S. K. and
Mgwatu, M. I., (2017a). Risk Factors Causing Variations on Forecasted Construction Cash Flow of Building Projects in Dar Es Salaam, Tanzania. International Journal of Construction Engineering and Management, 2(6), pp. 46 - 55.
[8] Malekela, K. N., Mohamed, J., Ntiyankunze, S.K. and
Mgwatu, M.I., (2017b). Variations on Forecasted Construction Cash Flows of Building Projects: A Structural Equation Modelling (SEM) Approach. International Journal of Construction Engineering and Management, 6(5), pp. 197 - 208.
[9] Melik, S., (2010). Cash Flow Analysis of Construction
Projects Using Fuzzy Set Theory. Middle East Technical University, MSc Thesis (Civil Engineering).
[10] Mishra, S. and Mishra, B., (2016). A Study on Risk
Factors Involved in the Construction Projects. International Journal of Innovative Research in Science, Engineering and Technology, 5(2), pp. 1190-1196.
[11] Naoum, S. G., (2003). Dissertation Research and Writing
for Construction Students. Butterworth Heinemann, London.
[12] Odeyinka, H.A., Kaka, A. and Morledge, R., (2003). An
Evaluation of Construction Cash Flow Management Approaches in Contracting Organisations. The 19th Annual Association of Researchers in Construction Management (ARCOM) Conference, pp. 33 - 41
[13] Odeyinka, H. A. and Lowe, J. G., (2000). An Assessment of
Risk Factors Involved in Modelling Cash Flow Forecast. Proceedings of the 16th Annual Association of Researchers in Construction Management (ARCOM) Conference, September 6-8, Glasgow Caledonian University, pp 557 - 565.
[14] Odeyinka, H. A. and Lowe, J. G., (2002). A Factor
Approach to the Analysis of Risks Influencing Construction Cost Flow Forecast. RICS Construction and Building Research (COBRA) Conference, pp. 1-11.
[15] Odeyinka, H., Lowe, J. and Kaka, A., (2002). A
Construction Cost Flow Risk Assessment Model. Proceedings of the 18th Annual Association of Researchers in Construction Management (ARCOM) Conference, September 2-4, University of Northumbria, Vol. 1, pp 3 - 12.
[16] Odeyinka, H., Lowe, J. and Kaka, A., (2012). Regression
Modelling of Risk Impacts on Construction Cost Flow Forecast. Journal of Financial Management of Property and Construction, 17(3), pp 203 – 221.
[17] Otim, G., Nakacwa, F. and Kyakula, M., (2011). Cost
Control Techniques Used on Building Construction Sites in Uganda. Second International Conference on Advances in Engineering and Technology, pp 367 - 73.
[18] Pitkanen, A., (2016). Proposal for New Long-Term Cash
Flow Forecasting: The Case of Company. Helsinki Metropolia University of Applied Sciences, Master's Degree Thesis.
[19] RICS, (2012). Cash Flow Forecasting. 1st Edition,