An Improved Technique to Compute Visual Attention
Map based upon Wavelet Domain
Manish Mahajan
Assistant Prof. Deptt. Of Information Technology Chandigarh Engineering College Landran , Mohali
Navdeep Kaur,
PhD.Prof. & Head, Deptt. Of Information Technology Chandigarh Engineering College Landran , Mohali
ABSTRACT
Visual system of human beings does not process the complete area of image rather focus upon limited area of visual image. But in which area does the visual attention focused is a topic of hot research nowadays. Research on psychological phenomenon indicates that attention is attracted to features that differ from its surroundings or the one that are unusual or unfamiliar to the human visual system. Detection of visually salient image regions is useful for applications like object segmentation, adaptive compression, and object recognition. Object or region based image processing can be performed more efficiently with information pertaining locations that are visually salient to human perception with the aid of a saliency map. The saliency map is a master topological map having the possible locations of objects or regions which a human perceived as important/salient. In this paper a method for computing the saliency map in wavelet transform domain has been proposed. Earlier works in this domain although calculated the saliency very efficiently but they just involve the approximation components of DWM, the detail components have not been taken care but in many applications these detailed components are of great importance to highlight the smaller but visually important components.
Keywords:
Saliency map, wavelet transform, approximation coefficients, detail coefficients, salient region.
1. INTRODUCTION
Humans do not process the entire area of an input visual image uniformly, but focus their attention on a limited area (attended area) in the field of view and then shift their attention from one place to another, depending on the situation and task. Research on human visual characteristics shows that people only perceive clearly a small region of 2-5o of visual angle. The human retina possesses a non-uniform spatial resolution of photoreceptors, with highest density on that part of the retina aligned with the visual axis (the fovea), and the resolution around the fovea decreases logarithmically with eccentricity [1]. What’s more, research results show that observers' scan paths are similar, and predictable to some extent [1]. These research results provide a new pathway to encode images based on human visual characteristics which will allow us to only encode a small number of well selected interesting regions (attention regions) with high priority to keep a high subjective quality, while treating less interesting regions with low priority to save bits. Recently, many subjective-quality-based image coding methods have been developed. According to the way of obtaining attention regions, they can be coarsely classified into four categories, as
first extracted, and then through non-linear biologically inspired combination of these features, an attention map (usually called saliency map) can be generated. In this map, the interesting locations are highlighted and the intensity value of the map represents the attention importance. Under the guidance of the attention map, resource can be allocated non-uniformly to improve the subjective quality [13]-[16]. Although such research shows promising results, it is still not a completely resolved problem.
Although implementing a detailed human visual perception system is rather complex, implementing a system somewhat similar to the actual mechanics of the human perception can be a viable alternative. Since then, many research works reported in [17-22] have shown dedicated efforts to develop a system which mimics the human visual perception using only available features such as color, intensity, orientation, edges, and texture. Since these models operate on readily available features and provide locations of suspected importance without prior knowledge, they are termed as bottom-up visual saliency (VS). One distinguished feature of any bottom-up visual saliency model is the saliency map. All information from various features used is encoded onto this topological master map. Where the saliency map is end result of a VS model, the usefulness of the map does not end there. It can be used for various applications depended on the nature of the work conducted. The use of the saliency map can be seen in object segmentation [20, 21, 23]; visual search in complex scenes [24]; traffic signs detection [25]; image retrieval [26]; image watermarking [27]; image compression [28]; image fusion [29]; and many other image/visual applications.
2. PREVIOUS WORK
The term saliency was used by Tsotsos et al. [37] and Olshausen et al. [36] in their work on visual attention, and by Itti et al. [10] in their work on rapid scene analysis. Saliency has also been referred to as visual attention [37, 20], unpredictability, rarity, or surprise [33, 31]. Saliency estimation methods can broadly be classified as biologically based, purely computational, or a combination. In general, all methods employ a low-level approach by determining contrast of image regions relative to their surroundings, using
one or more features of intensity, color, and orientation. In general, bottom-up VS models extract feature information by means of contrast representation be it for color, intensity, orientation, or any other low-level feature. This contrast representation is performed by obtaining the difference of a region in the image relative to their surroundings. Theoretically, this method of obtaining the contrast is akin to the center surround process in the human eye. In the biological category one of the reputable work is by Itti and Koch [10] whose method was based upon biologically plausible architecture proposed by Koch and Ullman [34]. They determine center-surround contrast using a Difference of Gaussians (DoG) approach. Frintrop et al. [30] present a method inspired by Itti’s method, but they compute center surround differences with square filters and use integral images to speed up the calculations.
In computational VS models, low-level features and the contrast approach are still used but the model is not constructed based on any biological mechanism. The contrast is mainly obtained through the use of Euclidian distance in different sized window filters [20, 21, 23]. The contrast
images obtained in the works of [20, 21, 23] are summed to form the final saliency map.
The third category of methods are those that incorporate ideas that are partly based on biological models and partly on computational ones. For instance, Harel et al. [32] create feature maps using Itti’s method but perform their normalization using a graph based approach.
Other methods use a computational approach like maximization of information [35] that represents a biologically plausible model of saliency detection Some algorithms detect saliency over multiple scales [10, 38], while others operate on a single scale [20, 39]. Also, individual feature maps are created separately and then combined to obtain the final saliency map [40, 20, 39, 30], or a feature combined saliency map is directly obtained [20, 38].
Recently, there is a trend to model VS computationally in the frequency domain [22, 41]. In the works of Hou and Zhang [22], a spectral residual approach was used to generate the saliency map. The saliency map is the inverse of the spectral residual. The saliency map of this method is rather accurate in providing the locations of important regions in a given visual scene but is terribly low in resolution. In [41], Achanta et al. debated that the saliency map should have well-defined borders, uniformly highlighting the object if it is salient, and most of all; the saliency map should be in high resolution. In the authors' opinion, without conforming to the points mentioned [41], the saliency would have limited usefulness in certain applications. Therefore, Achanta et al. proposed a method which generates the saliency map solely by contrast representation. In their method, the original image is first smoothed using a 3-by-3 Gaussian filter to eliminate the high frequency content in the image. Then, the mean of the smoothed image is computed. Finally, the saliency map is obtained by the subtracting each pixel value of the original image from the computed mean.
Although the approach used by Achanta et al. gives high resolution maps which has its usefulness in some applications but in many other applications such as content based image retrieval (CBIR) all that matters is the detection of salient objection with acceptable resolution. In fact, the approach used in [41] will eliminate many small detailed objects and textures which could be of importance when the smoothing is applied to the spatial domain. Furthermore, as long as the saliency map provides the correct location of important objects and is of reasonable resolution (object can be visually identified), the map can be considered acceptable. In another approach Discrete wavelet transform was used by Christopher et al.[42] to compute the saliency map. This approach is successful in detecting salient regions in an image with acceptable resolution but it considers only the contrast of LL band, it totally ignores the other three detail bands. This act will eliminate the smaller & finer details. But sometimes some important information may be present in these detail components. In this paper we have proposed a method to comute the saliency map considering the approximation as well as detailed coefficients of the discrete wavelet transform so that all the important things can be highlighted & detected.
3. DISCRETE WAVELET TRANSFORM
The DWT is a powerful image processing tool which decomposes an image into different frequency variations at respective scales for multi-resolution analysis. The transform
so, the image is decomposed into four wavelet subbands, each representing a portion of the frequency range contained in a particular image. The LL (approximate coefficients) sub-band contains the low frequency components of an image in both horizontal and vertical dimension. The LH (horizontal details) sub-band contains the high frequency components of an image in the horizontal direction and low frequency components in the vertical dimension. The HL (vertical details) sub-band contains the low frequency components of an image in the horizontal direction and high frequency components in the vertical dimension. Finally, the HH (diagonal details) sub-band contains the high frequency components of an image in both horizontal and vertical dimension. The LL sub-band can be further decomposed into four sub-bands at the next scale. An illustration of the 2-D wavelet decomposition is shown in Figure 1.
LL2 HL2
HL1
LH2 HH2
LH1 HH1
Figure 1. Two scale wavelet decomposition
4. SALIENCY MAP COMPUTATION
In [22] computation of saliency map is performed in frequency domain since processing in frequency domain has its own advantages but the inversion back in saliency map will result in poor resolution saliency map [22,43]. In [41] the image is first filtered using a Gaussian filter followed by mean subtraction to find saliency map. Mean subtraction results in higher resolution map but the filtering operation will eliminate the small details. Christopher et al. tried to solve this problem in his method based upon DWT but they considered only the approximation coefficients not detail coefficients for calculating the contrast which is further used for computing the saliency map. This ignorance of detailed coefficients might lead to elimination of comparatively smaller & finer details.
In the proposed approach the image will not be filtered using Gaussian filter so as to retain the smaller objects. Also to ensure the presence of smaller and finer details, which may be of great importance for human visual system (HVS), the contrast is calculated for all the four bands. Although the mean subtraction of Achanta et al. [41] is retained in this method to get the higher resolution map. The details of calculations of saliency map are as follows:
The input colored image is first converted to lab color lab so as to make it device independent. Also the L component distinguishes the intensity or luminance component from the color information. Then taking the all the l, a, b components individually we performed the single level DWT decomposition. After this we got the four individual components named LL1, HL1, LH1, HH1 for all the three l, a, b images. Then for each component individually we calculate the contrast image using the Euclidean distance with the help of following formula:
C(x,y) =
2
)
)
,
(
(
l
x
y
l
……{1}Where
l
is the mean of LL component of L image ofL,a,b component images &
l
(x,y) is the mean intensity ofall pixels of LL component of L sub-image similarly 12 contrast images will be calculated for four sub-bands of each component image of Lab color space. Then inverse DWT operation will be performed taking four processed sub-bands of each sub-image to get processed l, a, b sub-image Lp,ap,bp.
then these processed components will be normalized to the range [0,255].These processed sub-images will be combined to get the saliency map using the following formula:
Sm = Lp(x,y) + ap (x,y) + bp(x,y)……{2}
Where Sm is the saliency map and Lp,ap,bp are processed
sub-images of Lab Color lab.
Again the saliency ma will be renormalized to the range [0,255] to get the final saliency map. Finally we can equalize the histogram of saliency ma to get sharper saliency maps.
5. RESULTS & COMPARISON
[image:5.595.67.516.71.237.2]
(a)
(b)
(c)
Figure 2. Implementation Results (a) original Image (b) Saliency Map after Histogram Equalization (c) Saliency Map without Histogram Equalization
It can be seen that our saliency maps provides the location of important objects very much accurately with acceptable resolution. Also it can be noticed that saliency maps with histogram equalization are more sharper than saliency maps without histogram equalization. No other method in literature has tried to use this feature for sharper saliency maps. Further in our approach boundaries are clearly visible.
Also we have compared or results with some other techniques like saliency map from spectral residual approach [22],
saliency map from frequency tuned approach[41] and saliency map from DWT transformed domain by Christopher [bottom up]. For this we have some simulated results for images Berkley database [44] and for other three approaches results are taken from the research paper of DWT based saliency map [42].
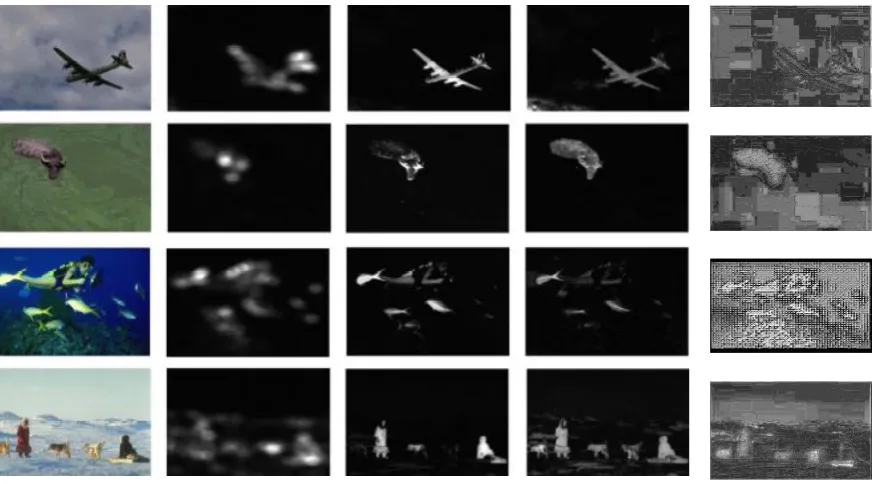
Figure 3. Implementation results: (a) original images; (b) saliency maps from spectral residual approach [22]; (c) saliency maps from frequency-tuned approach [41]; (d) saliency maps from the explored approach - using the DWT transformed
domain [42].; (e) proposed method
It can be noticed from 3(b) that saliency maps of spectral residual approach [22] highlights the important regions but the resolution is really poor. It is suitable for finding the location of important objects in the image but it is not possible to recognize the objects which makes it invalid approach for many applications like object segmentation, boundary marking etc.
In Figure 3 (c), which gives saliency maps for frequency tuned approach [41], it can be seen that saliency maps are of excellent resolution it compromise the detection of small important objects due to the reason of Gaussian smoothing as pre-processing step.
[image:5.595.69.507.383.625.2]not highlighted by the frequency approach have been highlighted. But still it can be seen in some cases this approach is not highlighting the fine sharp details like in third image the person swimming & small fishes are nor properly highlighted. This may be due to the reason that this approach has processed only the LL components of the image & it totally ignored the processing required for the other three components of the image.
In figure 3 (e), the explored approach it is clearly visible that the resolution is not very good but still acceptable & enough to highlight the important objects/regions which can be easily identified by human visual systems. Saliency maps of third & fourth picture are examples of the capability of the algorithm which shows that approach is really good at detecting important objects. In first & second figure check effect can be seen in saliency maps which can be futher neutralized by various image improvement applications. But in most of the cases, as shown in figure 2, this algorithm is good at detecting the important objects, clearly highlighting the boundaries & resolution with resolution acceptable to human visual systems.
6. CONCLUSION
In this paper, an improved algorithm for the computation of saliency map has been proposed. The proposed algorithm is based upon discrete wavelet transform (DWT) of first level. It retains the small & fine details of image by going one step further and processing the details coefficients in addition to approximation coefficients. Another new & different thing from state-of-art methods is that this technique is using histogram equalization of saliency map image which produces sharper saliency maps. With results it is clear that proposed method is better than state-of-art methods as fine details are visible &resolution is also acceptable to human visual system (HVS).In future more research can be done in this field to improve the saliency maps & to use these saliency maps in new applications like content based image retrieval, data embedding etc.
7.REFERENCES
[1] B. Wandell, Foundations of Vision, Sunderland, MA: Sinauer, 1995.
[2] O. Hershler and S. Hochstein, “At first sight: a high-level pop out effects for faces,” in Vision Research, vol. 45, no. 13, pp.1707-1724, 2005.
[3] M. Cerf, J. Harel, W. Einhauser and C. Koch, "Predicting human gaze using low-level saliency combined with face detection," in Advances in neural information processing systems, vol. 20, pp.241-248, 2008.
[4] K. C. Lai, S. C. Wong and K. Lun, “A rate control algorithm using human visual system for video conferencing systems,” in Proc. Int. Conf. Signal Processing, vol. 1, pp. 656-659, Aug. 2002.
[5] L. Tong, K. R. Rao, “Region-of-interest based rate control for low-bit-rate video conferencing,” in Journal of Electronic Imaging, vol. 15, no. 3, July, 2006.
[6] L. S. Karlsson, “Spatio-temporal pre-processing methods for region-of-interest video coding,” PhD dissertation, Sundsvall, Sweden, 2007.
[7] C.-W. Tang, C.-H. Chen, Y.-H. Yu and C.-J. Tsai, “Visual sensitivity guided bit allocation for video
coding,” in IEEE Trans.Multimedia, vol. 8, pp. 11-18, Feb. 2006.
[8] K. Minoo and T. Q. Nguyen, “Perceptual video coding with H.264,” in Proc. 39th Asilomar Conf. Signals, Systems, and Computers, Nov. 2005.
[9] C. Huang, C. Lin, “A novel 4-D perceptual quantization modeling for H.264 bit-rate control,” in IEEE Trans. On Multimedia, vol. 9, no. 6, pp. 1113-1124, 2007.
[10]L. Itti, C. Koch, and E. Niebur, “A model of saliency-based visual attention for rapid scene analysis,” in IEEE Transactions on Pattern Analysis and Machine Intelligence, vol. 20, pp. 1254-1259, Nov. 1998.
[11]L. Itti, and C. Koch, “Computational Modeling of visual attention,” in Nature Reviews, Neuroscience, vol. 2, pp. 194-203,Mar, 2001.
[12]T. Liu, N. Zheng, W. Ding and Z. Yuan, "Video attention: Learning to detect a salient object sequence," in Proc. ICPR, pp.1-4, 2008.
[13]L. Itti, “Automatic Foveation for Video Compression Using a Neurobiological Model of Visual Attention,” in IEEE Trans on Image Processing, vol. 13, no. 10, pp. 1304-1318, 2004.
[14]L. Itti, "Automatic attention-based prioritization of unconstrained video for compression," In Proc. SPIE Human Vision and Electronic Imaging, vol. 5292, pp. 272-283, 2004.
[15]W. Lai, X. Gu, R. Wang, W. Ma, and H. Zhang, “A content-based bit allocation model for video streaming,” in proc. IEEE international Conference on Multimedia and Expo (ICME), 2004.
[16]Z. Chen, G. Qiu, Y. Lu, L. Zhu, Q. Chen, X. Gu, and W. Charles, “Improving video coding at scene cuts using attention based adaptive bit allocation,”, in Proc. ISCAS, pp. 3634-3638, 2007.
[17]L. Itti and C. Koch, "A Saliency-based Search Mechanism for Overt and Covert Shifts of Visual Attention," Vision Research 40, pp. 1489-1506,2000.
[18]D. Walther and C. Koch, "Modeling Attention to Salient Protoobjects,"Neural Networks 19, pp. 1395-1407,2006.
[19]N. Tsapatsoulis and K. Rapantzikos, "Wavelet Based Estimation of Saliency Maps in Visual Attention Algorithms", LNCS 4132, pp.538-547, Springer-Verlag Berlin Heidelberg, 2006.
[20]Y.-F. Ma and H.-J. Zhang, "Contrast-based Image Attention Analysis by Using Fuzzy Growing", Proceedings of the 11th ACM International Conference on Multimedia, pp. 374-381, 2003.
[21]R. Achanta, F. Estrada, P. Wils, and S. Susstrunk, "Salient Region Detection and Segmentation", LNCS, Computer Vision Systems,Springer BerlinlHeidelberg, pp. 66-75, 2008.
[22]X. Hou and L. Zhang, "Saliency Detection: A Spectral Residual Approach", IEEE Conference on Computer Vision and Recognition 2007, pp. 1-8,2007.
Conference on Computing & Informatics 2009 (lCOCI09), pp. 475-479, 2009.
[24]U. Rajashekar, L. Cormack, and A. Boyik, "Visual Search: Structure from Noise", Proceedings of Eye Tracking Research Applications Symposium", New Orleans, Los Angeles, USA, pp. 119-123,2002.
[25]W.-J. Won, S. Jeong, and M. Lee, "Road Traffic Sign Saliency Map Model", Proceedings of Image and Vision Computing New Zealand 2007, New Zealand, pp. 91-96, 2007.
[26]A, Bamidele, F. Stentiford, and J. Morphett, "An Attention-based Approach to Content-Based Image Retrieval", BT Technology Journal, 22 (7), pp. 151-160, 2004.
[27]M. C. Park and K. J. Cheoi, "A Digital Image Watermarking Using A Feature-Driven Attention Module", Proceedings of Visualization,Image, and Image Processing, 2002.
[28]A. P. Bradley and W. M. Stentiford, "Visual Attention for Region of Interest Coding in JPEG 2000", Journal of Vision, Communication, and Image Representation, pp. 232-250,2003.
[29]R. Hong, W. Chao, W. Meng, and F. Sun, "Salience Preserving Multi-Focus Image Fusion With Dynamic Range Compression", International Journal of Innovative Computing, Information and Control ICIC International, Vol. 5, No. 8, 2009.
[30]S. Frintrop, M. Klodt, and E. Rome. A real-time visual attention system using integral images. International Conference on Computer Vision Systems, 2007.
[31]L. Itti and P. F. Baldi. Bayesian surprise attracts human attention.Advances in Neural Information Processing Systems,19:547–554, 2005.
[32]J. Harel, C. Koch, and P. Perona. Graph-based visual saliency. Advances in Neural Information Processing Systems, 19:545–552, 2007.
[33]T. Kadir, A. Zisserman, and M. Brady. An affine invariant salient region detector. European Conference on Computer Vision, 2004.
[34]C. Koch and S. Ullman. Shifts in selective visual attention: Towards the underlying neural circuitry. Human Neurobiology, 4(4):219–227, 1985.
[35]N. Bruce and J. Tsotsos. Attention based on information maximization. Journal of Vision, 7(9):950–950, 2007.
[36]B. Olshausen, C. Anderson, and D. Van Essen. A neurobiological model of visual attention and invariant pattern recognition based on dynamic routing of information. Journal of Neuroscience, 13:4700–4719, 1993.
[37]J. K. Tsotsos, S. M. Culhane,W. Y. K.Wai, Y. Lai, N. Davis, and F. Nuflo. Modeling visual attention via selective tuning. Artificial Intelligence, 78(1-2):507–545, 1995.
[38]R. Achanta, F. Estrada, P. Wils, and S. S¨usstrunk. Salient region detection and segmentation. International Conference on Computer Vision Systems, 2008.
[39]Y. Hu, X. Xie, W.-Y. Ma, L.-T. Chia, and D. Rajan. Salient region detection using weighted feature maps based on the human visual attention model. Pacific Rim Conference on Multimedia, 2004.
[40]L. Itti and C. Koch. Comparison of feature combination strategies for saliency-based visual attention systems. SPIE Human Vision and Electronic Imaging IV, 3644(1):473–482, 1999.
[41]R. Achanta, S. Hemami, F. Estrada, and S. Sllsstrunk, "Frequency tuned Salient Region Detection", IEEE International Conference on Computer Vision and Pattern Recognition (CVPR), 2009.
[42]C. Ngau, Li-Minn and K. Seng “Bottom up Visual Saliency Ma using Waveelet Transform Domain” 978-1-4244-5540-9/10/$26.00 ©2010 IEEE.
[43]B. Zhang, Y. Zheng, and Q. Zhang, "Extracting Regions of Interest Based on Phase Spectrum and Morphological Approach",Proceedings of the International Colloquium on Computing, Communication, Control, and Management (ISECS), pp. 427-430, 2009.