Overlapping Patterns Recognition with Linear and
Non-Linear Separations using Positive Definite
Kernels
Chiheb-Eddine Ben N’Cir
LARODEC, ISGT, University of Tunis41 rue de la liberte, 2000 Le Bardo, tunis, Tunisie
Nadia Essoussi
LARODEC, ISGT, University of Tunis41 rue de la liberte, 2000 Le Bardo, tunis, Tunisie
ABSTRACT
The detection of overlapping patterns in unlabeled data sets re-ferred as overlapping clustering is an important issue in data mining. In real life applications, overlapping clustering algorithm should be able to detect clusters with linear and non-linear separa-tions between clusters. We propose in this paper an overlapping clustering method based k-means algorithm using positive defi-nite kernel. The proposed method is well adapted for clustering multi label data with linear and non linear separations between clusters. Experiments, performed on overlapping data sets, show the ability of the proposed method to detect clusters with com-plex and non linear boundaries. Empirical results obtained with the proposed method outperforms existing overlapping methods.
General Terms:
Pattern recognition, Clustering
Keywords:
Overlapping Clustering, Multi-labels data, k-means algorithm, Non-linear Boundaries, Kernel methods
1. INTRODUCTION
Clustering is an important task in data mining. It aims to di-vide data into groups where similar observations are assigned to the same group called cluster. It has been applied success-fully in many fields such as marketing that finds groups of cus-tomers with similar purchasing behaviors, biology that groups unlabeled plants or animals into species and document classi-fication that groups related documents into clusters. Many ap-plications of clustering require assigning observations to several clusters. This kind of application is referred as overlapping clus-tering [1, 7].
Overlapping clustering is based on the assumption that an obser-vation can really belong to several clusters. In this cluster con-figuration, an observation may belong to one or several clusters without any membership coefficient and the resulting clustering is a cover. The resolution of this problem contributes to solve many real life problems that require to find overlapping clusters in order to fit the data set structure. For example, in video classi-fication, overlapping clustering is a necessary requirement while video can potentially have multiple genres. In emotion detecting, overlapping clustering methods should be able to detect several emotions for a specific piece of music.
Several overlapping clustering methods based on hierarchical [9, 4], graph-based [10, 11] and partitioning [5, 1] approaches are proposed in the literature. An overlapping clustering method based k-means algorithm was proposed in [7] and referred as Overlapping k-means(OKM). The OKM method introduces op-timality of overlapping clusters in the objective function which is optimized iteratively over the learning process. The main draw-back of this method, as well as k-means based clustering meth-ods, is its inability to detect clusters with complex and non linear clusters shapes. This problem can be crucial in real life applica-tions where shapes of clusters are generally non linear and non spherical. To detect non linear separations between overlapping clusters, an existing method (Kernel overlapping k-means)[3] ex-tends OKM by kernelization of the metric. This method is not well adapted to discover overlapping clusters since prototypes are performed in the input space and only distances are per-formed in the feature space.
We propose in this paper, a kernel based overlapping k-means method referred as Kernel Overlapping k-means (KOKMφ) able to produce overlapping clusters with non linear overlapping boundaries making the method adapted for clustering complex data. In the proposed KOKMφmethod, kernels induce an im-plicit mapping of the input patterns and the algorithm is applied in a new space. Therefore, the representative of clusters will be performed in the induced space as well.
This paper is organized as follows: Section 2 gives a summary of existing overlapping clustering methods based k-means al-gorithm and describes advantages of Positive Definite Kernels (Mercer Kernel) used with clustering method. Section 3 presents the kernel based overlapping k-means method that we propose. Experiments on different data sets and using different kernels are described and discussed in Section 4. Finally, Section 5 presents conclusion and future works.
2. PRELIMINARIES
2.1 Mercer Kernel
To solve the problem of non spherical and non linear separations between clusters, many methods have been modified incorpo-rating kernel such as SVM [8], Kernel PCA [15] and kernel k-means [13]. These proposed classification methods use Mercer Kernel to implicitly map data from original space called input space into a high dimensional space called feature space. Com-puting a linear partitioning in this feature space results in a non-linear partitioning in the input space.
N X i=1 N X j=1
cicjKij≥0 ∀N≥2, (1)
wherecr∈R ∀r= 1, ..., NandKijrepresents the dot prod-uct of mapped data in feature space that can be expressed as fol-lows:
Kij=φ(xi).φ(xj), (2) whereφ:X −→F performs a mapping from the input space Xto a high dimensional feature spaceF.
The use of Mercer kernel in clustering methods can be divided in three categories [12]: methods based onkernelization of the metric[17, 18] which look for centroids in input space and the distances between patterns and centroids are computed by means of kernels, methods based onclustering in feature space[14, 13] which map data into a higher feature space and then compute centroids using the Kernel Trick and methods basedsupport vec-tors[6, 2] which use one class SVM to find a minimum enclosing sphere in feature space able to enclose almost all data in feature space.
2.2 Kernel K-Means
Kernel means is an extension of the standard algorithm k-means to solve the problem of non-linearly separable clusters. For a finite data sampleX, the Kernel k-means aims at minimiz-ing the sum of squared Euclidean errors in feature space given by :
J(Π) =
N X i=1 C X c=1
Pickφ(xi)−mφck 2
, (3)
wherePicis a binary variable indicating membership of obser-vationxi to clustercandmφc is the prototype of clustercin feature space. The prototype is defined as the gravity center, in the feature space, of observations that belong to clusterc. This prototype cannot be computed because the mapping functionφis generally unknown. However, the clustering errorkφ(xi)−mφck can be computed using the Kernel Trick as follows:
kφ(xi)−mφck
2=kφ(x i)−
1
Wc N X
j=1
Pjcφ(xj)k2
=Kii−
2
Wc N X
j=1
PjcKij+
1 (Wc)2
N X
j= 1 N X
g= 1
PjcPgcKjg,(4)
whereWc= N X
j=1
Pjcis the number of observations that belong to clusterc,Pjc∈ {0,1}andPgc∈ {0,1}indicate membership of observationxjandxg to clusterc. Then, the clustering error function in kernel k-means can be presented as follows:
J(Π) =
N X i=1 C X c=1
Pic[Kii−
2
Wc N X
j=1
PjcKij+
1 (Wc)2
N X
j= 1 N X
g= 1
PjcPgcKjg]. (5)
To minimize this clustering error function, kernel k-means per-forms two principal steps: the determination of the nearest clus-ter from each observation in feature space and the update of membership matrix of each object. The stopping rule is defined by the maximal number of iterations and the minimal improve-ment of the objective function between two iterations.
2.3 Overlapping k-means and Kernelization of the Metric
Overlapping k-means (OKM) [7]is an extension of the k-means algorithm and aims to produce overlapping clusters. The min-imization of the objective function is performed by iterating two principal steps: 1) computation of clusters prototypes and 2) multi assignment of observations to one or several clusters. Given a set of data vectorsX ={xi}
N
i=1withxi∈RdandN is the number of data vectors, the aim of OKM is to find a set
Π ={πc}kc=1ofkoverlapping clusters such that the following objective function is minimized:
J(Π) = X
xi∈X
kxi−im(xi)k2. (6)
This objective function minimizes the sum of squared Euclidean distances between observationxiand its imageim(xi)for all xi∈X. Imageim(xi)is defined as the gravity center of clusters prototypes to which observationxibelongs as shown by eq. 7.
im(xi) = X
c∈Ai
mc/|Ai|, (7)
whereAi is the set of clusters to whichxi belongs andmc is the prototype of clusterc. The stopping rule of OKM algorithm is characterized by two criteria: the maximum number of iter-ations and the minimum improvement of the objective function between two iterations. Although the performance of this method to detect overlapping clusters, OKM method is not appropriate for clusters that have non linear separations. OKM method fails when clusters have a complex boundaries or when clusters are concentric.
A recent proposed method referred as Kernel overlapping k-means (KOKM) [3], proposes a kernelization of the metric used in OKM using the kernel induced distance measure. The objec-tive function of KOKM minimizes the sum of kernel induced distance between observationxi and its image im(xi)for all xi∈X. The imageim(xi)is computed in input space and then mapped to the feature space usingφ(im(xi)).
Unlike Kernel k-means, the KOKM method have the drawbacks that images and prototypes are performed in input space and only distances between observations are performed in the fea-ture space. The KOKM method belongs to the family of meth-ods based kernelization of the metric where kernels play a role only in the computation of distances. In fact, Methods based on kernelization of the metric are less efficient then methods based clustering in feature space where all the learning process is per-formed in the feature space
3. KOKMφ: KERNEL OVERLAPPING
K-MEANS IN FEATURE SPACE
We propose in this paper a Kernel based overlapping clustering method where the whole learning process is performed in a high dimensional space like kernel k-means.
The main algorithm of KOKMφ method iteratively minimizes the distance between each observation and its image in the fea-ture space. The principal function to minimize can be described by:
J(Π) = X
xi∈X
kφ(xi)−im(φ(xi))k2. (8)
im(φ(xi)) = C X
c=1 Pic.mφc C X
c=1 Pic
, (9)
wherePic ∈ {0,1}is a binary variable that indicates member-ship of observationxito clustercandmφc is the prototype of clustercin the feature space.
3.1 Prototypes Computation in Feature Space
The computation of images in feature space needs the definition of clusters prototypes in the same induced space. The clusters centroids are replaced by clusters medoids where each cluster prototype is defined as the medoid (observation) that minimizes all distances over all observations included in this cluster. The prototype is expressed as follows:
mc= min i∈Nc(xi)
Nc X
j=1,j6=i
wjkφ(xi)−φ(xj)k2
Nc. Nc X
j=1,j6=i wj
, (10)
whereNcis the number of observations that belong to clusterc andwj=|Aj|is a weight of the distance between observation xj and observationxi depending on the number of clusters to which observationxjbelongs. This weight is more important if observationjbelongs to more than one cluster to take into ac-count that overlapping observationxjhave a small probability to be a prototype of the cluster. In this way, the prototype is de-termined in the feature spaceF and is member of initial set of observations.
Using kernel function, the prototype can be determined as fol-lows:
mc= min i∈Nc
(xi) Nc X
j=1,j6=i
wj[Kii−2Kij+Kjj]
Nc. Nc X
j=1,j6=i wj
. (11)
3.2 Clustering Algorithm of KOKMφ
Given clusters prototypes in the feature space, the objective func-tionJcan be computed as shown in eq. 12.
J(Π) = X
xi∈X
kφ(xi)−im(φ(xi))k2
J(Π) = X
xi∈X
kφ(xi)− C X
c=1
Pic.φ(mc) Li
k2
= X
xi∈X
d[φ(xi), im(φ(xi))], (12)
whered[φ(xi), im(φ(xi))]is defined by:
= φ(xi).φ(xi)−
2
Li C X
c=1
Pic.φ(mc).φ(xi) +
1 (Li)2
C X c=1 C X l=1
Pic.Pil.φ(mc).φ(ml)
= Kii−
2
Li C X
c=1
Pic.Kimc+
1 (Li)2
C X c=1 C X l=1
Pic.Pil.Kmcm(13)l,
andLi= C X
c=1
Pic. At each iteration, clusters prototypes are com-puted, observations are assigned to many clusters and the func-tionJis evaluated. These steps are repeated until improvement ofJ is not significative or the maximum number of iterations is reached. The main algorithm of KOKMφcan be described as follows:
Algorithm 1KOKM φ(X, tmax, ε, C)→ {πc}Cc=1
Require: X: set of vector inRd. tmax: maximum number of iterations. ε: minimal improvement in objective function. C: number of clusters.
Ensure: Π: set of C clusters.
1: Choose the kernel function and its corresponding parame-ters.
2: Initialize prototypes of clusters with random clusters proto-types, initialize clusters memberships using ”ASSIGN φ” and derive value of the objective functionJt=0(Π)in itera-tion0using eq. 12.
3: Compute clusters prototypes using eq. 11.
4: Assign observations to one or several clusters using ”ASSIGN φ”.
5: Compute objective functionJt(Π)using eq. 12. 6: if (t < tmaxandJt−1(Π)−Jt(Π)> ε)then 7: go to step 3.
8: else
9: return the distribution of clusters memberships. 10: end if
3.3 Multi assignment of observation to one or several clusters
The functionASSIGN φis used to assign an observation to one or several clusters in KOKMφmethod. This function consists in assigning an observation iteratively to the closest cluster while the distance in the feature space between the observation and its image decreases. The closest cluster from an observationxiin feature space is defined by:
m?c= min
{mc}Cc=1
kφ(xi)−φ(mc)k2. (14)
This equation can be computed in feature space as follows:
m?
c = min
{mc}C c=1
φ(xi).φ(xi)−2φ(xi).φ(mc) +φ(mc).φ(mc)
= min
{mc}Cc=1
Kii−2Kimc+Kmcmc, (15)
The ASSIGNφfunction used in the KOKMφmethod to assign observations to one or many clusters is summarized in Algo-rithm. 2 .
4. EXPERIMENTS AND DISCUSSIONS
Experiments are performed on Iris, Movie1and Music emotion2
data sets. For each data set, the number of clusters was set by the number of underlying labels in the labeled data set. Table1
Algorithm 2ASSIGN φ(xi,{m0c}Cc=1, Aoldi )→Ai
Require: xi: Vector inRd. {C1...Cc}: Set of clusters. Aold
i : Old affectation of observationi.
Ensure: Ai: New affectation ofxi. 1: GivenAi={m?c}wherem?c= min
{Cc}C c=1
kφ(xi)−φ(mc)k2, Compute distance in feature space between observation φ(xi)and it’s imageim(φ(xi))with affectationsAiusing eq. 13.
2: Look for the next nearest clusterm?
cwhich is not included in Aisuch thatm?c = min
{Cc}C c=1/Ai
kφ(xi)−φ(mc)k2 and compute distance between observationφ(xi)and it’s image im0(φ(x
i))with affectationsAi∪m?c
3: ifkφ(xi)−im0(φ(xi))k2<kφ(xi)−im(φ(xi))k2then 4: Ai←Ai∪ {m?c}and go to step 2.
5: else
6: computeimoldwith affectationAold i .
7: ifkφ(xi)−φ(im(xi))k2 ≤ kφ(xi)−φ(imold(xi))k2
then
8: returnAi. 9: else
10: returnAold i . 11: end if
[image:4.595.312.547.87.512.2]12: end if
Table 1. Statistics of used data sets
Data set Observation Dimension Labels Overlap
Iris 150 4 3 1
Movie 75 3 3 1.14
Music 548 72 6 1.81
shows the statistics of each data set. ”labels” is the number of labels on the data set. ”Overlap” is the average number of labels per observation.
Overlap= 1/|X|X
xi∈X
|Πi|, (16)
where|X|is the number of observations and|Πi|is the number of label assignments of observationxi. The size of overlap influ-ences the performance of overlapping clustering methods when evaluated over external validation measures.
Results are compared according to three external validation mea-sures: Precision, Recall and F-measure [16]. These validation measures attempt to estimate whether the prediction of cate-gories is correct with respect to the underlying true catecate-gories in the data. Precision is calculated as the fraction of observation correctly labeled as belonging to the positive class divided by the total number of observations labeled as belonging to the positive class. Recall is the fraction of observations correctly labeled as belonging to the positive class divided by the total number of ele-ments that actually belong to the positive class. The F-measure is the harmonic mean of Precision and Recall. All these measures are performed separately on each cluster than the average value of all clusters is reported.
Precision =N CLO/T N LO Recall =N CLO/T N AC
F-measure = 2*Precision*Recall / Precision+Recall
where NCLO, TNLO and TNAC are respectively the number of correctly labeled observations, the total number of labeled obser-vations and the total number of obserobser-vations that actually belong to the positive class.
Different widely used Positive Definite Kernels are implemented within the KOKMφmethod such as the Polynomial Kernel, the Gaussian kernel, the Exponential kernel, the Laplace kernel, the
Table 2. Examples of Positive Definite Kernels
Kernel function Value
Linear Kernel K(xi, xj) =xi.xj Polynomial Kernel K(xi, xj) = ((xi.xj) + 1)d
Gaussian RBF Kernel K(xi, xj) = exp(
−kxi−xjk2 2σ2 )
Exponential RBF Kernel K(xi, xj) = exp(
−kxi−xjk 2σ2 )
Laplace Kernel K(xi, xj) = exp(
−kxi−xjk σ )
Quadratic Kernel K(xi, xj) = 1−
kxi−xjk2
kxi−xjk2+c
Inverse Multi quadratic Kernel K(xi, xj) =
1 p
kxi−xjk2+c2
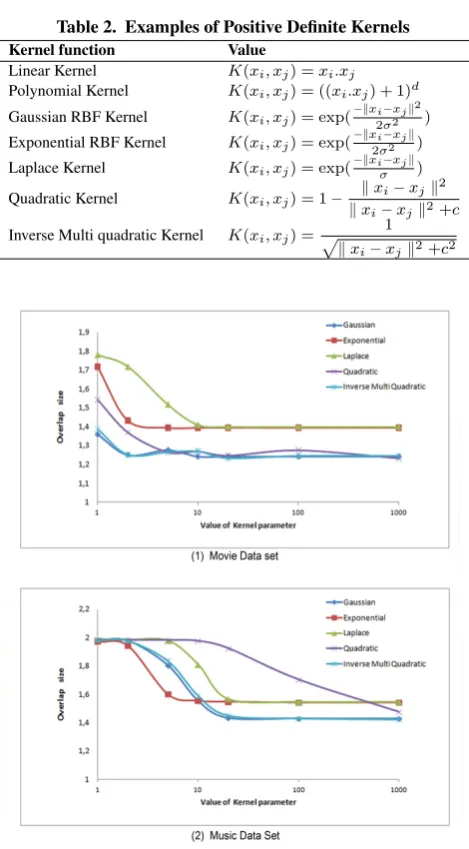
Fig. 1. Impact of the value of kernel parameter used with the KOKMφmethod in Movie and Music data sets
Quadratic and the Inverse Multi Quadratic kernel as described in Table 2.
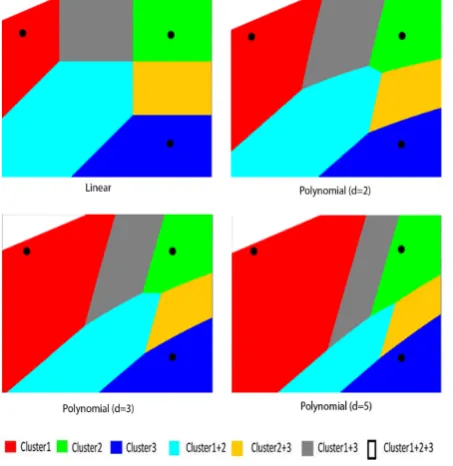
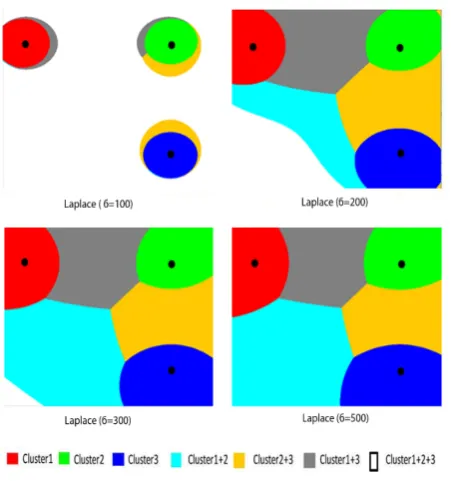
To visualize structures of patterns detected by the proposed method with respect to the type of kernel, we build Vorono¨ı cells (for3clusters) obtained with KOKMφmethod using different kernels with different parameters. Figure 2 proves the ability of KOKMφmethod used with the Polynomial and the Linear Ker-nel to detect overlapping clusters with linear boundaries. Figure 3 to Figure 7 prove the ability of KOKMφto detect overlapping clusters with non linear and non spherical separations. Some ker-nels have a similar behavior and can detect the same patterns : for example the Laplace kernel (withσ = 100) and the Quadratic kernel (with c=5500) build identical clusters shapes as shown in Figure 5 and Figure 6.
[image:4.595.54.285.119.420.2]Table 3. Comparison between KOKMφand existing methods in Iris, Movie and Music data sets
Dataset Method Precision Recall F-measure Overlap
Iris
k-means 0.897±0.02 0.886±0.02 0.891±0.02 1.0±0.00 kernel k-means 0.927±0.01 0.928±0.02 0.927±0.01 1.0±0.00 OKM 0.707±0.06 0.900±0.07 0.815±0.06 1.34±0.08 KOKM with RBF kernel 0.712±0.05 0.894±0.08 0.821±0.07 1.29±0.11 KOKMφwith RBF kernel 0.830±0.09 0.971±0.05 0.895±0.07 1.22±0.10
Movie
k-means 0.731±0.04 0.544±0.04 0.623±0.04 1.0±0.00 kernel k-means 0.777±0.03 0.605±0.04 0.680±0.03 1.0±0.00 OKM 0.520±0.08 0.802±0.09 0.643±0.08 1.60±0.10 KOKM with RBF kernel 0.590±0.04 0.791±0.09 0.671±0.05 1.55±0.08 KOKMφwith RBF kernel 0.703±0.15 0.687±0.14 0.692±0.10 1.24±0.02
Music
[image:5.595.137.465.313.623.2]k-means 0.501±0.02 0.233±0.02 0.288±0.02 1.00±0.00 kernel k-means 0.586±0.04 0.213±0.06 0.313±0.05 1.00±0.00 OKM 0.397±0.11 0.332±0.05 0.362±0.08 2.45±0.12 KOKM with RBF kernel 0.401±0.09 0.341±0.01 0.372±0.05 2.40±0.13 KOKMφwith RBF kernel 0.570±0.07 0.356±0.01 0.438±0.01 1.98±0.01
Table 4. Results on Movie Data set using KOKMφmethods with Different types of kernels
Kernel Value Precision Recall F-measure Overlap
Linear 0.707±0.15 0.680±0.13 0.691±0.10 1.22±0.05
Polynomial kernel
d= 2 0.705±0.06 0.674±0.14 0.684±0.09 1.25±0.11
d= 3 0.725±0.05 0.687±0.16 0.701±0.09 1.22±0.11
d= 4 0.723±0.06 0.681±0.01 0.697±0.10 1.22±0.10
d= 5 0.704±0.03 0.615±0.13 0.655±0.07 1.22±0.13
Gaussian
σ= 1 0.646±0.14 0.697±0.12 0.668±0.09 1.36±0.13
σ= 10 0.703±0.15 0.687±0.14 0.692±0.10 1.24±0.02
σ= 20 0.703±0.15 0.687±0.14 0.692±0.10 1.24±0.02
RBF kernel σ= 100 0.703±0.15 0.687±0.14 0.692±0.10 1.24±0.02
σ= 10000 0.703±0.15 0.687±0.14 0.692±0.10 1.24±0.02
Exponential
σ= 1 0.588±0.09 0.746±0.14 0.654±0.06 1.71±0.13
σ= 10 0.655±0.13 0.736±0.11 0.689±0.08 1.39±0.13
σ= 20 0.655±0.13 0.736±0.11 0.689±0.08 1.39±0.13
RBF kernel σ= 100 0.655±0.13 0.736±0.11 0.689±0.08 1.39±0.13
σ= 10000 0.655±0.13 0.736±0.11 0.689±0.08 1.39±0.13
Laplace σ= 1 0.568±0.08 0.715±0.14 0.627±0.09 1.78±0.03
σ= 20 0.649±0.12 0.736±0.11 0.686±0.07 1.41±0.13
kernel σ= 100 0.655±0.13 0.736±0.11 0.689±0.08 1.40±0.13
σ= 10000 0.655±0.13 0.736±0.11 0.689±0.08 1.40±0.13
Quadratic
c= 1 0.613±0.11 0.738±0.15 0.663±0.06 1.54±0.00
c= 10 0.685±0.11 0.675±0.15 0.677±0.14 1.27±0.10
c= 20 0.663±0.13 0.0.672±0.13 0.663±0.13 1.24±0.16
kernel c= 100 0.672±0.12 0.674±0.14 0.669±0.13 1.27±0.10
c= 1000 0.707±0.15 0.685±0.14 0.693±0.11 1.23±0.02
Inverse multi
c= 1 0.640±0.13 0.707±0.11 0.667±0.08 1.38±0.22
c= 10 0.672±0.13 0.670±0.15 0.667±0.14 1.27±0.10
c= 20 0.713±0.16 0.687±0.14 0.697±0.11 1.23±0.02
Quadratic kernel c= 100 0.644±0.14 0.625±0.17 0.630±0.16 1.24±0.08
c= 1000 0.644±0.14 0.625±0.17 0.630±0.16 1.24±0.08
Table 3 presents results obtained with KOKMφmethod versus k-means, kernel k-k-means, OKM and KOKM methods in terms of precision, recall and F-measure for the data sets described in Ta-ble 1. Each reported result is an average over twenty runs of each algorithm with the same initialization on each run. For all kernel based methods, we use the Gaussian RBF Kernel with the best parameter value (determined empirically through different tests). The F-measure obtained with KOKMφmethod outperforms the F-measure obtained with existing methods. The improvement of F-measure using KOKMφcompared to OKM and KOKM meth-ods, is induced by the improvement of the Precision and the Re-call. This result proves the theoretical finding that looking for
separations between clusters in the feature space is better than looking for separations in the original space.
Table 5. Results on Music Data set using KOKMφmethods with Different types of kernels
Kernel Value Precision Recall F-measure Overlap Linear 0.492±0.01 0.301±0.02 0.374±0.02 1.42±0.05
Polynomial kernel
d= 2 0.480±0.02 0.286±0.02 0.358±0.01 1.40±0.05
d= 3 0.486±0.01 0.300±0.01 0.370±0.01 1.45±0.01
d= 4 0.482±0.02 0.289±0.01 0.364±0.01 1.41±0.05
d= 5 0.486±0.01 0.284±0.01 0.363±0.01 1.43±0.03
Gaussian
σ= 1 0.570±0.07 0.356±0.01 0.438±0.01 1.98±0.01
σ= 10 0.481±0.02 0.318±0.02 0.383±0.02 1.55±0.04
σ= 20 0.490±0.01 0.291±0.03 0.365±0.03 1.43±0.08
RBF kernel σ= 100 0.494±0.02 0.302±0.02 0.375±0.02 1.43±0.05
σ= 10000 0.493±0.02 0.302±0.02 0.375±0.02 1.43±0.05
Exponential
σ= 1 0.476±0.03 0.375±0.05 0.420±0.04 1.99±0.01
σ= 10 0.480±0.02 0.319±0.02 0.383±0.02 1.55±0.05
σ= 20 0.480±0.02 0.317±0.02 0.382±0.01 1.54±0.05
RBF kernel σ= 100 0.480±0.02 0.317±0.02 0.382±0.01 1.54±0.05
σ= 10000 0.480±0.02 0.317±0.02 0.382±0.01 1.54±0.05
Laplace σ= 1 0.472±0.04 0.365±0.03 0.412±0.04 1.98±0.01
σ= 20 0.476±0.02 0.342±0.02 0.398±0.02 1.81±0.01
kernel σ= 100 0.478±0.02 0.320±0.01 0.383±0.01 1.56±0.05
σ= 10000 0.480±0.02 0.317±0.02 0.382±0.01 1.54±0.05
Quadratic
c= 1 0.476±0.03 0.374±0.05 0.419±0.04 1.98±0.01
c= 10 0.476±0.03 0.371±0.04 0.417±0.04 1.97±0.01
c= 20 0.476±0.03 0.355±0.05 0.407±0.04 1.92±0.01
kernel c= 100 0.476±0.02 0.325±0.027 0.386±0.02 1.70±0.06
c= 1000 0.486±0.02 0.298±0.04 0.369±0.03 1.47±0.06
Inverse multi
c= 1 0.476±0.03 0.373±0.05 0.418±0.04 1.98±0.01
c= 10 0.477±0.01 0.317±0.02 0.381±0.02 1.59±0.04
c= 20 0.486±0.03 0.308±0.02 0.377±0.02 1.45±0.09
Quadratic kernel c= 100 0.495±0.01 0.302±0.02 0.375±0.02 1.43±0.07
[image:6.595.58.285.453.686.2]c= 1000 0.494±0.01 0.296±0.01 0.370±0.01 1.42±0.05
Fig. 2. Voronoi cells obtained with Linear and Polynomial kernel using KOKMφmethod
In fact, the Kernel contains all information about structures of patterns in the feature space through the Kernel Matrix. By vary-ing values of the kernel parameter, two extreme situations may be reached : the overfitting or the underfitting. Geometrically, the overfitting corresponds to patterns being mapped to
orthogo-Fig. 3. Voronoi cells obtained with Gaussian RBF kernel using KOKMφmethod
[image:6.595.310.541.453.687.2]en-Fig. 4. Voronoi cells obtained with Exponential kernel using KOKMφmethod
Fig. 5. Voronoi cells obtained with Laplace kernel using KOKMφ
method
tries are close to1. However, if a Kernel Matrix is completely uniform, the underfitting situation is reached.
5. CONCLUSION
We proposed in this paper a kernel based overlapping k-means method to detect overlapping patterns in unlabeled data sets. The proposed method performs all the learning process in a high di-mensional feature space where data are explicitly mapped using Positive Definite Kernels. Experiments prove the efficiency of KOKMφto detect clusters with linear and non linear boundaries making the method adapted for real life applications of overlap-ping clustering where separations between clusters are complex.
[image:7.595.57.282.98.331.2]Fig. 6. Voronoi cells obtained with Quadratic kernel using KOKMφmethod
Fig. 7. Voronoi cells obtained with Inverse Multi Quadratic kernel using KOKMφmethod
This proposed method can be applied for many other application domains where observations needs to be assigned to more than one cluster and where patterns cannot be described by explicit feature vectors such as images and texts. For such data sets, we plan to conduct experiments on structured non vectorial data us-ing a specific designed kernels such as Strus-ings and Histograms.
6. REFERENCES
[1] Arindam Banerjee, Chase Krumpelman, Sugato Basu, Raymond J. Mooney, and Joydeep Ghosh. Model based overlapping clustering. InInternational Conference on Knowledge Discovery and Data Mining, Chicago, USA, 2005. SciTePress.
[image:7.595.317.543.355.594.2] [image:7.595.57.283.378.619.2]Re-search, 2:125–137, 2001.
[3] Chiheb BenN’Cir, Nadia Essoussi, and Patrice Bertrand. Kernel overlapping k-means for clustering in feature space. In Interna-tional Conference on Knowledge discovery and Information Re-trieval KDIR, pages 250–256, Valencia, SPA, 2010. SciTePress Digital Library.
[4] P. Bertrand and M. F. Janowitz. The k-weak hierarchical represen-tations: an extension of the indexed closed weak hierarchies. Dis-crete Applied Mathematics, 127(2):199–220, 2003.
[5] James C. Bezdek, Robert Ehrlich, and William Full. Fcm: The fuzzy c-means clustering algorithm.Computers amp; Geosciences, 10(23):191 – 203, 1984.
[6] Francesco Camastra and Alessandro Verri. A novel kernel method for clustering.IEEE Transactions on Pattern Analysis and Machine Intelligence, 27:801–804, 2005.
[7] Guillaume Cleuziou. An extended version of the k-means method for overlapping clustering. InInternational Conference on Pattern Recognition ICPR, pages 1–4, Florida, USA, 2008. IEEE.
[8] Corinna Cortes and Vladimir Vapnik. Support vector networks. Machine Learning, 20:273–297, 1995.
[9] E. Diday. Orders and overlapping clusters by pyramids. Technical Report 730, INRIA, France, 1984.
[10] Walter Didimo, Francesco Giordano, and Giuseppe Liotta. Over-lapping cluster planarity. InProceedings of the six International Asia-Pacific Symposium on Visualization, pages 73–80, 2007.
[11] Michael R. Fellows, Jiong Guo, Christian Komusiewicz, Rolf Nie-dermeier, and Johannes Uhlmann. Graph-based data clustering with overlaps.Discrete Optimization, 8(1):2–17, 2011.
[12] Maurizio Filippone, Francesco Camastra, Francesco Masulli, and Stefano Rovetta. A survey of kernel and spectral methods for clus-tering.Pattern Recognition, 41(1):176 – 190, 2008.
[13] Mark Girolami. Mercer kernel-based clustering in feature space. IEEE Transactions on Neural Networks, 13(13):780–784, 2002.
[14] A. K. Qinand and P. N. Suganthan. Kernel neural gas algorithms with application to cluster analysis.International Conference on Pattern Recognition, 4:617–620, 2004.
[15] Bernhard Sch¨olkopf, Alexander Smola, and Klaus-Robert M¨uller. Nonlinear component analysis as a kernel eigenvalue problem. Neural Computation, 10(5):1299–1319, 1998.
[16] Grigorios Tsoumakas, Ioannis Katakis, and Ioannis Vlahavas. Min-ing Multi-label Data. InData Mining and Knowledge Discovery Handbook, chapter 34, pages 667–685. Boston, MA, 2010.
[17] Daoqiang Zhang and Songcan Chen. Kernel-based fuzzy and pos-sibilistic c-means clustering. InInternational Conference on Ar-tificial Neural Networks (ICANN03), pages 122–125, Istanbul, Turkey, 2003.