Cluster Analysis: An Experimental Study
Sathya Ramadass
Asst. Professor, Dept. of MCA, Jyoti Nivas College (Autonomous),Bangalore, India.
Annamma Abraham
, PhD. Professor and Head, Dept. of Mathematics,B.M.S.Institute of Technology, Bangalore, India.
ABSTRACT
Clustering plays a vital role in machine based learning algorithms and in the present study, it is found that, the competitive learning algorithm that is very efficient for a number of non-linear real-time problems, offers efficient solution for clustering. This paper presents a comparative account of organizing models and proposes a hybrid self-organizing model for cluster analysis. The potential usefulness of cluster analysis for higher education scenario is taken to study in this paper.
Keywords
ART, Classification, Clustering, HSOM, SOM, Supervised learning; Unsupervised learning;
1. INTRODUCTION
Clustering is an unsupervised method of classifying patterns into groups. These groupings of objects occur based on the similarity that exists between the input patterns. There are various clustering algorithms such as, Statistical, Hierarchical, Partitioned, Numerical, K-means, Squared Error, Machine Learning are available [1,2]. All these algorithms organize data into meaningful structures. The structure that are formed by these algorithms, can be further used for data analysis, information retrieval, pattern recognition, image segmentation, knowledge acquisition, prediction, forecasting etc [3,4]. Thus, clustering is a potential tool available for researchers. This paper, evaluates various NN based unsupervised clustering models and proposes a hybrid model for one specific example. This is revised and extended version of authors’ previous paper [5].
The subsequent sections describe the self-organizing clustering methods based on the neural network model for analyzing post graduate students performance data and evaluate its performance and present the results of its application to educational institution.
2. NEURAL NETWORK CLUSTERING
MODELS
Neural Networks (NN) are paradigm in intelligent computing inspired by the biological neuron function. They contain layers of neurons with activation function which define the states of each neuron and thus express the over all state of the system. The computational tasks include presentation of input patterns to the input layer; propagation of activity signal through the network and finally the output of the system is calculated. In other words, the NN performs input-output mapping of data set presented to the system. The behavior of this mapping between input and output is calculated by the synaptic weights on the connection between the neurons in the respective layers. The adaptation of tuning the synaptic weights to obtain the task of the system is called learning or learning rule.
NN learning can be classified into Supervised, Unsupervised, Reinforcement and Statistical learning derived from its principle. For example, a NN that employs Supervised Learning (SL) is trained to classify a set of patterns according to the predefined similarity measures, whereas, NN with Unsupervised Learning (USL), cluster the set of input patterns with no prior information about the instances. The main difference between these two algorithms in this situation is, the SL classifies labeled patterns that are provided by the problem instance, and the problem is to label a newly encountered, yet unlabeled pattern. In USL, the problem is to group the unlabeled input patterns into meaningful clusters and obtain labels from the data [6].
In real world, there are many problems with none or fewer prior information about the problem instances and states such as character recognition, speech recognition etc. In such case, clustering methodology is the best approach to find the relationship among the data sets and the information extracted from the preserved structures becomes the decision rules for the problem instances. USLNN model adaptively cluster instances into clusters or decision classes and hence, cluster performs well with unsupervised NN model. USL adapts Competitive or Hebbian learning rule [5].
2.1 Competitive Dynamics
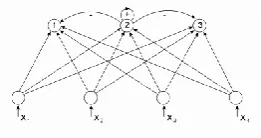
[image:1.595.376.507.498.567.2]Most of the USL adapts Competitive Dynamics (CD). In a CD, competition occurs among a group of neurons in a layer.
Fig 1: Competitive Dynamics of a Neuron
All these neurons have two set of connections, feedforward connection that carries the same set of input signals to them called excitatory, and feedback connections among the neurons which performs lateral inhibition. In other terms, the neuron with greatest excitation from the input has its activation increased directly by inhibitory connections (-ve) and indirectly through the self-excitatory connection (+ve) (see Figure 1).
called Competitive Learning and NN model that uses this learning rule is called Competitive Networks (CN). The winning neuron weights are tuned, with a small amount of rate of learning η, thereby, each input neuron of that winning neuron renounce some portion of its synaptic weight. The weight renounced is then distributed equally among the active input neurons and thus, weight vectors become closer to the input signal. The activation fluctuation 1 or 0 make the weight vectors become aligned with any clusters present in the input pattern and that each cluster is represented by at least one node [6].
3. SELF-ORGANIZING MODELS
These models are an unsupervised, NN model used for clustering, data analysis and in many other applications. CN cluster, encode and classify an input data set into the same category or vector that share similar properties. These CN consists of a single layer of input neurons that present the attribute features and an output layer (Competitive Layer (CL)) of neurons that incorporates Competitive Learning Rule (CLR) to select the winning neuron in that instance. There is therefore a competition for activation across the layer and the network is said to evolve through competition with learning and adaptation during that period. Each time winning neuron’s synaptic weight is tuned using a parameter η without any external guidance. CN has the ability to learn and self-train similar to biological neural system, unlike other NN models, and so, the name Self-Organizing Models.
Self-training occur with the synaptic weight vector of the winning neuron moving closer to the input pattern by updating them evenly with the responsible input neurons. Over a period of time the weight vector, become very close to input vector and doing so, it learns about the properties of the input patterns and realizes its clustering nature. After this training, the weight vector of each neuron encodes the information of group of similar pattern. Now, when a new pattern is presented to the NN, a neuron or group of neurons, respond maximally to the input and the process is repeated [7].
Thus, the key properties of Self-Organizing NN models are, competition among output neurons, cooperation among the neighborhood neurons and self-organizing the weight vector according to distance measure. These properties are very much desirable in solving complex problems and used in NN models such as Self-Organizing Map (SOM), Hierarchical SOM (HSOM), Adaptive Resonance Theory (ART).
The scope of this paper is to study clusters and its formation in Self-Organizing NN models in education industry as a sample study, since they by nature are clustering models and can perform clustering through a competitive learning rule [8]. The following sections present the formation of clusters in KSOM, HSOM and ART-1 and discusses its efficiency.
3.1 SOM
The SOM or Kohonen SOM (KSOM) developed by Professor Teuvo Kohonen, imitates the cognitive behavior of human brain. The objective of KSOM is to transform an incoming signal pattern into 1D or 2D array/map and to perform this task in an ordered manner. KSOM consists of two layers of neurons, one input layer that stimulate the activation on the neuron in the another layer called CL. The output neurons are arranged in a 1D or 2D. Given an input pattern, the SOM algorithm clusters
arg min ║ x- w║ between the weight vector of that neuron and the input vector.
Weights of maximum activation neuron are updated to move the neuron more closer to the input vector by a time decreasing learning rate η and time decreasing neighborhood function h; wnew = wold + η h(x)(x – wold)
This is continued until no noticeable changes in the feature map are observed.
After the successful completion of training, each neuron stores the information in cluster of similar input patterns. When a new pattern is submitted to the network, the encoded information that acts as memory of the KSOM, identifies the feature of the pattern by similarity measures and cluster them correctly in the group [9,10].
3.2 HSOM
Popularity of SOM has brought out many variations in the SOM structure and organization such as Hierarchical SOM, GHSOM, multi-layer SOM, multi-stage SOM etc. Some of the many reasons of these variations are,
i) SOM are static models in the sense that, the number of neurons and the layer are fixed in advanced,
ii) They lack hierarchical relationship between the layers and not be much use in solving problems that are hierarchical by nature and,
iii) As the dimensionality of space matrix increases, computational complexity increases [11].
All these models bring out difference in the way they interact between the layers and map the input data patterns into clusters. Hierarchical SOM is variation of SOM and has become one of the powerful tool for clustering in both static and dynamic ways. HSOM can be classified into Hierarchical / Agglomerative or Partition / Divisive methods in the way they receive the input data pattern. Hierarchical HSOM have many SOM layers that receive part or full features of input patterns at the first layer and at each higher layer provides cluster of neuron with more detailed information from the data set. Whereas, the Partition HSOM, have one SOM that receives all the features of input pattern, and at the subsequent layers, with many SOM, each in turn have clusters of neurons that specify the abstracted data.
Though these models are structurally varied, the cluster algorithm is the standard SOM with some additional parameter to prevent too much growth of these models. The training of all these are similar to the SOM. Once the first layer becomes stable, the training proceeds to the next layer with reduced number of input pattern and so on, till the HSOM learns to cluster or some criterion is found [12].
3.3 ART-1
according to the representation of input pattern, methodology of learning; such as ART-1 that processes binary input, ART-2 accepts both binary and continuous inputs and ARTMAP learns through supervision and so on [13].
ART models have two subsystems, one the attentional subsystem and orientational subsystem and two control units gain controls and reset. This gain controls and reset facilitate to retain the learned patterns, even while new patterns are being learned. During the operation of the network, patterns emerge in the attentional subsystem and are called traces of Short Term Memory (STM) and traces of Long Term Memory (LTM) are in the connection weights between the input layer (Comparison Layer-COML) and the output layer (Recognition Layer-RL). The patterns that are presented by the comparison layer are conveyed to the RL, and RL tries to identify the pattern with the available clusters in that layer. RL implements, CLR and thus neurons in the layer try to win the competition by sending out its patterns. The neuron that transmits the pattern, which is closer to the input pattern, is the Best Matching Unit (BMU). Now, degrees of the match that exist between the layers either encourage a new pattern cluster in the RL or assign the pattern into that BMU-cluster. ART employs 2/3 rule for self-stabilization and to input the next pattern across the layers as below:
Initialize the bottom-up weights of each neuron as B < (L / (L-1 + (number of input units))); top-down weights to 1.
The activation level of input units are determined by the input pattern B * X and activation level of an output unit is calculated by competitive learning rule.
For each the winning neuron, the degree of match, (T.X) / X > σ where 0 ≤ σ ≥ 1 is found and adaptation take place over a time period: T(t+1) = T(t).X; B(t+1) = (L.T(t).X) / ((L-1) + T(t) . X))
This is continued until all output neurons represent cluster and a new cluster is allocated.
4. IMPLEMENTATION
Education, in general, plays a key role in the individual advancement and thus increases the countries socio-economic status. Higher levels of education, post graduation MCA/MBA/MS etc., offer higher earning potential for individuals. And thus, higher education has gained increasing importance due to competitive environment, both the students as well as the education institutions are at crossroads to evaluate the performance and ranking respectively [5,8,14]. While trying to retain its high ranking in the education industry, each institution is trying to identify potential students and their skill sets and group them in order to improve their performance and hence improve their own ranking. So, students performance prediction problem is considered for cluster analysis and study how this problem is being addressed by unsupervised models of competitive learning.
Important 10 attributes that are observed as eligibility to pursue Master of Computer Applications (MCA), by a university/institution is taken for input data set. Attributes explains, the students academic scores, priori mathematics knowledge, score of eligibility test conducted by the university
etc. The clusters that are formed, gives the structured knowledge, that are further used by the management and students to analysis their skills and potential and act consequently. Following sub-sections provides the cluster formation and analysis for this problem instance.
KSOM: A 10 X 3 KSOM is designed with initial weight vector with 1/√10 to have a unit length initially. As the competitive layer is 1-dimensional vector of 3 neurons, influence of neighborhood parameter is none. After completion of successful train and validation the performance of clusters are shown in Table 1. The accuracy of the clusters formed are good but few patterns are overlapped due to uncertainty.
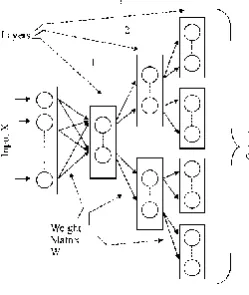
[image:3.595.377.502.402.550.2]HSOM: The model proposed is the static divisive HSOM of 3 layers where the number layers (2) and neurons (2) in each layer is predefined as in (see Fig. 2), apart from input layer. Standard SOM clustering algorithm is used to train the layers. The training of the subsequent layer starts after the previous layer become stable. As the number of layers and neurons are predefined, each cluster unit in the KSOM layer acts as an input layer to the neurons in the higher layer. Here, each map is trained with that part of the input that is mapped from the previous maps. In this way, the amount of training data for a particular SOM is reduced on the way to the next layer. The last layer has eight clusters of information that is mapped from the initial layer through intermediate layer. Main two points to be considered are, incorporation of multi layer reduces the number of clusters in each competitive layer and each neurons undergoes less number of training patterns because of the partition in the previous layer, that reduces the overall time complexity of the system.
Fig 2: HSOM Architecture
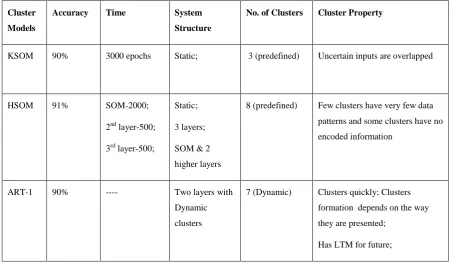
Table 1. Cluster Performance in Self-Organizing Models
Cluster
Models
Accuracy Time System
Structure
No. of Clusters Cluster Property
KSOM 90% 3000 epochs Static; 3 (predefined) Uncertain inputs are overlapped
HSOM 91% SOM-2000;
2nd layer-500;
3rd layer-500;
Static;
3 layers;
SOM & 2
higher layers
8 (predefined) Few clusters have very few data
patterns and some clusters have no
encoded information
ART-1 90% ---- Two layers with
Dynamic
clusters
7 (Dynamic) Clusters quickly; Clusters
formation depends on the way
they are presented;
Has LTM for future;
ART-1: ART-1 is designed with space map 10 X 4 input and output neurons. Dynamic RL is tried, where the size of output neuron increases in case of any new patterns appear; if it is static, it will stop responding to new classes of input patterns if the output neurons are insufficient. The vigilance parameter is set to 0.5 moderates the number of clusters created.
At the end of process, 7 independent clusters are created on validation data. The clusters are formed quickly compared to other models. There are no empty neurons since the initial weight vectors (top-down) are assigned same value that makes every neuron to participate in the competition.
The Table 1 shows the result of the experimental study of clusters for student admission process to the post graduate course MCA, on their initial performance.
Results in the table shows that all the models are in par with each other in accuracy and has a poor cluster organization that can be further improved. To enhance the cluster property and reduce the uncertain patterns, author proposes a hybrid model SART [5]. This is a sequential model having KSOM as the first component for data preprocessing and ART-1 for clustering the data pattern. The objective of SART is to utilize the efficiency of SOM and ART-1 cluster models in this problem. Since ART1 is a simple and fast cluster model but sensitive to input patterns that create many clusters of no importance. Introducing, data preprocessor to ART-1 shall reduce the noise that present in the input pattern that increase the overall performance of the system.
4.1 Hybrid Model: SART
There are two components in SART. The first component KSOM is developed with 10 input neurons and 2 output neurons and trained in the same way as before, but for a minimum duration. Once, the stability of the model occurs, its start clustering the new data pattern into the prescribed clusters. After the initial performance, these clusters are presented to the second component ART-1 model. ART-1 with its STM and LTM identifies each pattern and clusters them appropriately in the recognition layer.
Thus, in SART model, pattern organization is achieved proficiently in least training.
Table 2. Cluster Performance in SART
Cluster
Model
Accuracy Training Time System Structure Clusters formed Cluster Property
SART 92 -95 % Preprocessor:
1500 – 2000
epochs
Static system;
Dynamic clusters
8 Quick response
5. CONCLUSION
This paper presented a systematic approach for performance prediction by clustering process on the performance of students using self-organizing networks. Experiments based on the data set showed that unsupervised learning cluster is able to produce interpretable rules with high performance capabilities. The development of hybrid model (SART) has been investigated in this work, which shows an improvement in the feasibility and accuracy of the system compared to the individual models SOM, HSOM and ART-1. Also, the parameters that influence the cluster formation is analyzed to label them and to know about the students community so that proper guidance will enhance their objective in higher education.
6. REFERENCES
[1] Kanungo, T., David, M.M., Nathan, S.N., Piatko, C.D., Silverman, R. and Wu, A.Y. 2002. An Efficient k-Means Clustering Algorithm: Analysis and Implementation. IEEE Trans. on Pattern Analysis and Machine Intelligence, 24(7), 881-892.
[2] Jain, A.K., Murty, M.N., and Flynn, P.J. 1999. Data Clustering: A Review, ACM Computing Surveys, 31(3), 264-323.
[3] Basilio, B.P., Calyampudi, R.R., Rubens, L.O., and Nascimento. E.M. 2010. Combining Unsupervised and Supervised Neural Networks in Cluster Analysis of Gamma-Ray Burst. J. Data Science, 8, 327-338.
[4] Pelliccioni, A., Cotroneo, R., and Pungì, F. 2010. Optimization Of Neural Net Training Using Patterns Selected By Cluster Analysis: A Case-Study Of Ozone Prediction Level. In the Conf. Artificial Intelligence and its Applications to the Environmental Sciences, Georgia
[5] Sathya, R., and Abraham, A. 2011. Dual Competitive Architecture for Data Analysis. In. the Proc. of International Conference on Frontiers in Computer Science.
[6] Haykin, S. 2005. Neural Networks- A Comprehensive Foundation, 2nd ed., Pearson Prentice Hall.
[7] Herbst, M., Gupta, H.V., and Casper, M.C. 2009. Mapping Model Behaviour Using Self-Organizing Maps, Hydrol. Earth Syst. Sci., 13, 395–409.
[8] Sathya, R., and Abraham, A. 2012. Unsupervised Control Paradigm for Performance Evaluation, Int. J. Computer Applications, 24(40), 27-31.
[9] Kohonen, T. Self-Organizing Maps, Springer Series in Information Sciences, 30, Springer, 1995, 1997, 2001, 3rd Ed.
[10] Sathya, R., and Abhraham, A. 2010. Application of Kohonan SOM in Prediction. In the Proceeding of ICT conference. CCIS 101. Springer-Verlag Berlin Heidelberg, 313–318.
[11] Roberto, H., Victor, L., and Fernando, B. 2012. Spatial Clustering Using Hierarchical SOM, Chapter 12: Applications of Self-Organizing Maps, 231-250.
[12] Zheng, C., Ahmad, K., Long, A., Volkov, Y., Davies, A., and Kelleher, D. 2007. Hierarchical SOMs: Segmentation of Cell-Migration Images, Part II, LNCS 4492, 938–946.
[13] Carpenter, G.A., and Grossberg, S. 2002. Adaptive Resonance Theory, the Handbook of Brain Theory and Neural Networks, Second Edition, MIT Press.