Efficient Clustering Approach using Statistical Method
of Expectation-Maximization
P.Srinivasa Rao
MVGRCE VizianagaramK.Sivarama Krishna
T.R.R.Engg.College HyderabadNagesh Vadaparthi
MVGRCE VizianagaramS.Vani Kumari
GMRIT RajamABSTRACT
Clustering is the activity of grouping objects in a dataset based on certain similarity.Available reports on clustering present several algorithms for obtaining effective clusters.Among the existing clustering techniques, hierarchical clustering is one of the widely preferred algorithms.Though there are many algorithms existing,K-Means for hierarchical clustering stand top.But still it is observed that the K-Means algorithm has number of limitations like initialization of parameters. To overcome this limitation, we propose the utilization of E-M algorithm. The K-Means algorithm is implemented by using measure of Cosine similarity and Expectation-Maximization(E-M) with Gaussian Mixture Model.The proposed method has two steps.In first step, the K-Means and E-M methods are combined to partition the input dataset into several smaller sub clusters.In the second step, sub clusters are merged continuously based on maximized Gaussian measure.
Key Terms
K-Means, Expectation-Maximization, Gaussian Mixture Model, clustering, similarity measure
.
1
.
INTRODUCTION
It is very common to differentiate an object with another object by some similarity or dissimilarity. The similar things are grouped together to form clusters. Forming these clusters automatically for a large dataset requires a clustering algorithm [6]. Though there are numerous novel algorithms emerged with additional features and capabilities to form clusters, K-Means [3] with its ever acceptable features of simplicity, understandability, and scalability stood forward among all other algorithms.
With the clustering algorithm it is equally important to know the similarity measure used to find the similarity between objects. Many analysts strongly recommend highly performing similarity measure like Cosine Similarity [2]. Though there are even more similarity measures performing more or less equally to cosine similarity[9] here clustering is illustrated by performing similarity check using cosine rule. In this paper, we propose an iterative method ofclusteringcalled Expectation-Maximization (E-M), [4], which is defined in two steps. Expectation step calculates the similarity values between two objects. Maximization step which maximizes the similarity values in finding finite clusters.
Our analysis is highly focused on parameterless K-Means with E-M which is briefly given in section 2. The process of
clusteringand relative theory is explained in section 3. Section 4 is conclusion and 5 is future work.
2.PARAMETERLESS K-MEANS with
E-M
2.1. Initial K-Means
The previous approach of K-Means is finding the k clusters of n observations of which each observation belongs to the cluster with the nearest mean.
Given a set of n observations (x1, x2, …, xn), where each observation is a d-dimensional real vector, k-means clustering aims to partition the n observations into k sets (k ≤ n) S = {S1, S2, …, Sk} so as to minimize the within-cluster sum of squares (WCSS):
arg min
𝑆 𝑥𝑗− 𝜇𝑖
2 𝑥𝑗∈𝑆𝑗
𝑘
𝑖=1 (1)
Whereμi is the mean of points in Si.
The algorithm is composed of the following steps:
1. Place K points into the space represented by the objects that are being clustered. These points represent initial group centroids.
2. Assign each object to the group that has the closest centroid.
3. When all objects have been assigned, recalculate the positions of the K centroids.
Repeat Steps 2 and 3 until the centroids no longer move. This produces a separation of the objects into groups from which the metric to be minimized can be calculated
2.2. Expectation- Maximization
E-M involves calculating two steps. Here expectation aims at finding values of similarity between two objects. The next step maximizes the likelihood of the existing similarities.
This model, consisting of a set of observed data, a set of unobserved latent data , and a vector of unknown parameters , along with a similarity function
𝐿 𝜃; 𝑋, 𝑍 = 𝑝 𝑋, 𝑍 𝜃 (2)
𝐿 𝜃; 𝑋 = 𝑝 𝑋 𝜃 = 𝑝 𝑋, 𝑍 𝜃 𝑧 (3)
However, this quantity is often intractable.
The EM algorithm seeks to find the MLE of the marginal likelihood by iteratively applying the following two steps:
Expectation step (E step): Calculate the expected value of the similarity function, with respect to the conditional
distribution of given under the current estimate of the
parameters :
𝑄(𝜃|𝜃 𝑡 = 𝐸
𝑍|𝑋,𝜃 𝑡 log 𝐿(𝜃; 𝑋, 𝑍) (4)
Maximization step (M step): Find the parameter that maximizes this quantity:
𝜃(𝑡+1)= arg min
𝜃 𝑄(𝜃|𝜃(𝑡)) (5)
The EM algorithm works as follows
1. Set i to 0 and choose theta_iarbitrarily.
2. Compute Q(theta | theta_i)
3. Choose theta_i+1 to maximize Q(theta | theta_i)
4. If theta_i != theta_i+1, then set i to i+1 and return to Step 2.
where Step 2 is often referred to as the expectation step and Step 3 is called the maximization step.
The generalized EM (GEM) algorithm is the same except that instead of requiring maximization in Step 3 it only requires that the estimate be improved.
2.3 E-M with GaussianMixture Model
Initial parameters:
𝜆0= {𝜇1 0 , 𝜇2 0 , … , 𝜇 0 𝑘 , 𝑝1 0 , 𝑝2 0 , . . , 𝑝𝑘 0 }
E-step:
𝑃 𝜔𝑗 𝑋𝑘, 𝜆𝑡 =
𝑃 𝑋𝑘 𝜔𝑗,𝜆𝑡 𝑃 𝜔𝑗 𝜆𝑡
𝑃 𝑋𝑘 𝜆𝑡 =
𝑃(𝑋𝑘|𝜔𝑖,𝜇𝑖 𝑡 ,𝜎2)𝑝𝑖(𝑡)
𝑃(𝑋𝑘 𝑘|𝜔𝑖,𝜇𝑖 𝑡 ,𝜎2)𝑝𝑗(𝑡)
(6)
M-step:
𝜇𝑖(𝑡+1)= 𝑃 𝜔𝑘 𝑖 𝑥𝑘,𝜆𝑡 𝑥𝑘
𝑃 𝜔𝑘 𝑖 𝑥𝑘,𝜆𝑡 (7)
𝑝𝑖(𝑡+1)= 𝑃 𝜔𝑘 𝑖 𝑥𝑘,𝜆𝑡
𝑅 (8)
where R is the number of records,[11].
2.4. Proposed method
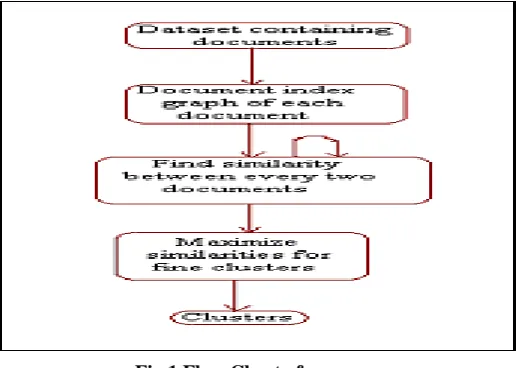
In this paper we proposed a method to construct the clusters by k-means with cosine similarity without initially declaring the number of clusters. Also an attempt is made to prove the finiteness of emerging clusters by maximizing the similarities using concept of E-M.
3. EXPERIMENTAL EVALUATION
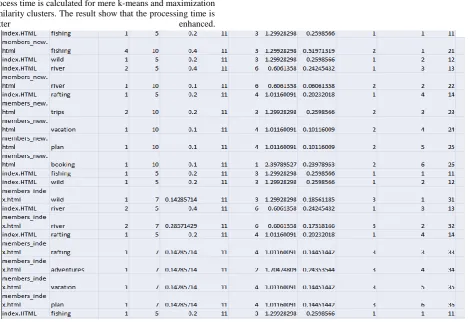
The experimentation is carried out on the dataset of few web documents. They are parsed and preprocessed to give cumulative index graph. The node structure of every document is represented. Then initial similarities of all the documents with every other related document in the dataset are calculated. Now the similarities are maximized by statistical method and maximized values are represented. Clusters are formed based on the maximized similarities. In the entire process of forming clusters the initial number of clusters is nowhere spoken. Process time for finding similarities and forming clusters after maximizing are compared.
[image:2.595.171.431.557.741.2]Fig 2 Finding Similarities of every two documents
Here the documents are parsed and preprocessed to form a node structure and using the document index graph the phrases and words are separated. On the whole, the meta data
[image:3.595.84.517.75.337.2]is obtained and similarities are found between every two documents.
Fig 3 Cluster Formation
Fig 4: Performance Calculation
Process time is calculated for mere k-means and maximization similarity clusters. The result show that the processing time is
Here, GMM applied in MATLAB the text’s are not taken by it, since we given Document id, Document term id (i.e., if Document id is first document consists of first term or
[image:5.595.71.529.89.687.2]2nd,3rd,.. in corresponding document term can be represented).So, based upon these values given as an input.
[image:5.595.87.510.104.378.2]Fig 6: Output of Cluster1 in Gaussian Mixture Model
Fig 8: Output of Cluster3 in Gaussian Mixture Model
Table 1: Comparison Table
Technique Number of Clusters formed(10 documents)
E-M with K-Means 04
E-M with GMM 03
[image:6.595.55.485.425.659.2]4.
CONCLUSION
We from the report, concluding that this attempt of forming clusters without giving the parameter beforehand is successful to most of extent. The process time for forming clusters has shown its result.Here, the formation of clusters is can be varied. Initially, when we used K-means with EM found total number of clusters are four and after applied GMM with EM observed finally, three clusters (there two are specifying very similar so, they are merged into one cluster).So, that after refinement we got an finite clusters. Now, for the future enhancement of the results the Gaussian mixture model of expectation-maximization can be used. In the process frequency of each term in every document with its inverse document frequency is taken. This tabular output is converted to CSV file and the resultant is the outcome of Gaussian mixture model.
5.
FUTURE WORK
The key contribution of this paper is the fundamental concept of similarity measure frommultiple viewpoints.Finally, we have shown the application of MVS and its clusteringalgorithms for text data. It would be interesting to explore how they work on other typesof sparse and high-dimensional data.
6.
REFERENCE
[1] SimilarityMeasures for text document clustering by Anna Huang
[2] Evaluating the Performance of Similarity Measures Used in Document Clustering and Information Retrieval,IEEE, ieeexplore.iee.org
[3] M. Goto, T. Ishida, S. Hirasawa: “Statistical Evaluation of Measure and Distance on Document Classification Problems in Text Mining”, IEEE International Conference on Computer and Information Technology, 2007
[4] Expectation–maximization algorithm From Wikipedia, the free encyclopedia.
[5] Robert Hogg, Joseph McKean and Allen Craig. Introductionto Mathematical Statistics. pp. 359–364. Upper Saddle River, NJ: Pearson Prentice Hall, 2005.
[6] David J.C. MacKay,The on-line textbook: Information Theory, Inference, and Learning Algorithm.
[7] ShuhuaRen AlinFanSch. of Inf. Sci. & Eng., Dalian Polytech. Univ., Dalian, China: K-means clustering algorithm based on coefficient of variation.
[8] Momin, B.F.; Kulkarni, P.J.; Chau-dhari, A,;Web Document Clustering Using Document Index Graph. [9] Mikawa, K.; Ishida, T.; Goto, M.; Dept. of Creative
Sci. & Eng., Waseda Univ., Tokyo, Japan.; A proposal of extended cosine measure for distance metric learning in text classification.
[10]ELdesoky, A.E. Saleh, M. Sakr, N.A. Dept. of Comput. & Syst., Mansoura Univ., Mansoura; Novel similarity measure for document clustering based on topic phrases. [11]H.Chin, X. Deng,"Efficient phrase-based document