2016 Joint International Conference on Artificial Intelligence and Computer Engineering (AICE 2016) and International Conference on Network and Communication Security (NCS 2016)
ISBN: 978-1-60595-362-5
Research on Fuzzy C-Means Algorithm Based
on the Information Entropy
Jie LIU
Shaanxi Sci-Tech University, School of Mathematics and Computer Science, Hanzhong, Shaanxi, China
Keywords: Improved Fuzzy C-Means Algorithm, Information Entropy, Entropy Evaluation Method, Fuzzy Partition Coefficient, Average Fuzzy Entropy.
Abstract. Aiming at the shortcomings of the Fuzzy C-Means (FCM) algorithm, a new improved FCM algorithm based on the information entropy has been proposed in this paper. Meanwhile, the entropy evaluation method is used to measure the varying degree of influence of the various attributes in cluster analysis. In the simulation experiments, two indexes called the fuzzy division
coefficient FC(μ)and the average fuzzy entropy HC(μ) are used to evaluate the performance of the
new FCM algorithm. The experimental results show that the FC(μ) and the HC(μ) are0.864 and
-0.012 respectively which show that the improved FCM algorithm can obtain better classification effect than the FCM algorithm in practical application.
Introduction
The clustering is the classification process to distinguish objects according to the certain requirements and rules. Clustering analysis is one of the multivariate statistical analysis. The samples with no tags are divided into several subsets according to the standard making the similar samples into the same class and the different samples into the different class as much as possible. It belongs to unsupervised classification method and it has been widely used to pattern recognition, data mining and image processing and so on.
The traditional clustering analysis is one of the hard division and each sample will be strictly belong to one class with well-defined boundaries. In fact, the attributes of the many objects are neutral. Because of the lack of rationality three is some dispute of hard division [1-2]. So the soft division is usually adopted. The fuzzy set theory proposed by Zadeh provides an important theoretical basis for. In the soft division, it describes the neutrality of the sample through measuring the degree of the uncertainty of the samples and it’s more objectively to reflect the real world. Among various kinds of Fuzzy clustering algorithm, the FCM (Fuzzy c-means, Fuzzy C - Means) clustering algorithm proposed by Bezdek in 1973 is most classic and most widely used in unsupervised pattern recognition [3].In this algorithm, membership degree is used to describe the degree of each sample belonging to a certain clustering. Meanwhile, the optimal solution can be got by minimizing the objective function to realize the spatial clustering. But there are some shortcomings of the traditional FCM algorithm. Algorithm assumptions that each attribute of samples has same contribution to the classification ignoring the varying degree of influence of the various attributes in cluster analysis [4-5]. Aiming at this shortcoming, an improved FCM algorithm has been proposed. In this paper, information entropy is used to measure the influence of various attributes of samples on classification. In order to verify the validity of the improved algorithm, simulation experiments were carried out and the experimental data were recorded through an example.
The FCM Algorithm
1 2
( , ,..., C)
V ,2 C nmeans the clustering center, then the membership matrix describing the n
samples belong to C categories is expressed as:
11 12 1
1 2
n
ij
c c cn
. (1)
Theijis the membership degree of the jth sample belonging to the ith category. It satisfies the
following conditions:
0ij1, 1 i c,1 j n (2)
1 1 c ij i
, 1 j n (3)1
0 n ij
j
n
, 1 i c. (4)The basic idea of traditional FCM algorithm is make the distance between the samples which belong to the same category is least and make the distance between the samples which belong to the different category is big as much as possible. The steps of the algorithm are as follows:
Step 1: users determine the clustering number C;
Step 2: select C samples randomly, each sample is called a seed and it is behalf of the average or center of a category;
Step 3: make the rest samples belong to the category which is nearest;
Step 4: Recalculate the average of the samples in each category to form a new cluster center; Step 5: judge that the new cluster center and the last cluster center is the same whether or not, if it’s same, then the algorithm stop, otherwise, return to the step 3.
The algorithm is expressed as the minimizing objective function:
2
1 1
min ( , , ) c n m( )
ij j i i j
J X V x
. (5)The i is the cluster center of each category and
2
(xji) means the euclidean distance
between the jth sample and the ith cluster center. The m is the weighted index and it’s best value range is [1.5, 2.5].
According to the Lagrange algorithm and the formula (4), the iterative formulas of the cluster
centeriand the membership degreeijcan be gained as following:
1 1 n m ij j j n m ij j x i
, i1, 2,...,C (6)
2 1/( 1) 2 1/( 1) 1 (1/ ) (1/ ) m j i c m j i i x ij x
The Improved FCM Algorithm
Because of the defects of the FCM algorithm with ignoring the varying degree of influence of the various attributes in cluster analysis, a new FCM algorithm based on the information entropy weights of attributes has been proposed.
The Information Entropy
The entropy which is the concept of the physics is put forward by a German physicist named Clausius in 1850 and it is used to represent uniformity of energy distribution in the space. The concept of entropy was introduced in information theory in a paper written by C.E. Shannon and published in 1948 [6]. “A mathematical theory of communication” and it’s known as the information entropy. The entropy directly reflects the uniformity of the system. The entropy is smaller showing that the difference of individuals is more obvious. On the other hand, the entropy is bigger showing that the difference of individuals is not significant.
For an uncertain system, the random variable T is use to described the attribute of the sample ,
1 2
{ , , , }z
T t t t (z≥2), The corresponding probability of each value can be described
1 2
{ , , , }z
P p p p (0≤pi≤1,i1, 2, , z),and
1
1 z
i i
p
,then the entropy of the system is:1
ln
z
i i
i
e p p
. (8)The Entropy Evaluation Method
According to the theory of information entropy, information entropy is the measurement of uncertainty of information [7]. If the entropy value is smaller which shows that the attribute's role is greater, then the weight of this attribute should be bigger naturally. It means that the entropy evaluation method can be used to determine the weight of each attribute. In the same way, for the sth attribute of given set of samples, if the information entropy of this attribute is bigger which shows that the difference of this attribute between samples is not significant, then the role of this attribute is smaller in the sample clustering. On the other hand, if the information entropy of the attribute is smaller, then the role of the attribute is greater in the sample clustering. According to the principle that the entropy value of the attribute and it’s attribution is opposite, the deviation coefficient of the sth attribute can be described:
1
s s
g e . (9)
Then if the gs is bigger, the sth attribute is more important. Assuming that there are z attributes of
sample set, the deviation coefficient gs can be used to determine the weight of each attribute as
following formula:
1 s z
s s
g s
g
w
, s=1,2,…,z (10)1
1 z
s s
w
. (11)The FCM Algorithm Based on the Information Entropy
determined according to the entropy evaluation method can be expressed as W ( ,w w1 2,...,wz)and then the traditional FCM algorithm was improved as following formula:
2
1 1 1
min ( , , ) [ *( )]
c n z
m
ij s js i
i j s
J X V w x
(12)Meanwhile, the iterative formulas of the cluster center iand the membership degreeijbased on
this improved algorithm can be gained as following:
1 1
1 z n
m ij js s j
n m ij j
x
i
, i1, 2,...,C (13)
2 1/( 1) 1
2 1/( 1) 1 1
( [ *( )] )
( [ *( )] )
z
m s js i s
c z
m s js i i s
w x
ij
w x
, j1, 2,...,n (14)
The Simulation Experiment
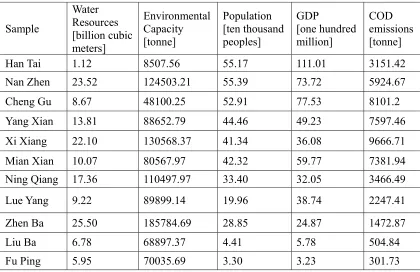
Taking the allocation of water pollutant COD in Hanzhong city which is the water source of the Han River as an example, the 11 areas in Hanzhong will be clustering according to the reduction degree of the water pollutant using the improved FCM algorithm.
[image:4.612.96.516.460.732.2]The 11 areas are selected as the sample set. The COD emissions of each area and the four attributes named regional water resources, regional water environmental capacity, regional population, regional GDP are chosen as of the sample set. All data come from the statistical yearbook of Hanzhong in 2010 and the sample set and attributes data are shown in following table 1:
Table 1. The sample set and attributes data.
Sample
Water Resources [billion cubic meters]
Environmental Capacity [tonne]
Population [ten thousand peoples]
GDP
[one hundred million]
COD emissions [tonne]
Han Tai 1.12 8507.56 55.17 111.01 3151.42
Nan Zhen 23.52 124503.21 55.39 73.72 5924.67
Cheng Gu 8.67 48100.25 52.91 77.53 8101.2
Yang Xian 13.81 88652.79 44.46 49.23 7597.46
Xi Xiang 22.10 130568.37 41.34 36.08 9666.71
Mian Xian 10.07 80567.97 42.32 59.77 7381.94
Ning Qiang 17.36 110497.97 33.40 32.05 3466.49
Lue Yang 9.22 89899.14 19.96 38.74 2247.41
Zhen Ba 25.50 185784.69 28.85 24.87 1472.87
Liu Ba 6.78 68897.37 4.41 5.78 504.84
Data Normalization Process
In order to eliminate the influence of different dimension for the results, the original data should be done normalization process through the formula (14) at first:
' js s
s s
x MINx js MAXx MINx
x
, j1, 2,..., ,n s1, 2,...,z (15)In this formula the xjsmeans the sth attribute value of the jth sample, theMINxsandMAXxsmean the
maximum and the minimum of the sample.
Calculate the Weight of Each Attribute
[image:5.612.143.466.289.359.2]According to the entropy evaluation method, the weights of the four attributes in the sample set are showed in the following table 2:
Table 2. The weights of the four attributes.
Attribute Water resources Environmental capacity Population GDP
weight 0.42 0.41 0.07 0.10
The Clustering Results of Two Algorithms
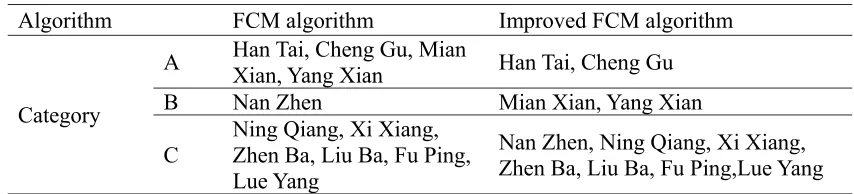
The above experimental data was adopted in clustering through two algorithms. In the two algorithms, the number of categories named C is 3 and they were the key cut class A, strengthen cut class B and ordinary cut class C respectively. the sample size named n is 11, the weighted index named m is 2, the formulas (5), (6) and (7) were adopted in FCM algorithm and the formulas (12), (13) and (14) were adopted in improved FCM algorithm. The clustering results of two algorithms with using Matlab software were gained as the following table 3:
Table 3. The clustering results of two algorithms.
Algorithm FCM algorithm Improved FCM algorithm
Category
A Han Tai, Cheng Gu, Mian Xian, Yang Xian Han Tai, Cheng Gu
B Nan Zhen Mian Xian, Yang Xian
C
Ning Qiang, Xi Xiang, Zhen Ba, Liu Ba, Fu Ping, Lue Yang
Nan Zhen, Ning Qiang, Xi Xiang, Zhen Ba, Liu Ba, Fu Ping,Lue Yang
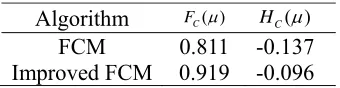
The Performance Evaluation of the Improved FCM Algorithm
In order to judge the performance of the improved FCM algorithm, two main performance
indexes of the cluster analysis algorithm named the fuzzy division coefficient FC(μ)and the
average fuzzy entropy HC(μ) are introduced as following formulas:
2 1
1 1
( ) n c
C n ij
j i
F
(16)1
1 1
( ) n c ln( )
C n ij ij
j i
H
[image:5.612.91.518.502.599.2]The values of the two indexes are calculated and the results are showed as following table 4: Table 4. The values of the two performance indexes.
Algorithm FC( ) HC( )
FCM 0.811 -0.137
Improved FCM 0.919 -0.096
Conclusion and Discussion
The improved FCM algorithm overcomes the neglection of classification attributes to the classification results with considering the weight of each attribute. The information entropy is used to reflect and measure the importance of the attributes in classification and the weight is determined by the entropy evaluation method. Meanwhile, cluster centers and membership matrix in the iteration process are corrected accordingly. The simulation results have proved that the improved algorithm has better performance and can reflect the objective reality more realistic. In this algorithm, the value of the weighted index named m will directly affect the classification result and the value of this parameter is worth to discuss further.
Acknowledgements
This paper is supported by the project numbered 81160183, and thanks for the support of the the national natural science fund.
References
[1] Kong Yue-ping, Zeng Ping. A robust method for inverse half-toningvia 2-D nonlinear pyramid [J]. Chinese Optics Letters, 2007, 5(11): 573-576.
[2] Xiao Chun-jing, Zhang Min. Research on Fuzzy Clustering Based on Subtractive Clustering and Fuzzy c-means [J]. Computer Engineering. 2005, 7(32): 135-137.
[3] Sun Hui-qin, Xiong Zhang. Fuzzy Cluster Based on Rough Set and Result Evaluating [J]. Journal of Fudan University ( Natural Science), 2004, 43(5): 819: 822.
[4] Bezdek J.C. A Physical Interpretation of Fuzzy ISODATA [J]. IEEET Rans SMC, 1976, 6 (3): 387-390.
[5] Huang Ding-xuan. Means of Weights Allocation with Multi-Factors Based on Impersonal Message Entropy [J], Systems Engineering Theory Methoddology Applications. 2003, 12(4): 321-324.
[6] Zhang Yan, Yang Zhi-feng. Analyses on evolution of urban complex ecosystem based on information entropy [J]. Acta Scientiae Circumstantiae, 2005, 25(8): 1127-1134.