in Software Product Lines
R. BASHROUSH, University of East London M. GARBA, University of East London
R. RABISER, CDL MEVSS – Johannes Kepler University Linz I. GROHER, Johannes Kepler University Linz
G. BOTTERWECK, Lero – University of Limerick
Software product lines (SPL) aim at reducing time-to-market and increasing software quality through extensive, planned reuse of artifacts. An essential activity in SPL is variability management, i.e., defining and managing commonality and variability among member products. Due to the large scale and complexity of today’s software-intensive systems, variability management has become increasingly complex to conduct. Accordingly, tool support for variability management has been gathering increasing momentum over the last few years and can be considered a key success factor for developing and maintaining SPLs. While several studies have already been conducted on variability management, none of these analyzed the available tool support in detail. In this work, we report on a survey in which we analyzed 37 existing variability management tools identified using a systematic literature review to understand the tools’ characteristics, maturity, and the challenges in the field. We conclude that while most studies on variability management tools provide a good motivation and description of the research context and challenges, they often lack empirical data to support their claims and findings. It was also found that quality attributes important for the practical use of tools such as usability, integration, scalability, and performance were out of scope for most studies.
CCS Concepts: • General and reference → Surveys and overviews • Software and its engineering → Software product lines • Software and its engineering → Software notations and tools • Software and its engineering → Software configuration management and version control systems
General Terms: Software Product Lines, Variability Management, Tools, Systematic Literature Review
Additional Key Words and Phrases: Software Engineering, Computer-aided software engineering, Software Variability ACM Reference format:
Rabih Bashroush, Muhammad Garba, Rick Rabiser, Iris Groher, and Goetz Botterweck. CASE Tool Support for Variability Management in Software Product Lines. ACM Computing Surveys XXX.
DOI: XXX
1 INTRODUCTION
Over the last two decades, Software Product Line (SPL) engineering has increasingly gained the attention of researchers and practitioners alike. This is due to the potential economic advantages and business competitiveness the SPL engineering process can bring [Clements and Northrop 2007]. The benefits can range from cutting the development cost and increasing software quality to enabling mass customization, market dominance, and reduced time to market [Clements and Northrop 2007][Pohl et al. 2005a].
SPL engineering is about the planned reuse of common assets among a set of related systems, usually referred to as the product line or product family [Clements and Northrop 2007]. The SPL engineering process [Pohl et al. 2005a] involves studying and managing the common and varied features of the different product line members, a process usually referred to as domain engineering or development for reuse. Core (shared) assets – e.g., requirements, architecture, code, test cases – are then used as a basis to derive products from the product line, a process usually referred to as application engineering or development with reuse.
XX:2 • R. Bashroush et al.
Defining and managing commonalities and variability in software product lines is widely referred to as variability management and is a key step of the SPL engineering process [van Gurp et al. 2001]. The variability management process guides the construction of product line variability models. Different types of variability models have been proposed, e.g., feature models, decision models, Orthogonal Variability Models (OVM), and UML-based approaches. In Section 1.1 we provide an overview of existing modeling approaches. For a detailed comparison and classification of variability modeling approaches we refer to [Czarnecki et al. 2012] and [Sinnema and Deelstra 2007]. Variability models define the commonalities and variability of the product line from a problem space (e.g., features, decisions, or variation points) and a solution space (e.g., the reusable assets or variants) perspective along with the relationships that exist between these two spaces and among the elements in these spaces. Example relationships include exclusivity (when two features cannot exist in one product at the same time); inclusivity (when the existence of one feature depends on another); and alternatives (when only one of a number of alternative features can be supported), to name a few. Variability models tend to be very large in size, in many cases comprising thousands of features, and complex in nature due to the myriad of relationships that could exist among the features. This makes the construction of variability models manually a very tedious and error-prone process. Hence, tool support is of paramount importance for the variability management process. Indeed, as widely acknowledged, not the least under the so-called triangle of success [Quatrani 2002], the success of software engineering projects depends on good tool support as much as on good software engineering processes. While existing work has investigated the variability management process in great detail – see, e.g., [Chen and Babar 2011], for a systematic literature review of variability management approaches – tool support has not yet been studied in detail. In particular, existing work has not set out to identify and analyze all existing variability management tools. For the SPLE process, and particularly for variability management, a large number of tools have been developed over the last two decades. However, the majority of these tools had limited success with industrial adoption and never progressed beyond basic proof-of-concept stages. While dozens of experience reports on adopting the SPLE process in practice exist, very few focus specifically on variability management and even fewer on the tools supporting variability management [Berger et al. 2013].
In this work, we thus aimed to study all the published literature on CASE tool support for variability management over the last two decades using the systematic literature review methodology [Kitchenham et al. 2007]. The objective was to understand what tools have been produced, the characteristics of these tools, their context, and the challenges and limitations they faced. Particularly, given most of the academic tools never made it to industry, the aim was to document lessons learned and avoid duplicate efforts in the future. This paper presents the results of the study which: i) will give practitioners access to a catalogue of published tools (commercial tools are discussed under a separate section) and guide them in selecting a tool for a given task enhancing the accessibility of published tools; ii) provide researchers in the field with the main challenges and limitations that require further investigation; and iii) provide new researchers with a good understanding of the state-of-the-art in tool support for variability management in SPL engineering.
The remainder of this section provides background overview of the various SPL modeling approaches. In Section 2, the research methodology is discussed. This includes the study’s research questions, search protocol, inclusion and exclusion criteria, quality criteria, and the data extraction and synthesis process. Section 3 provides overall meta-analyses of the primary studies identifying trends in the field. Based on the data collected, the research questions are then addressed and discussed in detail in Section 4. Section 5 discusses additional findings on commercial tools and tool adoption in industry. Section 6 discusses the study limitations and threats to validity. Section 7 discusses related work. Finally, Section 7 rounds off with a summary and conclusions.
1.1 Background
Variability modeling is essential to define and document the commonalities and variabilities among a set of products in an SPL. Variability models are typically developed during domain engineering together with the reusable assets. During application engineering, products are derived by selecting variants in the variability model and reusing the corresponding assets developed during domain engineering [Pohl et al. 2005a].
Over the past two decades, a number of variability modeling techniques have been developed, each with its own characteristics and concepts [Sinnema and Deelstra 2007]. Feature modeling, decision modeling, and orthogonal variability modeling have gained the most attention [Czarnecki et al. 2012]. In this section, we provide a short overview of the three aforementioned techniques. Many of the CASE tools for variability management presented in this study support one of these three variability modeling techniques.
Feature modeling originates from the work on Feature-Oriented Domain Analysis (FODA) [Kang et al. 1990]. Feature models capture features, which are defined as end-user visible characteristics of systems in the domain [Czarnecki et al. 2012]. Features are hierarchically organized in a feature tree and feature groups represent choices between multiple sub-features [Sinnema and Deelstra 2007]. Constraints and dependencies between features can typically be expressed in dedicated constraint languages. Feature models are used to model both the commonality and the variability of a set of products. Product derivation can be performed by selecting features from the feature model. Features can optionally be mapped to assets, which can be used to assemble products based on a valid feature selection during application engineering.
Decision modeling focuses on decisions that distinguish the products of a product line to guide product derivation. Czarnecki et al. (2012) define decisions as differences among systems, i.e., what needs to be decided on when configuring a system. Unlike feature modeling, which focuses on the documentation of commonality and variability, the main goal of decision modeling is to support product derivation during application engineering. Thus, a central concept in decision models is the mapping of decisions to reusable assets. Similar to feature models, dependencies and constraints between decisions can be defined, e.g., using constraint languages.
Orthogonal Variability Modeling [Pohl et al. 2005a] focuses on the documentation of variability in a separate variability model rather than integrating variability directly into development artifacts. Today, decision models and feature models are also primarily used in an orthogonal way [Czarnecki et al. 2012]. The variability defined in an OVM is related to other artifacts such as feature models, use case models, and component models [Pohl et al. 2005a]. OVM uses variation points and variants to capture the variability among a set of products. Similar to decision models, OVM focuses on documented variabilities. Constraint languages are used to define variability constraints.
XX:4 • R. Bashroush et al.
2 RESEARCH METHOD
[image:4.612.207.403.211.494.2]To achieve the objectives of this study, a Systematic Literature Review (SLR) approach was adopted. An SLR is a rigorous method for examining, evaluating, and interpreting all available research evidence based on research question(s) or particular research topic(s) [Kitchenham et al. 2007]. This study examines current literature on variability management tools in SPL engineering (known as primary studies) published over the last two decades. Throughout this research study, the guidelines for SLRs were followed as provided in [Kitchenham et al. 2007]. This involves three main phases: (1) Planning the review; (2) Conducting the review, and; (3) Reporting the review. Fig. 1 below depicts the stages of SLRs, adapted from [Brereton et al. 2007].
Fig. 1. Systematic Literature Review process [Brereton et al. 2007].
An important element in SLRs is the development of a review protocol (Fig. 2). This protocol specifies the background and procedures to be used by researchers to ensure rigor while conducting the review and reduces the possibility of researchers’ bias throughout the review process.
The systematic review protocol begins by defining research questions to be answered followed by the search strategy to be followed to identify the primary studies (described in Sections 2.1 and 2.2). Then, the study selection criteria for determining which studies should be included or excluded from the surveyed literature is defined (Section 2.3). Quality assessment criteria are then defined. These are used to assess the quality of the primary studies (Section 2.4). Finally, procedures for extracting and synthesizing data reported from primary studies are defined (Section 2.5).
Quality assessment and data extraction and synthesis have been performed by the authors of the paper (four senior researchers, and one postdoc, with many years of experience in the area of variability management (the average
2. Develop review protocol
3. Validate review protocol 1. Specify research questions
4. Identify relevant research
5. Select primary studies
6. Assess study quality
7. Extract required data
8. Synthesize data
9. Write review report Phase 1:
Planning the Review
Phase 2: Conducting
the Review
Phase 3: Reporting the Review
experience is over 10 years)). For each paper, the data were extracted by one of the four reviewers, who read the publication in detail. Another reviewer checked the extracted data. The papers were distributed randomly among the five reviewers, who did not extract or check their own publications.
Fig. 2. SLR review protocol process [Brereton et al. 2007].
2.1 Research Questions
In order to achieve the research aim and objectives of this study, we defined the following five research questions.
RQ1: What tools have been developed to manage variability in software product lines?
RQ2: What are the characteristics of these tools?
RQ3: What is the quality of the research conducted in the reported approaches?
RQ4: What is the context of research?
RQ5: What are the main challenges faced by current Product Line Management (PLM) tools?
2.2 Search Strategy
Following Kitchenham’s guidelines [Kitchenham et al. 2007], we constructed a search string to help us identify the relevant primary studies to answer our 5 research questions.
<<Variability AND (Product Line* OR Software Product Lines OR Software Product Family OR Software Product Families OR Product Family OR Product Families* OR Systems Family OR Family of Systems) AND (Variability OR Variability Management OR Variant OR Variation Point OR Feature Model OR Feature Modeling or Feature Modelling) AND (Tool OR Tools OR Approach, Approaches, Method* OR Methods)>>
Identify research questions (Section 2.1)
Define search strategy (Section 2.2)
Define study selection criteria (Section 2.3)
Define quality assessment (Section 2.4)
XX:6 • R. Bashroush et al.
Although it was not possible to apply only one search string for all the electronic data sources, when varying the string for different sources we ensured that although the syntactic nature of the strings was not the same, they were all comparable semantically.
We also performed manual searches on different sources where SPL researchers were known to publish their findings; this included conferences and workshops. We searched for papers published between 1990 (i.e., when the first Feature-Oriented Domain Analysis (FODA) technical report was published [Kang et al. 1990]) up until July 2015 inclusive (when the search stage of this study was completed). Although only data reported in peer-reviewed published material was used in the analyses, we also attempted to acquire the identified tools. Where the tools were not available for download or use online, the respective authors were contacted.
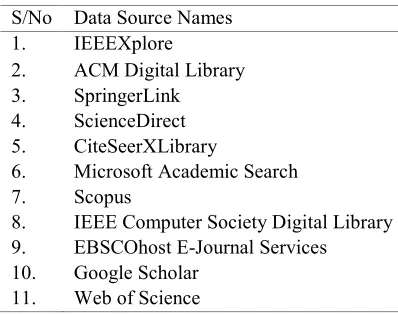
Our search covered 11 digital data sources as shown in Table 1 below. The manual search covered the proceedings of the following conferences and workshops:
- SPLC (Software Product Line Conference)
- VaMoS (Workshop on Variability Modelling of Software-Intensive Systems)
- VisPLE (International Workshop on Visualization in Software Product Line Engineering)
- WICSA (Working International Conference on Software Architecture)
[image:6.612.205.404.335.492.2]- EWSA (European Workshop on Software Architecture)
Table 1. Electronic Databases Used for Searching for Primary Studies
S/No Data Source Names
1. IEEEXplore
2. ACM Digital Library
3. SpringerLink
4. ScienceDirect
5. CiteSeerXLibrary
6. Microsoft Academic Search
7. Scopus
8. IEEE Computer Society Digital Library
9. EBSCOhost E-Journal Services
10. Google Scholar
11. Web of Science
Finally, forward and backward reference checking (“snowballing”) was conducted on the identified primary studies. Search engines were used to find citations of the primary studies identified that could be of relevance to the review (forward reference checking). The reference lists of the primary studies were then checked for any potentially relevant studies missed (backward reference checking).
2.3 Study Selection Criteria
This section explains the study selection process and lists the inclusion and exclusion criteria.
Inclusion Criteria (IC):
• IC1: The primary study is a peer-reviewed, scientific paper rather than a PowerPoint presentation or a short/extended abstract paper.
x ,&7KHSULPDU\VWXG\GLVFXVVHVDYDULDELOLW\PDQDJHPHQWWRROLHDWRROIRUZKLFKGRFXPHQWLQJDQG UHSUHVHQWLQJ YDULDELOLW\ LV D PDLQ DLP DQG WKDW ZDV SXEOLVKHG LQ UHVHDUFK DVVRFLDWHG ZLWK YDULDELOLW\ PDQDJHPHQWHJWKH63/FRPPXQLW\
x ,&:KHQVHYHUDOUHSRUWVRIWKHVDPHVWXG\H[LVWHGLQGLIIHUHQWVRXUFHVWKHPRVWFRPSOHWHDQGUHFHQW YHUVLRQRIWKHVWXG\ZDVLQFOXGHGLQWKHUHYLHZ
x ,&7KHSDSHUZDVZULWWHQLQ(QJOLVK ([FOXVLRQ&ULWHULD(&
x (&7KHSULPDU\VWXG\GRHVQRWDGGUHVVYDULDELOLW\PDQDJHPHQWWRROV x (&7KHSDSHUVZHUHSXEOLVKHGEHIRUH-DQXDU\RUDIWHU-XO\
x (&,WLVDVKRUWSDSHUSDJHVLQWZRFROXPQIRUPDWSDJHVLQRQHFROXPQIRUPDW3RZHU3RLQW ILOHSRVWHUSUHVHQWDWLRQRUFRQVLVWVRIOHFWXUHQRWHV
x (&7KHSULPDU\VWXG\FRQVLVWVRIDFRPSLODWLRQRIZRUNIRULQVWDQFHIURPDFRQIHUHQFHRUZRUNVKRS x (& 7KH SULPDU\ VWXG\ GLVFXVVHV D FRPPHUFLDO WRRO ZH H[FOXGHG FRPPHUFLDO 63/ YDULDELOLW\
PDQDJHPHQWWRROVIURPWKLVVXUYH\ZHGLVFXVVWKHFRPPHUFLDOWRROVVHSDUDWHO\LQ6HFWLRQ
:HIRXQGDWRWDORISDSHUVIURPGLIIHUHQWLQLWLDOVHDUFKHVFRYHULQJGLJLWDOOLEUDULHVPDQXDOVHDUFKHVDQGWKH ZRUNVRINQRZQDXWKRUV$IWHUWKHLQLWLDOVFUHHQLQJRISDSHUDEVWUDFWVLQZKLFKSDSHUVDGGUHVVLQJQRQ63/UHODWHG WRSLFVZHUHH[FOXGHGE\RQHUHVHDUFKHUSXEOLFDWLRQVZHUHVHOHFWHG7KHIXOOSDSHUVZHUHWKHQDFTXLUHGDQG IRXU LQGHSHQGHQW UHVHDUFKHUV UHYLHZHG WKH VWXGLHV SXEOLFDWLRQV ZHUH WKHQ VHOHFWHG WKURXJK YRWLQJ DQG GLVFXVVLRQVDPRQJWKHIRXUUHVHDUFKHUVLQDILUVWVWHS)LQDOO\DQGDIWHUDQRWKHUURXQGFDUHIXOO\FRQVLGHULQJWKH LQFOXVLRQDQGH[FOXVLRQFULWHULDDJDLQWKURXJKYRWLQJDQGGLVFXVVLRQVLQFDVHRIGLVDJUHHPHQWVVWXGLHVZHUH VHOHFWHG)LJEHORZVKRZVDVXPPDU\RIWKHVWXG\VHOHFWLRQSURFHVV
XX:8 • R. Bashroush et al.
2.4 Quality Assessment Criteria
The quality of the reported research in the selected 37 papers was assessed based on the eight quality assessment questions listed in Table 2 below. These were based on the quality assessment strategy defined in [Kitchenham et al. 2007]. The studies were assessed using a ternary scale where each question was given a score of 1 (for Yes), 0.5 (for Perhaps) and 0 (for No). This system allowed us some flexibility when answering some of the questions that were difficult to judge as Yes or No from the information provided in the primary study. Once scores were allocated to questions, an aggregate mark was then given to each study. This data was also used to answer RQ3 (discussed in Section 3.4).
Table 2. Quality Assessment Criteria
Questions
QA.Q1 Is there a rationale for why the study was undertaken?
QA.Q2 Is there a description of the context (e.g., industry, laboratory setting, products used, etc.) in which the research was carried out?
QA.Q3 Did the paper present enough details about the variability management tool to enable us conduct the required analysis?
QA.Q4 Did the paper present an evaluation of the tool? If yes, did it include feedback from end users?
QA.Q5 Are the substantive claims in the paper supported by reliable evidence?
QA.Q6 Do the authors compare and evaluate their own results against related work?
QA.Q7 Do the authors discuss the credibility of their findings?
QA.Q8 Are limitations of the study discussed explicitly?
2.5 Data Extraction and Synthesis
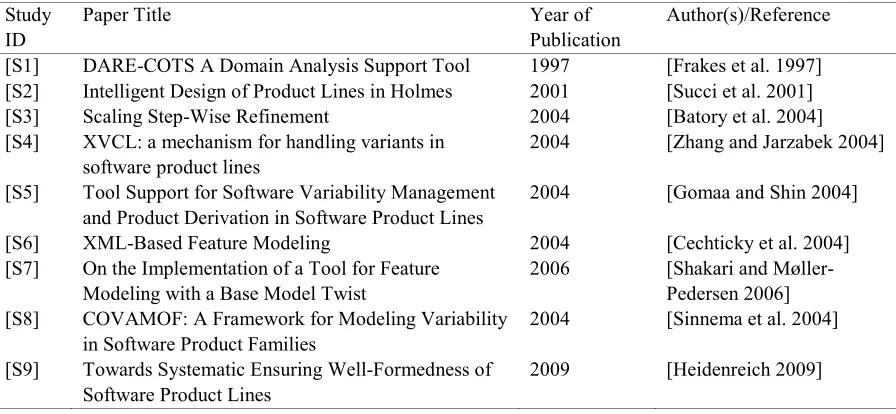
[image:8.612.83.531.455.662.2]Following the selection process, the 37 primary studies identified are shown in Table 3 below.
Table 3. Studies Included in the Final Review
Study
ID Paper Title Year of Publication Author(s)/Reference
[S1] DARE-COTS A Domain Analysis Support Tool 1997 [Frakes et al. 1997]
[S2] Intelligent Design of Product Lines in Holmes 2001 [Succi et al. 2001]
[S3] Scaling Step-Wise Refinement 2004 [Batory et al. 2004]
[S4] XVCL: a mechanism for handling variants in
software product lines 2004 [Zhang and Jarzabek 2004]
[S5] Tool Support for Software Variability Management
and Product Derivation in Software Product Lines 2004 [Gomaa and Shin 2004]
[S6] XML-Based Feature Modeling 2004 [Cechticky et al. 2004]
[S7] On the Implementation of a Tool for Feature
Modeling with a Base Model Twist 2006 [Shakari and Møller-Pedersen 2006]
[S8] COVAMOF: A Framework for Modeling Variability
in Software Product Families 2004 [Sinnema et al. 2004]
[S9] Towards Systematic Ensuring Well-Formedness of
Software Product Lines 2009 [Heidenreich 2009]
[S10] Odyssey: A Reuse Environment based on Domain
Models 1999 [Braga et al. 1999]
[S11] A NUI Based Multiple Perspective Variability
Modeling CASE Tool 2010 [Bashroush 2010]
[S12] The DOPLER meta-tool for decision-oriented
variability modeling: a multiple case study 2011 [Dhungana et al. 2011]
[S13] XToF – A Tool for Tag-based Product Line
Implementation 2010 [Gauthier et al. 2010]
[S14] View Infinity: A Zoomable Interface for
Feature-Oriented Software Development 2011 [Stengel et al. 2011]
[S15] FeatureIDE: An Extensible Framework for
Feature-Oriented Software Development 2012 [Thüm et al. 2012]
[S16] FeaturePlugin: Feature Modeling Plug-In for Eclipse 2004 [Antkiewicz and Czarnecki
2004] [S17] An Integrated Software Management Tool for
Adopting Software Product Lines 2012 [Park et al. 2012]
[S18] Kumbang Configurator – A Configuration Tool for
Software Product Families 2005 [Myllärniemi et al. 2004]
[S19] Towards a Model-Driven Product Line for Web
systems 2009 [Martinez et al. 2009]
[S20] PuLSE-BEAT – A Decision Support Tool for
Scoping Product Lines 2000 [Schmid and Schank 2000]
[S21] Moskitt4SPL: Tool Support for Developing
Self-Adaptive Systems 2012 [Gómez et al. 2012]
[S22] BeTTy: Benchmarking and Testing on the
Automated Analysis of Feature Models 2012 [Segura et al. 2012]
[S23] An Analysis of Variability Modeling and
Management Tools for Product Line Development 2007 [Capilla et al. 2012]
[S24] Visualization of variability and configuration
options 2012 [Pleuss and Botterweck 2012]
[S25] ASADAL: A Tool System for Co-Development of
Software and Test Environment based on Product Line Engineering
2006 [Kim et al. 2006]
[S26] RequiLine: A Requirements Engineering Tool for
Software Product Lines 2003 [von der Maßen and Lichter 2004]
[S27] ToolDAy: A Tool for Domain Analysis 2011 [Lisboa et al. 2011]
[S28] The Linux Kernel Configurator as a Feature
Modeling Tool 2008 [Sincero and Schröder-Preikschat 2008]
[S29] Automating Product-Line Variant Selection for
Mobile Devices 2007 [White et al. 2007]
[S30] Managing Feature Models with FAMILIAR: a
Demonstration of the Language and its Tool Support 2011 [Acher et al. 2011]
[S31] WeEasy-Producer – Product Line Development for
XX:10 • R. Bashroush et al.
[S32] OPTI-SELECT: an interactive tool for
user-in-the-loop feature selection in software product lines 2014 [Yamany et al. 2014]
[S33] MPLM - MaTeLo product line manager: [relating
variability modelling and model-based testing] 2014 [Samih and Bogusch 2014]
[S34] Variability code analysis using the VITAL tool 2014 [Zhang and Becker 2014]
[S35] ViViD: a variability-based tool for synthesizing
video sequences 2014 [Acher et al. 2014]
[S36] VMC: recent advances and challenges ahead 2014 [ter Beek et al. 2012]
[S37] WebFML: synthesizing feature models everywhere 2014 [Bécan et al. 2014]
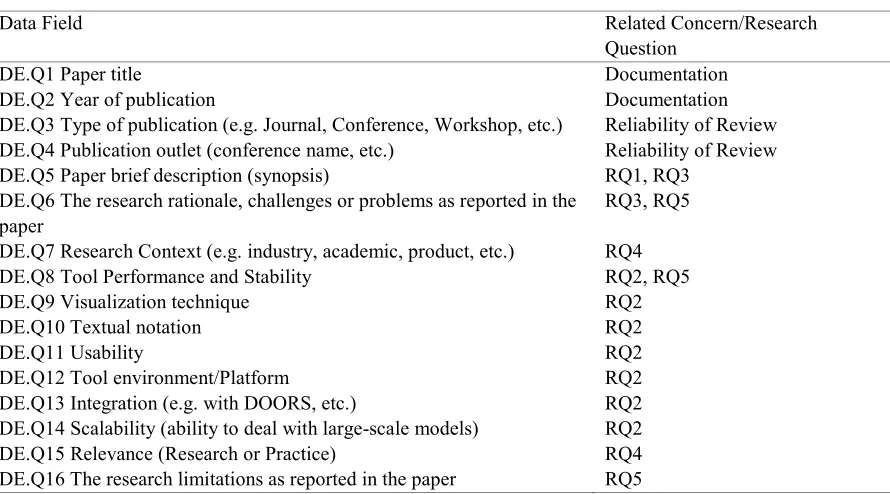
Upon the completion of the primary study selection phase, and the primary study quality assessment step, data extraction commenced. To answer the research questions, the following data was extracted from every primary study (cf. Table 5). The data extraction form below also shows the relevance of each of the extracted data elements to the study research questions.
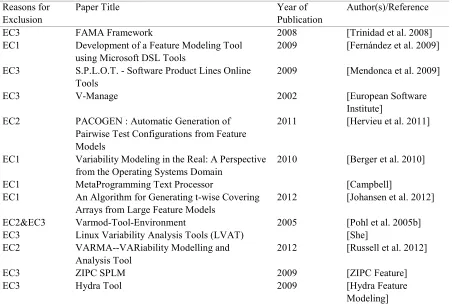
[image:10.612.85.533.95.209.2] [image:10.612.83.535.349.654.2]Besides the 37 primary studies included in the study, we identified further 13 tools (in the 113 papers identified in the first round as described above) that did not meet the inclusion/exclusion requirements. These are shown in Table 4 below, along with the criteria they did not meet.
Table 4. Studies Excluded in the Final Review
Reasons for
Exclusion Paper Title Year of Publication Author(s)/Reference
EC3 FAMA Framework 2008 [Trinidad et al. 2008]
EC1 Development of a Feature Modeling Tool
using Microsoft DSL Tools 2009 [Fernández et al. 2009]
EC3 S.P.L.O.T. - Software Product Lines Online
Tools 2009 [Mendonca et al. 2009]
EC3 V-Manage 2002 [European Software
Institute]
EC2 PACOGEN : Automatic Generation of
Pairwise Test Configurations from Feature Models
2011 [Hervieu et al. 2011]
EC1 Variability Modeling in the Real: A Perspective
from the Operating Systems Domain 2010 [Berger et al. 2010]
EC1 MetaProgramming Text Processor [Campbell]
EC1 An Algorithm for Generating t-wise Covering
Arrays from Large Feature Models 2012 [Johansen et al. 2012]
EC2&EC3 Varmod-Tool-Environment 2005 [Pohl et al. 2005b]
EC3 Linux Variability Analysis Tools (LVAT) [She]
EC2 VARMA--VARiability Modelling and
Analysis Tool 2012 [Russell et al. 2012]
EC3 ZIPC SPLM 2009 [ZIPC Feature]
EC3 Hydra Tool 2009 [Hydra Feature
Modeling]
Table 5. Data Extraction Form
Data Field Related Concern/Research
Question
DE.Q1 Paper title Documentation
DE.Q2 Year of publication Documentation
DE.Q3 Type of publication (e.g. Journal, Conference, Workshop, etc.) Reliability of Review
DE.Q4 Publication outlet (conference name, etc.) Reliability of Review
DE.Q5 Paper brief description (synopsis) RQ1, RQ3
DE.Q6 The research rationale, challenges or problems as reported in the
paper RQ3, RQ5
DE.Q7 Research Context (e.g. industry, academic, product, etc.) RQ4
DE.Q8 Tool Performance and Stability RQ2, RQ5
DE.Q9 Visualization technique RQ2
DE.Q10 Textual notation RQ2
DE.Q11 Usability RQ2
DE.Q12 Tool environment/Platform RQ2
DE.Q13 Integration (e.g. with DOORS, etc.) RQ2
DE.Q14 Scalability (ability to deal with large-scale models) RQ2
DE.Q15 Relevance (Research or Practice) RQ4
DE.Q16 The research limitations as reported in the paper RQ5
3 DATA EXTRACTION AND META-ANALYSIS
The next step after the data extraction step was the data synthesis and analysis step. In this section, we provide meta-analyses of the primary studies relating to their publication types, venues, trends and overall characteristics. In Section 4, we analyze the collected data to address the five main research questions of the study.
The first search of the systematic literature review resulted in 556 papers. The application of inclusion/exclusion criteria in several iterations resulted in 37 papers for the final review, which are listed in Table 3.
The primary studies included 18 conference papers, 6 journal papers, and 13 workshop papers. Fig. 4 presents a pie chart showing the percentage for each publication outlet. From the chart, it can be seen that conferences are more prominent venues for research on variability management tools followed by workshops, whereas journals seem to be less attractive outlets for research on tools. The 37 papers are spread over 24 different venues. This distribution further highlights the importance of this systematic review as a manual search of well-known conferences or journals could not possibly identify all the relevant literature.
;; 5%DVKURXVK HWDO
)LJ3HUFHQWDJHRIHDFKSXEOLFDWLRQW\SH
)LJ'LVWULEXWLRQRISULPDU\VWXGLHVRYHUWLPH
',6&866,212)5(6($5&+48(67,216
54:KDWWRROVKDYHEHHQGHYHORSHGWRPDQDJHYDULDELOLW\LQVRIWZDUHSURGXFWOLQHV"
7DEOHSURYLGHVDOLVWRIDOOWKHWRROVLGHQWLILHGLQWKH6/5LQFKURQRORJLFDORUGHU
7DEOH,GHQWLILHG7RROVZLWK7KHLU<HDURI,QWURGXFWLRQ%DVHGRQ3XEOLFDWLRQ
7RRO1DPH 6WXG\,' <HDURI,QWURGXFWLRQ
'$5(&27 >6@
2G\VVH\ >6@
3X/6( >6@
+ROPHV >6@
5HTXL/LQH >6@
&29$02) >6@
)HDWXUH0RGHOLQJ3OXJ,Q >6@
3/86(( >6@
;0/%DVHG)HDWXUH0RGHO >6@
$+($' >6@
XVCL [S4] 2004
KUMBANG [S18] 2005
BVR: Base-Variation-Resolution [S7] 2006
ASADAL (A System Analysis and Design Aid tooL) [S25] 2006
Scatter Tool [S29] 2007
VMWT [S23] 2007
L K C- Feature Modeling Tool [S28] 2008
FeatureMapper [S9] 2009
PLUM [S19] 2009
MUSA [S11] 2010
XToF – A Tool for Tag-based Product Line Implementation [S13] 2010
ToolDay [S27] 2011
View Infinity [S14] 2011
FAMILIAR [S30] 2011
DOPLER [S12] 2011
FeatureIDE [S15] 2012
ISMT4SPL [S17] 2012
BeTTy [S22] 2012
MOSKitt4SPL [S21] 2012
S2T2 Configurator [S24] 2012
Easy-Producer [S31] 2014
OPTI-SELECT [S32] 2014
MPLM-MaTeLo product line manager [S33] 2014
Variability code analysis using the VITAL tool [S34] 2014
ViViD: a variability-based tool for synthesizing video sequences [S35] 2014
VMC: recent advances and challenges ahead [S36] 2014
WebFML: synthesizing feature models everywhere [S37] 2014
A detailed analysis of the different tools is provided in the following sections.
4.2 RQ2: What are the characteristics of these tools?
In this section, the tools identified are studied in terms of their development environment, support for transformations (between different formats), management of constraints and reasoning on variability models, and their proposed graphical and textual notations.
4.2.1 Development Environment
The described tools are based on different development environments. The most frequently named platform is Eclipse (16 studies), which includes tools based on the Generic Eclipse Modeling Framework, GEMS (1 study); Eclipse Rich Client Platform RCP application development (1study); and the Eclipse Modeling Framework, EMF (9 studies). Within the latter group, two studies reported usage of textual modeling frameworks, i.e., EMFText [Heidenreich et al. 2009] and Xtext [Eysholdt and Behrens 2010], and three reported usage of graph-oriented UI frameworks, i.e., GMF [Eclipse] and prefuse [Heer et al. 2005].
;; 5%DVKURXVK HWDO
,Q WHUPV RI LPSOHPHQWDWLRQ ODQJXDJHV WRROV LQ VWXGLHV DUH EDVHG RQ -DYD RQH WRRO LV LPSOHPHQWHG LQ & 5HTXL/LQH>6@DQGRQHLQ&WKH/LQX[.HUQHO&RQILJXUDWRU>6@7KHUHPDLQLQJWRROVHLWKHUGRQRWVWDWH DQLPSOHPHQWDWLRQODQJXDJHRUDUHUHDOL]HGDVH[WHQVLRQVRIH[LVWLQJWRROV
7UDQVIRUPDWLRQ
7ZHOYHVWXGLHVUHSRUWHGWKHXVDJHRIVRPHWUDQVIRUPDWLRQPHFKDQLVPHJWRVXSSRUWJHQHUDWLQJRXWSXW7ZR XVHG;6/>6@DQG>6@RQHXVHGG\QDPLFORDGLQJRI6LPSOH;0/)HDWXUHPRGHOV6;)0>6@DQRWKHU XVHG;0/DQG-DYDVRXUFHILOHV>6@DQGRQHXVHGWKH',0$&6IRUPDWDZLGHO\XVHGVWDQGDUGIRU%RROHDQ IRUPXODVLQ&1)>6@
&RQVWUDLQWVDQG5HDVRQLQJ
)LIWHHQ VWXGLHV UHSRUWHG RQ WKH XVDJH RI FRQVWUDLQW ODQJXDJHV RU WKH XVDJH RI DXWRPDWHG UHDVRQLQJ EDVHG RQ FRQVWUDLQWVLQWKHZLGHUVHQVH6$7VROYHUVDUHXVHGIRULQVWDQFHE\WKH67&RQILJXUDWRU>6@)$0,/,$5 >6@DQG90&>6@D&63VROYHULVIRULQVWDQFHXVHGE\6FDWWHU>6@DQG>6@DQGSURSRVLWLRQDOIRUPXODV E\>6@
*UDSKLFDODQG7H[WXDO1RWDWLRQV
$PRQJWKHWRROVLGHQWLILHGLQWKHSULPDU\VWXGLHVVRPHVXSSRUWHGJUDSKLFDOQRWDWLRQVRQO\WRROVRWKHUV WH[WXDOQRWDWLRQVRQO\WRROVDQGIHZVXSSRUWHGPXOWLSOHQRWDWLRQVDQGYLHZVWRROV$GGLWLRQDOO\WKHUH ZHUHVRPHWKDWGLGQRWSURYLGHHQRXJKGHWDLOVRQWKHQRWDWLRQVVXSSRUWHG)LJVXPPDUL]HVWKHEUHDNGRZQRI WKHVH QRWDWLRQV EDVHG RQ WKH W\SH RI QRWDWLRQ VXSSRUWHG 7KHVH DUH GLVFXVVHG LQ GHWDLOV LQ WKH IROORZLQJ VXE VHFWLRQV
)LJ%UHDNGRZQRIWRROVEDVHGRQWKHW\SHRIQRWDWLRQVXSSRUWHG
*UDSKLFDO1RWDWLRQV
7KHJUDSKLFDOQRWDWLRQVDGRSWHGE\WKHWRROVUHSRUWHGLQWKHSULPDU\VWXGLHVFDQEHFODVVLILHGXQGHUWKHIROORZLQJ VL[YLVXDOL]DWLRQV
- )2'$OLNH
- )LOHWUHHOLNHYHUWLFDOWUHHV - *UDSKV
- +\SHUEROLFWUHHV
- /RJLFGLDJUDPVORJLFJDWHV - 80/
7KHILJXUHEHORZVKRZVWKHQXPEHURIWRROVVXSSRUWLQJHDFKYLVXDOL]DWLRQW\SH7KHILJXUHVKRZVWKDW)2'$OLNH DQG)LOHWUHHOLNHUHSUHVHQWDWLRQVDUHVWLOOWKHPRVWSRSXODUDSSURDFKHV
Fig. 7. Number of tools supporting each visualization type.
Tools in 11 studies are based on the FODA (Feature-Oriented Domain Analysis [Kang et al. 1990]) approach. These are:
- [S10], FODA with UML
- [S11], FODA, hyperbolic trees, logic diagrams and file tree
- [S14], FODA, zoom-able interface to color-coded source code
- [S15] and [S25], FODA with color coding
- [S17], FODA multiple trees per feature model
- [S21], FODA with color coding and basic file tree
- [S22], FODA basic feature tree with attributes
- [S27], FODA, UML and basic file tree
- [S30], FODA, basic file tree and coding area
- [S37], FODA and basic file tree
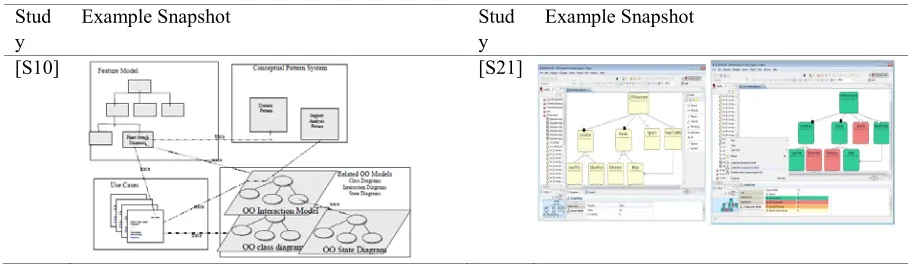
Examples of these notations are shown in Table 7 below (snapshots taken from the corresponding primary studies). As can be seen in the table below, different tools use different parts of the interface to display the FODA-like feature model. As such, they are all prone to graphical overloading issues, where once the feature model size gets into the hundreds, it becomes cumbersome to browse and manage.
Table 7. Tools with FODA-like Visual Notations
Stud
y Example Snapshot Study Example Snapshot
[image:15.612.78.533.538.670.2]XX:16 • R. Bashroush et al.
[S11] [S22]
[S14] [S22]
[S15] [S27]
[S17] [S30]
[S37]
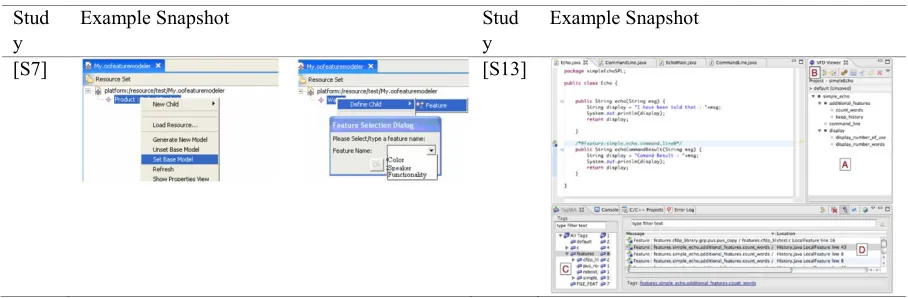
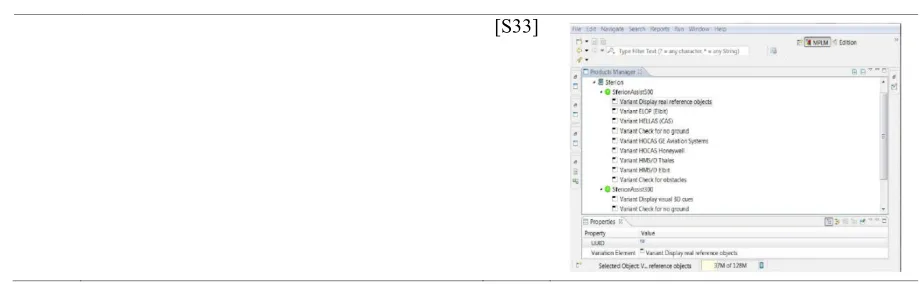
[image:17.612.79.533.354.503.2]Thirteen tools adopt file tree approaches of which 8 used basic right click functionality to access information (tools reported in studies [S7], [S9], [S13], [S26], [S28], [S31], [S32] and [S33]). Two studies are based on advanced customization (color, shapes, etc.) of feature icons (tools in studies [S12] and [S16]). One study reports file trees with semi-circles representing relationships among different features [S8]. Flow maps are also used in [S24]. A summary of these notations is shown in Table 8 below. As can be seen in the table below, this family of tools tends to be more scalable due to the inherent nature of the file tree navigation mechanism. However, they are not as good as FODA-like tools in enabling better intellectual control over the model (textual abstraction vs. graphical abstraction).
Table 8. Tools with File-tree-like Visualizations
Stud
y Example Snapshot Study Example Snapshot
XX:18 • R. Bashroush et al.
[S8] [S16]
[S9] [S24]
[S11] [S26]
[S12] [S28]
XX:20 • R. Bashroush et al.
[S33]
Three tools support graph-based visualizations, one includes a configuration interface using simple node-link graphs (user flows) with different objects [S2]; another tool supports the use of different objects for dependencies (circles, triangles, etc.), file tree, and coding area [S8]; and one tool is based on KOALA [van Ommering et al. 2000] like graph visualization, i.e., it is architecture-centric [S18]. Additionally, one tool adopts a logic diagram (schematics) visualization approach [S11]; another provides a UML-based visualization [S5]; and one adopts hyperbolic tree visualization [S11].
[image:20.612.73.533.89.231.2]Examples of these visualizations are shown in Table 9 below. Looking at the table below, it can be seen that notations that adopt hyperbolic views tend to have the best balance between scalability and intellectual control (abstraction). While managing to display the structure of the complete feature model, hyperbolic trees allow for browsing the model by displaying more details about nodes that are centered in the middle of the screen, allowing for smoother navigation capabilities, especially when paired with Natural User Interface (NUI) capabilities (e.g. pinching for zooming, etc.).
Table 9. Tools with Graph, Logic Diagrams, UML, and Hyperbolic Tree Visualizations
Stud
y Example Snapshot Study Example Snapshot
[S2]
Grap h
[S11] HyperbolicTr ee
[S8] Grap h
[S5] UML
[S18] Grap h
[S11] Logic Diagrams
There are studies that do not provide enough details on the graphical notation used in the tools described ([S19] and [S29]).
;; 5%DVKURXVK HWDO
)LJ1XPEHURIYLHZVSHUWRROIRUWRROVZLWKPRUHWKDQRQHYLHZ
7H[WXDO1RWDWLRQV
)RUWKHWH[WXDOQRWDWLRQVWRROVLQVWXGLHVUHSRUWHGWKHXVHRIWH[WXDOQRWDWLRQV7KHVHFDQEHFODVVLILHGXQGHU WKUHHGLIIHUHQWFDWHJRULHV
- &RGHOLNHZLWKV\QWD[VLPLODUWRSURJUDPPLQJODQJXDJHV - ;0/EDVHGQRWDWLRQVWKDWDUHEDVHGRQ;0/
- &RGHEDVHGQRWDWLRQVWKDWHPEHGYDULDELOLW\UHSUHVHQWDWLRQZLWKLQVRXUFHFRGH 7KHILJXUHEHORZVKRZVWKHQXPEHURIWRROVVXSSRUWLQJHDFKWH[WXDOQRWDWLRQW\SH
)LJ7RROVZLWKYDULRXVWH[WXDOQRWDWLRQV
&RGHOLNHQRWDWLRQVFDQEHIRXQGLQWKHWRROVGHVFULEHGLQ>6@>6@>6@>6@>6@DQG>6@([DPSOH VQDSVKRWVRIWKHVHQRWDWLRQVFDQEHIRXQGLQ7DEOHEHORZ
7DEOH7RROVZLWK&RGHOLNH7H[WXDO1RWDWLRQV
6WXG\ ([DPSOH6QDSVKRW 6WXG\ ([DPSOH6QDSVKRW
>6@ JXLPDLQFRPPRQ
FRPSLOH*FRPSLOH$ FRPSLOH% OQNJXLPDLQFRPSLOH& OLQNJXLPDLQ
>6@ FRQILJ*3/
ERROHDQ³5227´ VHOHFW0
common: common: compile X2 compile X2
gui:
clean: compile G delete *.gif
super.clean lnk: gui main link gui main
clean:
delete *.gif delete *.class
choice
depends on GPL prompt “Graph Type”
config DIRECTED boolean “Directed” config UNDIRECTED boolean “Undirected” endchoice config NUMBER default y if GPL requires (BFS ∥ DFS) boolean “Number” ---help---
Assigns a unique number to each vertex as a result of a graph
[S18] Kumbang model KumbangExample
root feature FSystem; root component CSystem
feature FSystem { subfeature
(FeatureA, FeatureB) f; implementation
instance_of(f, FeatureA) <==> value($, attr) = a; instance_of(f, FeatureB) <==> value($, attr) = b; }
feature FeatureA {} feature FeatureB {}
component CSystem { attributes ABBalue attr; }
attribute type ABValue = 42
[S30]
GraphicCard:
DirectX Bus [Vertex]; // Vertex is optional
DirectX: (v10 | v10.1)+; // Or-group
Bus: (n64 | n128); // Alternative-group
n64 -> Vertex; // Constraints
[S34] Variability Code Metrics
Supported in VITAL
Metric Description
VP Nesting Degree #ifde nesting level of a given VP
Var Tangling Degree #Vars used in a given VP
Var Fan-out on VPG #VPGs that
[S36] Station(I,N,J,M) =
( [N = 0] nobike(I).Station(I,N,J,M) + [N > 0] bike(I).Station(I,N-1,J,M) ) + return(I).Station(I,N+1,J,M) +
redistribute(may,?FROM,?TO,?K). ( [TO = I] Station(I,N+K,J,M) + [TO /= I] Station(I,N,J,M) ) + [N > M] redistribute(may,I,J,N-M).Station(I,M,J,M)
Users(I,J) = request(I).
XX:24 • R. Bashroush et al.
contain a given Var
Var Fan-out on File #files that contain a given Var
Var Fan-in on File #Vars included in a given File VP Fan-in on File #VP included in a given file
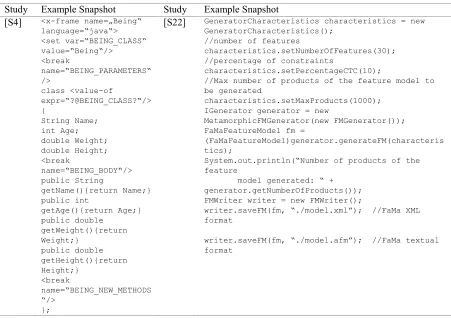
[image:24.612.81.532.349.667.2]XML-based notations are supported in [S4], [S8], and [S22]. Samples of these notations are presented in Table 11 below.
Table 11. Tools with XML based textual notations
Study Example Snapshot Study Example Snapshot
[S4] <x-frame name=„Being“ language=“java“> <set var=“BEING_CLASS“ value=“Being“/> <break name=“BEING_PARAMETERS“ /> class <value-of expr=“?@BEING_CLASS?“/> { String Name; int Age; double Weight; double Height; <break name=“BEING_BODY“/> public String getName(){return Name;} public int getAge(){return Age;} public double getWeight(){return Weight;} public double getHeight(){return Height;} <break name=“BEING_NEW_METHODS “/> };
[S22] GeneratorCharacteristics characteristics = new
GeneratorCharacteristics(); //number of features
characteristics.setNumberOfFeatures(30); //percentage of constraints
characteristics.setPercentageCTC(10);
//Max number of products of the feature model to be generated
characteristics.setMaxProducts(1000); IGenerator generator = new
MetamorphicFMGenerator(new FMGenerator()); FaMaFeatureModel fm =
(FaMaFeatureModel)generator.generateFM(characteris tics);
System.out.println(“Number of products of the feature
model generated: “ + generator.getNumberOfProducts()); FMWriter writer = new FMWriter();
writer.saveFM(fm, “./model.xml”); //FaMa XML format
writer.saveFM(fm, “./model.afm”); //FaMa textual format
</x-frame>
[S8] <variationpoint id=”[id]”>
<artefact> [artefact identifier] </artefact> <abstractionlayer> [abstraction layer] </abstractionlayer> <description> [description] </description>
<type> optional |
alternative | optional variant |variant | value
<type>
<variants> <!-- if not type=value --> <variant id=”[id]”> . . .
<variant id=”[id]”> </variants>
<range> [range specification] </range> <!-- if type=value --> <state>
open | closed </state>
<mechanism> [mechanism] </mechanism> <bindingtime> [bindingtime] </bindingtime> <rationale> [rationale] </rationale> </variationpoint>
[image:25.612.83.533.103.543.2]Finally, Code-based notations are found in [S7], [S13], [S14] and [S35]. These are demonstrated in Table 12 below.
Table 12. Tools with Code-based Textual Notations
Study Example Snapshot Study Example Snapshot
[S7] class Watch {
Color color;
Waterproof waterproof; Depth depth;
[S14] class Test {
static Exp e;
XX:26 • R. Bashroush et al.
... }
class Color {...} class Yellow extends Color {...}
class Metallic extends Color {...}
class Depth {...} class 50m extends Depth {...}
class 100m extends Depth {...}
Test.evaltest();
}
static void evaltest() { e = new Num(1);
System.out.println(“eval (1) = “ + e.e
e = new Neg (new Num (1);
System.out.println(“eval(Neg(1) =” e = new Plus (new Num(1), new Num(2));
System.out.println(“eval(1+2)=” + e.e e = new Neg(new Plus(new Num(1), new Num
System.out.println(“eval(-(1+2))=” + }
static void printtest() { e = new Num(3);
System.out.println(“print(3) = “ + e) e = new Neg(new Num(5));
System.out.println(“print(Neg(5)) = “ e = new plus(new Num(5), new
Num(7));
System.out.println(“print (5+7) = “ + }
[S13] // The syntax of
feature tags is:
<fcomment> ::= "/*@feature:" <flist> "@*/" [<filetag>] <flist> ::=
<featurename> ( ":" <flist> ) *
<filetag> ::=
"/*@!file_feature!@*/"
// where <featurename> identifies a
// feature of the FD.
[S35] Relationships: 2 sequence { 3 signal_quality 4
cloneBetween 0 and 5 vehicle 5 //. . . 6 } 7 8 Attributes: 9 @NT string sequence.comment 10 @RT int vehicle.speed [0..130] delta 5 default 4 0 11 @ND int *.cost [0 .. 1000] default 150 12 real signal_quality.luminance_mean 13 [0.0 .. 3 2.0] delta 2.0 14 [3 2.0 .. 224.0] delta 8.0 15 [224.0 .. 255.0] delta 2.0 16 default 7 2.5 5 17 //. . . 18 19 Descriptions: //. . . 20 21 Constraints: //. . . 22 23 Objectives: 24 objective
generate_low_cost_configurations { 25 min (sum (*.cost)) 26 } 27 Configurations: //. . .
The samples above demonstrate that it can be difficult for humans to read all of these descriptions, whether they are written in code-like, code-based or XML format. When a textual notation is concise and easily readable and editable, many developers often prefer to work with simple text editors over a graphical user interface; However, for very complex notations (too complex to edit manually), it is essential to provide GUI-based tool support. With regard to variability management tools, there is a need to develop a standardized description format to allow better exchange of information among the different tools (such as the CVL initiative, see http://www.omgwiki.org/variability/). Competition between different tools would then be based on the quality of presentation and intuitiveness of navigation of such information by end-users, be it a textual or graphical notation.
Finally, there were six further notations that did not provide enough details in the paper about the textual notations they support, namely [S1], [S6], [S15], [S20], [S23], and [S24].
4.3 RQ3: What is the quality of the research conducted in the reported approaches?
We analyzed the quality of research using the quality scores (0, 0.5, 1) for the eight quality questions (cf. Section 2.4) and also assessed how the studies address four different quality attributes important for tools usability, integration, scalability, and performance.
Table 13 presents the results of the quality assessment of the 37 studies included in the final review according to the quality questions. A frequency analysis of the scores for each quality question is presented in Fig. 10. Most studies (92%) provide a rationale for why the study was undertaken (Q1). Almost half of the studies (41%) describe the context in which the research was carried out (Q2), 27% at least partially describe the context. More than half of the papers (60%) described the variability management tool in enough detail to be able to perform an in-depth analysis of the capabilities of the tool (Q3). Only one paper did not describe the tool at least partially. Very few studies (0,05%) present an evaluation of their proposed tools including feedback from end users (Q4). Over 60% of the studies do not evaluate their tool at all. Less than a third of the studies (30%) support substantive claims made in the paper with reliable evidence (Q5). Less than a third (30%) of the studies compare and evaluate their own results against related work (Q6). Finally, very few studies (16%) discuss the credibility of their findings (Q7) and limitations (Q8).
[image:27.612.191.422.427.540.2]In general, the authors provided a motivation and a description of the research context, but papers lacked data to support the claims and findings. Also, authors seldom provided a critical reflection of their results. Even though the tools were described well in the papers, most variability management tools presented were not well evaluated, especially with respect to feedback from end users. The lack of industrial validation and evidence could be an important factor limiting the industrial adoption of these tools.
Table 13. Results of the Quality Assessment of the Primary Studies
No (0) Partial (0,5) Yes (1) Average Score
Q1 1 2 34 0,95
Q2 12 10 15 0,54
Q3 1 14 22 0,78
Q4 23 12 2 0,22
Q5 11 15 11 0,50
Q6 19 7 11 0,39
Q7 16 15 6 0,36
XX:28 • R. Bashroush et al.
[image:28.612.76.534.458.537.2]Fig. 10. Frequency analysis of quality scores for each question.
Table 14presents different quality attributes we focused on in our review (usability, integration, scalability, and performance) and how well they were addressed by the studies. The quality attributes were identified through an interview-based survey conducted with a number of SPL practitioners who were asked to list their five most important attributes of an SPL tool. Fig. 11 shows the frequency analysis of the results for each quality attribute. As can be seen, most studies do not mention the attributes explicitly with only a few studies providing contributions to the different areas of the quality attributes. Interestingly, none of the tools contributes and evaluates usability. Few evaluate integration and only one study evaluates scalability and performance, respectively. Even though quite a few tools contribute to the various quality attributes, the lack of attention of researchers to these quality attributes (not explicitly mentioning them or evaluating them), which are high up in the priority list of practitioners, can be seen as another potential reason behind the very limited industrial adoption of these tools.
Table 14. Quality Attributes Addressed by Studies
Does Not Mention
(0) Mentions (1) Contribution (2) Contrib. and Eval. (3) Average Score
Usability 19 8 10 0 0,76
Integration 21 0 13 3 0,97
Scalability 24 8 4 1 0,51
Performance 24 4 8 1 0,62
Fig. 11. Frequency analysis of scores for each quality attribute.
4.4 RQ4: What is the context of research?
This section discusses the context of the research in the surveyed studies, i.e., whether the research is conducted in an academic or industrial context, the industrial domain of focus, and the covered main activities in a product line approach (scoping, analysis, implementation, testing).
4.4.1 Research Context: Academia vs. Industry
The distribution of the research context of the studies is presented in Fig. 12. The figure shows that most studies (68%) have been conducted in an academic context. Only 16% of the studies are joint industrial-academic endeavors. In 16% of the studies, no information was provided on the research context. Table 15 presents a list of all studies with their research context.
Although the primary research context of some studies was academic, few still had practical relevance. Fig. 13 shows the distribution of the relevance of the primary studies. Almost half of the studies (41%) are relevant to academia only. 36% of the studies are relevant to both academia and industry, with 10% of the studies relevant to practice only. Finally, 13% of the studies provided no sufficient data to be classified.
Table 15. Research Context of the Primary Studies
Academia Industry and academia No information
S1 X
S2 X
S3 X
S4 X
S5 X S6 X S7 X S8 X
S9 X
S10 X
S11 X
S12 X
[image:29.612.183.433.484.665.2]XX:30 • R. Bashroush et al.
S14 X S15 X S16 X S17 X S18 X
S19 X
S20 X
S21 X
S22 X S23 X
S24 X
S25 X
S26 X S27 X S28 X S29 X
S30 X
S31 X S32 X
S33 X
S34 X
S35 X
[image:30.612.178.437.92.564.2]S36 X S37 X
Fig. 12. Research context of primary studies.
Fig. 13. Relevance of primary studies.
4.4.2 Focus and Industrial Domain
[image:31.612.78.532.367.647.2]In terms of a potential specific industrial application domain, most of the surveyed studies (86%) can be considered as generic, i.e., not focusing in a particular sector. Just 14% of the studies are specific enough to be linked to a particular domain (see Table 16). Furthermore, the application domains of the examples presented in the studies were quite diverse (see the rightmost column of Table 16).
Table 16. Industrial Domain of the Primary Studies
Focus Industrial domain Domain of example
S1 Domain analysis Generic ---
S2 Domain analysis Generic ---
S3 Conceptual model of feature-oriented
programming Generic Calculators, military simulators
S4 Variability realization Generic Computer aided dispatch
systems
S5 Variability modelling Generic Factory automation,
e-commerce
S6 Feature modelling Generic ---
S7 Variability modelling Generic Product line of watches
S8 Variability modelling Generic Intelligent traffic systems
S9 (Consistency in) Variability modelling Generic ---
S10 Variability modelling Generic ---
S11 Variability modelling Generic ---
S12 Variability modelling Generic Steel plants
S13 Variability realization Generic Satellites
S14 UI for Variability realization Generic ---
S15 Variability modelling Generic Graph library
S16 Feature modelling Generic ---
S17 Variability modelling Generic Surveillance cameras (toy
XX:32 • R. Bashroush et al.
S18 Configuration Generic Automotive, weather
station network
S19 Configuration, generation of products Web-based applications Media
S20 Scoping Generic Planning software
(fictitious)
S21 DSPL for self-adaptive systems Generic ---
S22 Testing of feature model analysis
techniques Feature model analysis techniques ---
S23 Survey of Tools Generic ---
S24 Configuration Generic Automotive software
(fictitious)
S25 Software Product Line Engineering Generic Service robots
S26 RE for product lines (i.e., combined with
feature modeling) Generic ---
S27 Domain analysis Generic Electronic submission
system
S28 Configuration Linux kernel ---
S29 Configuration, Optimization of
configuration Mobile applications ---
S30 Configuration Generic ---
S31 Configuration, product derivation Generic Yard management system
S32 Configuration, Optimization of
configuration Generic ---
S33 (Introducing variability to) Model-based
Testing Generic Aerospace
S34 Analysis of Variability Generic ---
S35 Product derivation in specific domain
(video) Generation of customized videos ---
S36 Model checking of product lines Generic Bike sharing
S37 Synthesis of feature models Generic Wikis
Generic: 32 out of 37 (86%)
Specific domain: 5 out of 37 (14%)
4.4.3 Covered Product Line Activities
[image:32.612.82.527.97.529.2]We analyzed the surveyed studies with respect to the supported product line activities. It is often not a clear-cut decision whether an approach supports a particular activity. For instance, many approaches for product configuration assume that configuration decisions are made by considering requirements in some way. Additionally, it is difficult to clearly distinguish the activity of scoping (defining the boundaries of a product line and its targeted market segment) from domain analysis and the process of defining the available configuration options.
Table 17 shows an overview of which approach supports which product line activity. We distinguish between “Scoping and Requirements”, “Domain Analysis”, “Domain Implementation”, and “Testing/ Verification & Validation”. It is worth noting that “Domain Analysis” includes activities leading to the definition of a
configuration space and the available options. “Testing/V&V” addresses the quality of the products and their implementation, e.g., testing products for defects. This does not include techniques addressing the consistency between artifacts.
Table 17. Covered Product Line Activities
Scoping and
Requirements (incl. Definition of a Domain Analysis Configuration Space)
Domain
Implementation (excl. Consistency Testing and V&V of Artifacts)
S1 (x) x --- ---
S2 (x) x --- ---
S3 --- x x ---
S4 --- (x) x ---
S5 x x x ---
S6 --- x --- ---
S7 --- x x ---
S8 --- x x ---
S9 --- (x) x ---
S10 x x (x) ---
S11 --- x --- ---
S12 --- x x ---
S13 --- --- x ---
S14 --- --- x ---
S15 x x x ---
S16 --- x --- ---
S17 x x (x) ---
S18 --- x --- ---
S19 (x) x x ---
S20 x (x) --- ---
S21 --- (x) --- ---
S22 --- x --- x
S23 --- x x ---
S24 --- x --- ---
S25 (x) x x x
S26 --- x --- ---
S27 x x (x) ---
S28 --- x --- ---
S29 --- x --- ---
S30 --- x --- ---
S31 --- x x ---
S32 --- x --- ---
S33 --- x (x) x
S34 --- x x ---
S35 --- x x ---
XX:34 • R. Bashroush et al.
S37 --- x --- ---
Total 10 35 20 4
Percentage 27% 95% 54% 11%
[image:34.612.83.532.95.133.2]x = fully covered, (x) = partly covered, --- = not covered
[image:34.612.147.449.223.317.2]Fig. 14 provides the corresponding overview: 27% of the studies can be considered addressing aspects of “Scoping and Requirements”. Not surprising, given the scope of this survey, almost all studies (95%) address Domain Analysis in one way or another. 54% of studies consider aspects of “Domain Implementation”, and only 11% address “Testing/Verification & Validation”.
Fig. 14. Covered product line activities.
4.5 RQ5: What are the main challenges faced by current Product Line Management (PLM)
tools?
Our last research question aimed at analyzing the main challenges faced by current tools as well as limitations of the tools. We, therefore, analyzed the 37 selected studies regarding the challenges and limitations of current variability management tools they discuss. Using the coding technique [Seaman 1999], we first scanned the studies looking for keywords “challenge”, “issue”, “limitation”, and “drawback” and then extracted the related text (statements on challenges and/or limitations). This allowed us to find out which studies do not discuss any limitations or challenges (no statements extracted); which studies at least mention challenges or limitations (statements extracted list challenges or limitations, but do not discuss them); and which studies actually discuss challenges or limitations (statements extracted list and discuss challenges or limitations). 56% do not discuss limitations at all, 27% at least mention some limitations without further discussing them, and only about 17% actually discuss limitations. We find this a general weakness of publications on variability management tools, i.e., that they do not discuss their own limitations, which makes it hard to assess tools’ usefulness.
Challenges are more frequently discussed (73% provide a discussion, 13% at least mention challenges, only 13% do not even mention challenges), i.e., authors mention what was the challenging part of implementing their tool and/or what challenges their tool addresses.
We eventually analyzed the extracted statements and (through discussion and refinement among researchers) came up with ten categories for challenges and limitations, in which we could group the extracted statements on challenges and limitations discussed in detail below (ordered by the number of studies providing input to the category).
The key challenge of variability management tools is scalability of models, i.e., how to develop variability models that are still useful despite their size and complexity. 40% of the selected studies discuss this challenge and suggest different solutions as described above. The second most discussed challenge is checking models for consistency and correctness (23%), especially how to keep the models consistent with the underlying architecture and check
that the models represent the variability of the product line correctly. Mapping problem and solution space (20%) is also discussed as a key challenge to be addressed by variability management tools. Many tools only take care of creating and managing the variability models representing variability but not of how to map variability (e.g., represented by features or decisions) with the actual artifacts realizing this variability. Visualization/Graphical Overload is discussed as a challenge by 17% of the selected studies. Variability management tools must provide ways to cope with the size and complexity of variability models to help users suffering from graphical overload with visualizations. Other important challenges are usability and maintenance and evolution of variability models
(both 13%). Addressing both challenges is essential for tools to be useful and successful in practice in the long run. Integration of variability management and (legacy) software (development), i.e., the question of how to adopt a variability management tool in practice, is also still an important issue and discussed by 10% of the selected studies. Process Improvement/Automation through variability management (7%) is explicitly discussed by 2 selected studies, even though this is actually the key goal of variability management tools anyway. Two further challenges, which are discussed by one study each, are supporting the modeling of non-functional properties in variability management (e.g., resource consumption constraints) and compliance (with standards/quality policies/regulations).
4.5.1 Scalability of (Variability) Models (12 Studies)
In an initial discussion, we had called this category “working with one large model vs. working with several separate models”. However, through our discussion we found out that the statements we categorized here actually are all about challenges regarding the scalability of (variability) models.
For instance, the authors of [S17] report experiences from empirical case studies that confirm that the complexity of variability management stems from the need to work with (too) large models. Study [S4] highlights the importance of compositional approaches to product line representation/implementation to address this challenge. Study [S21] report on a tool supporting variability management in self-adaptive systems, which again adds to the challenge of scalability of models.
XX:36 • R. Bashroush et al.
dependencies should be explicitly represented. The Odyssey Reuse environment [S10] specifies “patterns based on both architectural styles and specific information from the application domain to create a complete reuse environment, which defines software architectures and conceptual model representations on a high level of abstraction.”
4.5.2 Checking Models for Consistency and Correctness (7 Studies)
Checking the models underlying the variability management tools for consistency and correctness is considered as a key challenge by seven of the 30 studies. For instance, the authors of RequiLine [S26] argue that semantic information is needed for an automated consistency check in variability management tools. Study [S5] highlights that consistency checking among the multiple views in a product line (as provided by their tool) is essential. FeatureMapper [S9] provides diverse visualizations to support the SPL engineer in verifying the correctness of the models (feature models, mapping models, solution space models) and argues this is very important. The authors of Odyssey [S10] suggest specifying the “operations that will be performed on models, as well as to systematize these operations, to facilitate the consistent creation of models.” The DOPLER tools [S12] have an integrated consistency checking component that checks the consistency on different levels, i.e., in problem space, in solution space, and between problem and solutions space. ToolDAy [S27] is one of the few studies that discuss their limitations, i.e., that complex consistency rules cannot be described in their tool. The authors of study [S3] highlight the use of model checkers in their tool as important future work.
4.5.3 Mapping Problem and Solution Space (6 Studies)
Six studies highlight the challenges and limitations of mapping problem and solution space, i.e., mapping the variability representation with the actual product line architecture. For instance, ISMT4SPL [S17] discusses “traceability between decisions in variability/feature models and the corresponding implementation artifacts” as a key challenge for variability management tools. The authors of study [S16] report about a limitation of their tool, i.e., that the support for mapping problem and solution space is missing. FeatureMapper [S9] explicitly focuses on this aspect by introducing mapping models to map feature models and solution space models. Kumbang [S18] explicitly integrates architecture models (i.e., Koalish, an architecture description language/component model based on Koala ADL but adding variability concepts) with feature models within its tool support. DOPLER [S12] uses explicit asset models to represent the solution space and links these models with the problem space decision models via so-called inclusion conditions. Code tagging tools such as XToF [S13] do not map both spaces but rather integrate the representation of the problem space into the solution space, or, as could be argued, just represent solution space variability (i.e., variability in code).
4.5.4 Visualization/Graphical Overload (5 Studies)
Five studies argue that visualization of variability easily leads to a graphical overload of the tool user and is a key challenge. For instance, the author of study [S11] argues that “it is important for a variability management mechanism to be able to extract and present relevant information about a variability model in dedicated views for different groups of stakeholders (users, system analysts, developers, etc. to alleviate the graphical overload when showing all the information in one view.” ViewInfinity [S14] provides seamless and semantic zooming of different abstraction layers of an SPL. Study [S8] argues that variability models should “represent variation points as first class entities in all abstraction layers (from features to code); provide a hierarchical organization of variability; focus on the first class representation of simple and complex dependencies (dependencies that affect the binding of a large number of variation points, e.g. quality attributes); and explicitly represent dependencies”. ST2T [S24] provides sophisticated visualization and interaction techniques to address the challenge that handling variability and configurations is hard due to the complexity on a cognitive level as human engineers reach their limits in identifying, understanding, and using all relevant details. Study [S16] highlights this as a key limitation of their tool, i.e., that a graphical representation missing.
![Fig. 1. Systematic Literature Review process [Brereton et al. 2007].](https://thumb-us.123doks.com/thumbv2/123dok_us/409697.1040902/4.612.207.403.211.494/fig-systematic-literature-review-process-brereton-et-al.webp)
![Fig. 2. SLR review protocol process [Brereton et al. 2007].](https://thumb-us.123doks.com/thumbv2/123dok_us/409697.1040902/5.612.244.368.145.350/fig-slr-review-protocol-process-brereton-et-al.webp)