2017 3rd International Conference on Electronic Information Technology and Intellectualization (ICEITI 2017) ISBN: 978-1-60595-512-4
Multidimensional BSS/WSS Criterion for
Modified SBFS Feature Selection
Method in Tumor Classification
Hongyi Peng and Chunfu Jiang
ABSTRACT
To avoid the defect of BSS/WSS criterion, we propose a multidimensional BSS/WSS feature selection criterion and modify the sequential backward floating selection (SBFS) algorithm to deal with the case where the covariance matrix is singular in this study. Then, we use support vector machine (SVM) to classify the gene expression data based on the proposed feature selection algorithm. The performance of the proposed approach is compared with BSS/WSS criterion and some other popular methods in feature selection and classification via the well-known colon cancer and prostate datasets in microarray literature, which demonstrates that the proposed criterion can take into account genes' joint discriminatory power, and the proposed feature selection method can obtain correct and informative gene subset for tumor classification.
KEYWORDS
Multidimensional BSS/WSS Criterion, Feature Selection, Modified SBFS Algorithm, Tumor Classification
______________________
Hongyi Peng, College of Mathematics and Informatics, South China Agricultural University, Guangzhou 510642, PR China
Chunfu Jiang, College of Mathematics and Computational Science, Shenzhen University, Shenzhen 518060, P R China
INTRODUCTION
The development of microarray technology increases the possibility of cancer classification and diagnosis at the gene expression level [1,2]. The problem of analysis of gene expression data is challenging because of the number of genes is usually much larger than the number of samples available. Jain et al.[3] points out that there are too many features, which may be irrelevant to the analysis actually, degrade the generalization performance of a classifier. Thus, identification of genes (i.e., features) that contribute most to the classification is critical to improve the accuracy and speed of prediction systems.
In the past decade, there are a vast amount of literatures reported, which focused on how to use a feature selection method for tumor classification [4,5,6,7]. In addition, several methods for reducing the number of genes to be considered before using the appropriate classification, are univariate methods in the sense that each relevant gene is considered individually. Examples include the weighted voting scheme, signal-to-noise (SNR) [4], the mixture model algorithm [8], the Wilcoxon test statistic [9], and the ratio of their between-group to within-group sums of squares (BSS/WSS) [5]. But BSS/WSS is single variable criterion and it cannot reflect variables' joint discriminatory power.
cases in this paper. We call our feature selection as M_BW in brief. We illustrate the advantage of our method on two well-known microarray datasets: colon cancer data [1] and prostate data [15] and use support vector machine (SVM) to classify the gene expression data.
The remainder of the paper is organized as follows. Section 2 proposes a multidimensional BSS/WSS feature selection criterion. Section 3 proposes a modified SBFS algorithm to deal with the case where the covariance matrix is singular. Section 4, an experiment is carried out to demonstrate the proposed M_BW method. Finally, the conclusion is provided in section 5.
MULTIDIMENSIONAL BSS/WSS CRITERION
In order to select the feature subset whose joint discriminatory power is maximum among all the subsets of the same number of features, the key is to consider the correlation between features and their joint discriminatory. The one-dimensional BSS/WSS criterion is defined as follows [5]
2 2 i k i ki i k
i k
I y k x x J x
I y k x x
Where x is a column vector, denotes a gene, xi denotes the i-th sample expression level of gene x, x denotes the average expression level of gene x and
k
x
denotes the average expression level of gene x across samples belonging to class .k
We extend it to a multidimensional situation. The M_BW criterion can be defined in the followings:
1
1
,
i k X k
k
i i k X i k
k
I y k X X X X J X
I y k X X X X
Where X denotes the data set of gene expression, where the number of rows of X is equaled to the number of samples, the number of rows of X is equal to the
number of genes (features) being selected, Xi is the i-th row vector of X, X is the
MODIFIED SBFS FEATURE METHOD
When the number of samples is less than the number of genes as in many gene
expression profiling studies, the covariance matrix X is likely to be singular, hence
resulting in a numerical problem in calculating
1
X
But the SBFS method [14] cannot deal with the case. In order to solve this problem, we propose a modified SBFS method to deal with the case.
Modified SBFS Procedure
We can design the modified SBFS algorithm by the following four steps:
Step 1. Start with the complete set X0 X.
Step 2. If the matrix X is singular, then compute the M_BW according to
section 3.2 and delete feature xk1 from the set Xk, to form feature set Xk1, i.e. the
least significant feature xk1 is deleted from the set Xk. Therefore Xk1Xkxk1,
and go to step 2. Else if the matrix X is not singular, then go to step 3.
Testing singularity using det
X toleranceis not recommended as it is
difficult to choose the correct tolerance. The condition number of X can check for
singular and nearly singular matrices. For example, if the condition number of X
is greater than 1000, then the matrix X is singular.
Step 3. According SBFS algorithm to search feature subsets in data set Xk, where every feature subset has the largest multidimensional BW if the numbers of features are the same.
Suppose k features have already been removed from the complete set of
measurements F0 Xk to form feature set Fk with the corresponding criterion
function J F
k . Furthermore, the values of all supersets F ii, 1, 2, ,k1, areknown and stored, where Xk has E available features.
Step 4. Compute the prediction accuracyP F
k ,k1, 2, ,E base on k-foldcross-validation and obtain the optimal feature subset Fk with the best predict accuracy. If there are several feature subsets have the same best predict accuracy,
Algorithm for Computing M_BW in Singular Situation
Suppose the threshold value of condition number is .C If the condition number
of matrix X is greater than C, then the matrix is singular, and we can compute the
J X as follows:
Step 1. Perform principal component analysis on the matrix X , i.e.
V L, P X ,
where P
denotes a function which performs the principal components analysis, V is a p-by-p matrix, with each column containing coefficients for one principal component. The columns are in order of decreasing component variance. L is a vector containing the principal component variances,that is, the eigenvalues of X are in order of decreasing component variance.
Step 2. Let p0min
i L
1,1 L i,1 C
.Step 3. Let L2 ,1
i 1 L i
,1 ,1 i p L, 2 ,1
i 0,ip0, where L2 is acolumn, and it has the same number of rows with the vector .L
Step 4. Let
2
, 2
i k k
k
i i k i k
k
I y k X X V D L V X X J X
I y k X X V D L V X X
where D L
2returns a square matrix, with the elements of L2 on the main diagonal.
EXPERIMENTAL RESULTS
We illustrate the usefulness of the proposed M_BW approach via two well-known datasets: the colon cancer data analyzed initially by Alon et al. [1] and the prostate cancer data analyzed by Singh et al.[15].
Colon Dataset
H20709 (14), T57619 (43), T51529 (127), M76378 (267), D26129 (350), R87126 (493), M76378 (765), R88740 (792), X74295 (1247) and R54097 (1473), where the numbers in the parentheses are the indices of features in the original colon cancer dataset. We find that the M76378 gene has three indices in the colon cancer dataset, which are 245, 267,765. We choose out two indices of M76378, i.e. 267 and 765.
TABLE I. EXPERIMENTAL RESULTS ON THE COLON CANCER DATASET.
Method Number of genes LOOCV error rate 10-fold CV MCR
SVM [7] 1000 or 2000 9.68% 10.12%
LogitBoost,100 iterations [6] 10 14.52% 15.22%
AdaBoost,100 iterations [6] 10 16.13% 17.13%
gsg-SSVS [10] 14 11.29% 11.93%
10 11.29% 11.93%
6 11.29% 11.93%
DC-Lq-SVM 10 16.71% 17.92%
SRC-LatLRR 1000 7.82% 8.06%
BSS/WSS-SVM 5 8.06% 9.03%
10 11.29% 11.58%
20 16.13% 16.35%
40 20.97% 20.94%
MSWM-SVM 7 8.06% 8.99%
M _BW-SVM 10 4.84% 5.07%
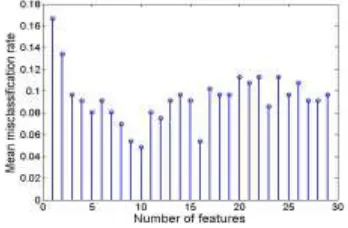
Figure 1. The stem plot of the MCRs of 29 marked feature subsets for colon dataset.
[image:6.612.195.442.186.509.2]It is common to evaluate the performance of the classification methods for a selected subset of features by the LOOCV and 10-fold CV procedures. The summary of performance is presented in TABLE I. The M_BW method selected 10 features. When using the LOOCV procedure, our method misclassified one tumor tissue (T30) and two normal tissues (N34, N36). The summary is presented in TABLE I. It is clear from the comparison that our method is much better than the other popular classification methods.
[image:6.612.212.386.393.507.2]DC-Lq-SVM [12], SRC-LatLRR[16] and MSWM- SVM [11]. At the same time, we choose P = 5, 10, 20, 40 genes identified by the one-dimensional BSS/WSS criterion, and their performance are all worse than M_BW criterion’s. Therefore, we think that the M_BW criterion is reasonable for measuring genes' joint discriminatory power, and our feature selection method can obtain a good informative feature subset on the colon tumor classification.
Furthermore, some of the genes selected by our method are known to be associated with the Colon cancer of leukemia cells. For example, CRP (M76378) gene polymorphism is associated with increased colon cancer risk in African Americans compared to whites in the North Carolina colon cancer study [17]. At the same time, we find that the J02854 and M63391 genes rank 2 and 3 of the top 150 genes, respectively, which suggests their individual gene discriminatory powers are very strong. However, such genes are not included in our analysis. Nevertheless, we think that if J02854 or M63391 gene is combined with other genes, their joint discriminatory power cannot be the best.
Prostate Dataset
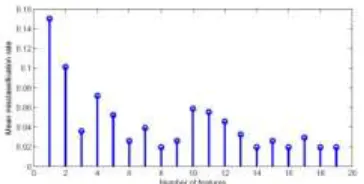
[image:7.612.215.397.563.655.2]This dataset provides the expression levels of 12600 genes for 50 normal tissues and 52 prostate cancer tissues [15]. The experiment was run on Affymetrix human 95aV2 arrays. Oligonucleotide microarrays contain probes for approximately 12,600 genes and ETSs. In this experiment, we rank the discriminatory power of an individual gene according to the one-dimensional BSS/WSS firstly, and obtain 200 top ranked genes. The threshold value of the condition number is 500 in this experiment. In the second step of the modified SBFS procedure, we choose out 19 genes from the 200 genes M_BW criterion. In the fourth step of modified SBFS procedure, we compute the MCRs of 19 marked feature subsets and Figure 2 is the stem plot of the MCRs of 19 marked feature subset. From figure 2, we can see that the feature subset with 18 features have the least MCR. We selected 8 genes, which are AF037643 (996), M30894 (4365), T89651 (7304), Z11692 (8552), Z48199 (9133), AL036744 (10138), AF055376 (10234) and U21689 (11871), where the numbers in the parentheses are the indices of features in the original prostate cancer dataset.
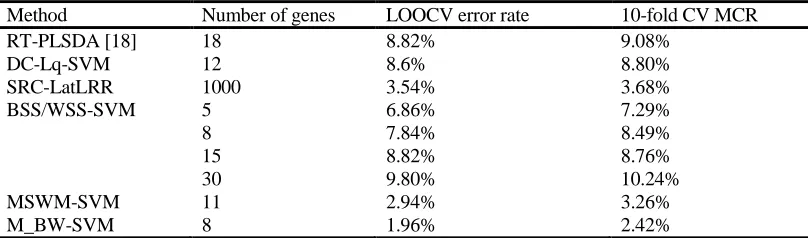
TABLE II. EXPERIMENTAL RESULTS ON THE PROSTATE CANCER DATASET.
Method Number of genes LOOCV error rate 10-fold CV MCR
RT-PLSDA [18] 18 8.82% 9.08%
DC-Lq-SVM 12 8.6% 8.80%
SRC-LatLRR 1000 3.54% 3.68%
BSS/WSS-SVM 5 6.86% 7.29%
8 7.84% 8.49%
15 8.82% 8.76%
30 9.80% 10.24%
MSWM-SVM 11 2.94% 3.26%
M_BW-SVM 8 1.96% 2.42%
As the same as colon cancer data section, we evaluate the performance of the classification methods for a selected subset of features by the LOOCV and 10-fold CV procedures for prostate cancer dataset. The M_BW method selected 8 features. The summary is presented in TABLE II. It is clear from the comparison that our method is much better than the other popular classification methods.
From TABLE II, when using the 10-fold CV procedure, we can also see that our proposed classification method outperform the other classification methods, i.e., DC-Lq-SVM [12], SRC-LatLRR [16] and MSWM- SVM [11]. At the same time, we chose P = 5, 8, 15, 30 genes identified by the one-dimensional BSS/WSS criterion, and their performance are all worse than the M_BW criterion’s. Therefore, we think that the M_BW criterion is reasonable for measuring genes' joint discriminatory power, and our feature selection method can obtain a good informative feature subset on the prostate tumor classification.
Furthermore, some of the genes selected by our method are known to be associated with the prostate cancer. For example, antibody induction to TARP (M30894) may represent a possible biomarker for treatment response to GM-CSF secreting cellular immunotherapy in prostate cancer patients [19], HEPSIN (X07732) gene is one of the most consistently overexpressed genes in patients with prostate cancer [20]. At the same time, we find that the AF035283 and AL050152 genes rank 3 and 4 of the top 200 genes, respectively, which suggests their individual gene discriminatory powers are very strong. However, such genes are not included in our analysis. Nevertheless, we think that if AF035283 or AL050152 gene is combined with other genes, their joint discriminatory power cannot be the best.
CONCLUSIONS
A reliable and precise classification of tumors is essential for successful treatment of cancer. Microarray technology increases the possibility of cancer classification and diagnosis at the gene expression level. However, many factors may affect the outcome of the analysis. One of them is the huge number of genes included in the original data. Some of them may be irrelevant to the analysis. Thus, selecting informative genes is critical to improving the accuracy and speed of prediction systems. At the same time, a reasonable criterion is very important to feature selection.
In this paper, we propose a M_BW criterion to avoid the defect of BSS/WSS criterion and propose a modified SBFS method to deal with the case where the covariance matrix is singular. We apply our M_BW method to two different gene expression data sets: the colon and prostate datasets. We have compared the M_BW method with other popular methods, for example, LogitBoost, AdaBoost, gsg-SSVS, MSWM, RT-PLSDA, SRC-LatLRR, DC-Lq-SVM and BSS/WSS methods. The results show that the M_BW criterion is reasonable for measuring genes' joint discriminatory power and the M_BW method can obtain a good informative gene subset for tumor classification.
ACKNOWLEDGEMENT
This work is supported by the National Statistical Science Research Project of China under No. 2015LY81 and No.2016LY98.
REFERENCES
1. Alon, U., Barki, N., et al. 1999. “Broad patterns of gene expression revealed by clustering
analysis of tumor and normal colon tissues probes by oligonucleotide arrays,” Pro. Natl. Acad.
Sci. USA, 96: 6745-6750.
2. Ben-Dor, A., Bruhn, L., et al.. 2000. “Tissue classification with gene expression profiles,” J.
Comput. Biol. ,7:559-583 .
3. Jain, A.K., Duin, R.P.W. and Mao, J. 2000. “Statistical pattern recognition: a review,” IEEE
Pattern Anal., 22(1):4-37.
4. Golub, T. R., Slonim, D.K., et al. 1999. “Molecular classification of cancer: class discovery and
class prediction by gene expression monitoring,” Science, 286(5439): 531-537.
5. Dudiot, S., Fridlyand, J. and Speed, T.P..2002. “Comparison of discrimination methods for the
classification of tumors using gene expression data,” J. Am. Stat. Assoc., 97(457):77-87.
6. Detting, M. and Buuhlmann, P. 2003. “Boosting for tumor classification with gene expression
data ,” Bioinformatics, 19:1061-1069.
7. Furey, T., et al.. 2000. “Support vector machine classification and validation of cancer tissue
samples using microarray expression data,” Bioinformatics, 16: 906-914.
8. Pan,W. 2002. “A comparative review of statistical method for discovering differentially
9. Detting, M. 2004. “Bag Boosting for tumor classification with gene expression data,”
Bioinformatics, 20: 3583-3593.
10. Yang, A.J. and Song, X.Y. 2010. “Bayesian variable selection for disease classification using
gene expression data,” Bioinformatics, 26(2):215-222.
11. Peng, H.Y., Fu, Y.L., et al. 2013. “Optimal gene subset selection using the modified SFFS
algorithm for tumor classification,” Neural Comput. Appl., 23:1531-1538.
12. Guan,W. and Gray, A.. 2013. “Sparse high-dimensional fractional-norm support vector machine
via DC programming,” Comput. Stat. Data An., 67:136-148.
13. Peng, H.Y., Jiang, C.F., et al.. 2014. “Variable selection for Fisher linear discriminant analysis
using the modified sequential backward selection algorithm for microarray data,” Appl. Math.
Comput., 238:132-140.
14. Pudil, P., Novovicova, J. and Kittler, J. 1994. “Floating search methods in feature selection,”
Pattern Recog.Lett., 15(11):1119-1125.
15. Singh, D., Febbo, P.G., et al. 2002. “Gene expression correlates of clinical prostate cancer
behavior,” Cancer Cell , 1: 203-209.
16. Gan, B., et al. 2014. “Sparse Representation for Tumor Classification Based on Feature
Extraction Using Latent Low-Rank Representation,” BioMed Res. Int. ,1-9.
17. Keku, T.O., Galanko, J., et al. 2006. “IL-6, TNF-A and CRP gene polymorphisms are associated
with increased colon cancer risk in African Americans compared to whites in the North Carolina
colon cancer study,” Gastroenterology ,130(4):54-55.
18. Mao, Z.Y., et al. 2013. “Selecting significant genes by randomization test for cancer
classification using gene expression data,” J. Biomed. Inform. ,45:594-601.
19. Nguyen, M.C., Tu, G.H., et al.. 2010. “Antibody responses to galectin-8, TARP and TRAP1 in
prostate cancer patients treated with a GM-CSF-secreting cellular immunotherapy,” Cancer
Immunol. Immun. 59(9):1313-1323.
20. Kim, H.J., Han, J.H., et al. 2012. “Variants in the HEPSIN gene are associated with