2017 2nd International Conference on Computational Modeling, Simulation and Applied Mathematics (CMSAM 2017) ISBN: 978-1-60595-499-8
Evaluation on the Flow Field Effects by the
Changes of Artificial Reef Shapes
Rui-jin ZHANG, Qiao-feng MA, Yan-bin XI and Jia-nuo XU
College of Marine Technology and Environment, Dalian Ocean University, Dalian 116023, P.R. China
Keywords: Artificial reef, Shape change, Numerical simulation, Flow field effect, Evaluation.
Abstract. The artificial reef changes the flow field which will impact the surrounding fish's tropism and distribution. In this paper, FLUENT is used to simulate the flow field of three sets of artificial reefs including different size of the opening, inflow angle and cylinder shape and the change of the shape effect of flow field are discussed. Then, fuzzy evaluation method is applied to evaluate the flow field effect caused by the above three groups of artificial reef. Finally, in order to provide a theoretical basis for the optimization of the shape of artificial reefs, a special combination of three sets of optimal specimen and the three best specimens have been evaluated to verify the rationality of the evaluation system.
Introduction
Due to the human over-exploitation and utilization of fishery resources, fishery resource is facing a severe recession. Artificial reefs have been proved to be an effective way to protect and improve the marine ecological environment, to increase the amount of biological resources, to improve the ecological environment of the coastal waters and to conserve of fishery resources functions. After launching artificial reefs, the flow field near the reef will be changed, a upwelling is produced in the front of the reef and a back vortex is produced at the back of the reef[1]. The change will affect the distribution of the sediment, nutrients, etc., and there will be an impact on the surrounding fish’s tropism and distribution[2-3]. Therefore, the researches of the flow characteristics around the artificial reefs become more popular in recent years. The research of the complex flow field-effect around artificial reefs has been more mature, however, the systematic evaluation of the different shapes of the artificial reef effect of convection field has not been put forward.
In this paper a fuzzy evaluation on the effect of artificial reef shape change convection field effect has been performed to make a good evaluation on the shape of artificial reef.
Model
The calculation model used in this paper is VOF two-phase flow model, which is solved by using Fluent.
Governing Equation
(1) Continuity equation:
0
u v w
x y z
(1)
(2) Momentum conservation equation:
u
u p
div uu div gradu S
t x
(2)
w
w p
div wu div gradw S
t z
(4) Where u, v and w are the velocity in the x, y, and z direction, respectively. t is the time, ρ is the density of fluid,uis the vector of velocity, μ is the dynamic viscosity, p is the pressure, Su, and Sv
and Sw are the generalized source terms of the equation to the momentum conservation.
Turbulence Model
K - turbulent model, the viscosity coefficient equation is given below[4]:
𝜌𝜕k
𝜕𝑡+ 𝜌uj
∂k
∂xj=
∂
∂xj[(η +
ηt
σk)
∂k
∂xj] + ηt
∂ui
∂xj(
∂ui
∂xj+
∂uj
∂xi) − 𝜌𝜀 (5)
𝜌𝜕𝜀
𝜕𝑡+ 𝜌𝑢𝑘
𝜕𝑘
𝜕𝑥𝑘=
𝜕
𝜕𝑥𝑘[(η+
ηt σε)
𝜕𝜀
𝜕𝑥𝑘] +
𝑐1𝜀
𝑘 η𝑡
𝜕𝑢𝑖
𝜕𝑥𝑗(
𝜕𝑢𝑖
𝜕𝑥𝑗+
𝜕𝑢𝑗
𝜕𝑥𝑖) − 𝑐2𝜌
𝜀2
𝑘 (6)
ηt = cu′𝜌𝑘
1
2𝑙 = (cu′cD)𝜌𝑘2 1
𝑐𝐷𝑘 3
2/𝑙
=𝑐𝑢𝜌𝑘2
𝜀 (7)
cu = cu′c
Dcu = cu′cD (8)
The equation introduces coefficients 𝑐1,𝑐2,𝑐𝑢 and σk,σε,σT, in this calculation, these empirical constants are 1.44, 1.92, 0.09, 1.0, 1.3 and 0.9~1.0 respectively.
Computational Area and Mesh Generation
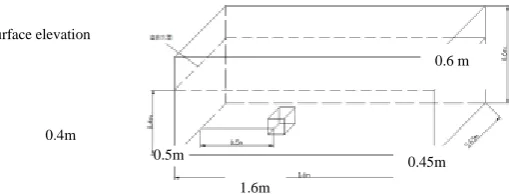
[image:2.595.134.389.440.537.2]A sink with 1.6m long, 0.45m wide and 0.6m high was adopted in this calculation, as shown in Fig.1. The water depth is 0.4 m and the artificial reef is put in the center of the sink. A hybrid grid is used to combine the characteristics of the structural grid computing efficiency and the complex boundary of the unstructured grid, and the grid is discrete to the computing domain using Gambit.
Figure 1. The reef model in computational domain.
Boundary Conditions and Parameter Settings
Fluent is based on finite volume method, the algorithm of steady-state solver is selected as PISO algorithm. Air is the first phase, and the water is the second phase. The pressure reference point which is located at sink on the surface does not change via time, air density is set to be 1.225 g/cm3, water inlet velocity boundary is 0.18 m/s, the reef body model, the bottom and sides of the sank are set to be wall, friction coefficient is 0.5, choose 5000 iteration steps, which can achieve convergence.
Simulation of Flow Field
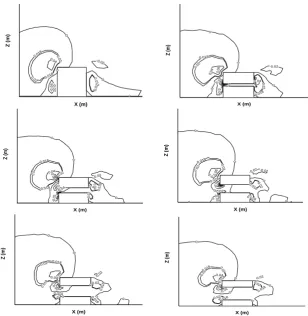
This paper mainly analyzes two aspects of the shapes of fish reefs: opening ratio and the shape of a cylinder optimal artificial reef for sorting. The distribution of flow fields around the fish reefs with the opening ratio of 0, 0.1, 0.2, 0.3, 0.4 and 0.5 is shown in Fig. 2. The numerical simulation of three prismatic columns, four prisms, five prisms, six prisms and cylindrical flow fields respectively is shown in Fig. 3.
Surface elevation
0.4m
1.6m
0.45m 0.6 m
Figure 2. Flow fields around artificial reefs with opening ratio of 0 to 0.5 (unit: m/s).
(a).prism (b). four prism (c).Five prism
[image:3.595.100.484.400.613.2](d). sixprism (e). cylinder
Figure 3. Flow fields around artificial reefs with different prisms(unit: m/s).
Evaluation Method
In this paper the method of fuzzy evaluation is adapted to evaluate the results of the numerical simulation. An artificial reef evaluation method considering various factors is proposed, and a good artificial reef scheme of flow field effect is proposed.
Fuzzy Evaluation Method
Fuzzy theory was proposed by American automation expert professor L.A. Zadeh in 1965. A system or object that evaluates to a fuzzy concept. The method used is very logical. Demanding
-0
.0
4-0.0
2 0 0 0 0 0.018
0.018
0 .01 8 0 .02 0.02 0.0 2 0.04 -0.02 X (m) Z (m ) 0.018 0.02
0.04 0.
06 0 -0 .02 -0 .04 0 0.040.0 2 0.018 0 -0.02 0 0 X (m) Z (m ) -0 .0 6 -0.04 -0.02 0 0 0 0 0 0 0.018 0.018 0.02 0.0 2 0 .02 0.04
0.01 8 0 .0 4 -0.0 2 0.06 X (m) Z (m ) -0.0 4 -0.02 0 0 0 0 0 0 0 0.018 0.018 0.018 0.0 2 0.02 0.02 0.040
.06 0 -0.0 2 0.02 0.018 -0.02 X (m) Z (m ) -0.0 2 0 0 0 0 0 0 0 0.01 8 0.018 0.018 0.02 0.02 0.02 0.04
0.01 8 0.02 0.018 -0.0 2 X (m) Z (m ) -0.02 -0.02 0 0 0 0 0 0.01 8 0.018 0.018 0.01 8 0.02 0.02 0.02 0.04 -0.0
4 0.02
X (m) Z (m ) 0.018 0.02 0 .04 0 -0 .0 2 0 0 -0.02 0 0 0.01 8 0.02 0 X (m) Z (m )
0.018 0.018 0.018
0.02 0.04
0 -0.0 2 -0.04 0 0 -0.02 0 X (m) Z (m ) 0.01 8 0
.02 0.
(1) List the characteristic value of matrix: (each evaluation object has m indicators, and evaluates the advantages and disadvantages of n schemes.)
11 12 1n
21 22 2n
m1 m2 mn
x x x x x x x x x
X
(9) i=1, 2,…,m, j=1,2,…,n, which Xij is the i characteristic value of scheme j index.
(2) Defining characteristic value type:
The larger the value, the better. The corresponding index of the maximum characteristic value of the scheme concentration indicator i is 1, and the characteristic value of the target is 0. The smallest index has a relative membership of 0, which makes up the pros and cons.
Its relative membership matrix is:
R
mn m2
m1
2n 22
21
1n 12
11
r r r
r r r
r r r
(10)
rij is referred to as the relative superiority of the programme index.
ij imin
imax imin x - x x - x
ij
r
(11)
Selection of Evaluation Indexes
After launching the reef on the bottom of the nearshore, it can change the direction of flow, wave, tide and so on and can produce upwelling and backflow around the reef. The upwelling can promote the exchange of upper and lower sea water, increase the oxygen content of water body, and promote the exchange of nutritive salt. The formation of backflow vortex can slow the flow rate, which is conducive to the accumulation of feeding organisms and the breeding of the attached organisms, along with the sediment of the base and nutrient salts. Therefore, the scale of upwelling and eddy current scale can be used as the evaluation index for the effect of fish reef flow field. In addition, the surface area provided by artificial reefs can provide habitats for fish. Based on the above, this paper first discusses the following aspects in the selection of indicators: upwelling, back eddy and reef surface area.
Establishment of Evaluating System
(1) Evaluation index system model
𝐴𝑟𝑡𝑖𝑓𝑖𝑐𝑖𝑎𝑙 𝑟𝑒𝑒𝑓 𝑓𝑙𝑜𝑤 𝑓𝑖𝑒𝑙𝑑 𝑒𝑓𝑓𝑒𝑐𝑡
{
𝑈𝑝𝑤𝑒𝑙𝑙𝑖𝑛𝑔 𝑋1{
𝐻𝑒𝑖𝑔ℎ𝑡 𝑜𝑓 𝑢𝑝𝑤𝑒𝑙𝑙𝑖𝑛𝑔 𝑋11
𝑊𝑖𝑑𝑡ℎ 𝑜𝑓 𝑢𝑝𝑤𝑒𝑙𝑙𝑖𝑛𝑔 𝑋12
𝑀𝑎𝑥𝑖𝑚𝑢𝑚 𝑓𝑙𝑜𝑤 𝑟𝑎𝑡𝑒 𝑜𝑓 𝑢𝑝𝑤𝑎𝑟𝑑 𝑓𝑙𝑜𝑤 𝑋13
𝐵𝑎𝑐𝑘 𝑒𝑑𝑑𝑦 𝑓𝑙𝑜𝑤𝑠 𝑋2{𝐵𝑎𝑐𝑘 𝑣𝑜𝑟𝑡𝑒𝑥 ℎ𝑒𝑖𝑔ℎ𝑡𝑋21
𝐵𝑎𝑐𝑘 𝑣𝑜𝑟𝑡𝑒𝑥 𝑤𝑖𝑑𝑡ℎ 𝑋22
[image:5.595.153.450.70.127.2]𝑅𝑒𝑒𝑓 𝑠𝑢𝑟𝑓𝑎𝑐𝑒 𝑎𝑟𝑒𝑎 𝑋3
Figure 4. Evaluation index system of the flow field effect of artificial reef.
(2) Determination of weights:
Based on the artificial reef to affirm the target weights of the evaluation of the effect of flow field, to minimize the subjective factors of the evaluation process, the expert consulting method (Delphi) and analytic hierarchy process (AHP) with the combination of methods. First of all, through the analytic hierarchy process to establish a comprehensive evaluation index system of the flow field effect of artificial reefs and by establish the blank form and attach selected indicators on the basis of background information, such as printing, by the artificial reef and fluid mechanics experts, to establish judgment matrix. After the expert scores were recovered, the criteria of the selected indicators were reassessed, and the judgment matrix is tested in consistency. In this process, some unnecessary indexes are removed and a more reasonable index system is established. Secondly, it will be determined that a good evaluation system will be sent to the relevant experts in the form of a letter, to evaluate the importance of different indicators, establish comparison matrix, and carry out weight calculation.
Results
Flow effects by different shapes of artificial reefs are evaluated:
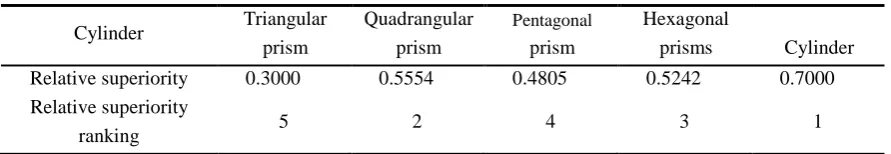
[image:5.595.79.521.501.565.2]Based on the values of the selected indexes, the eigenvalue matrix X is established. The larger the eigenvalue, the better. The relative membership degree of the maximum eigenvalue is 1, and the relative membership of the minimum eigenvalue is 0 and the relative superiority is calculated according to the formula (11). Finally, the relative superiority of each reef flow field effect is calculated and the order is shown in Tab.1 and Tab.2. Compared with the optimal order, the flow field effect is the best when the opening ratio is 0.2, followed by 0.1 and 0.4. For cylinder shape change, the cylindrical flow field has the best effect, followed by four prism and six prism.
Table 1. The order of optimal membership degree at different opening ratios.
Open-radio r 0 0.1 0.2 0.3 0.4 0.5
Relative superiority 0.5000 0.5222 0.5875 0.4343 0.5168 0.5000 Relative superiority
ranking 4 2 1 6 3 4
Table 2. The order of optimal membership degree of different prism.
Cylinder Triangular prism
Quadrangular
prism
Pentagonal
prism
Hexagonal
prisms Cylinder
Relative superiority 0.3000 0.5554 0.4805 0.5242 0.7000 Relative superiority
ranking 5 2 4 3 1
Discussion
Optimization Design Model
[image:5.595.76.522.585.662.2]upwelling distribution area is larger. The circular flow trend of the cylinder is obvious, and the scale of the back vortex formation is the largest. In this paper, the angle of inflow is 90 degrees, and the final design of the fish reef is a cylinder with a diameter of 10cm. The middle opening is a cylinder of 2cm and the reef height is 10cm. The design is mainly based on the advantage of the upwelling of the triangular prism and the eddy current of the column. The fish reef opening can increase the inhabiting area of the fish, which is beneficial to lure the fish, as shown in Fig.5. Upwelling model of optimizing design of reefs and back eddy current distribution as shown in Fig.6, on the basis of the cylindrical fish reef model after optimization design upwelling and back-eddy flow is improved, combines the advantages of three prismatic and cylindrical flow field, in order to increase the fish habitat area, so the opening in the center of the reefs, choose a relatively good opening ratio of 0.2, the reefs upwelling height is 15.31 cm, upwelling width is 9.47 cm. Back-eddy flow height 10.02 cm, back vortex height 11.18 cm, maximum flow velocity of 12.94 cm/s.
Comparison of Artificial Reef Models
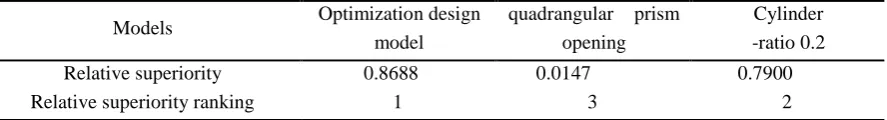
[image:6.595.264.327.322.414.2]Flow field effect of the comprehensive evaluation index for the optimization design model, and his mouth than rectangular and cylindrical 0.2 evaluate the merits of the flow field effect, the optimal size and to the various index, optimal weighted eventually come to the comprehensive As shown in Tab.3, the optimization design of flow field effect is best, followed by the column.
[image:6.595.221.362.436.547.2]Figure 5. Model of artificial reef in optimal design.
Figure 6. Flow field of around model of artificial reef in optimal design (unit:m/s). Table 3. Order of optimal membership degree of different artificial reef.
Models Optimization design model
quadrangular prism opening
Cylinder -ratio 0.2
Relative superiority 0.8688 0.0147 0.7900
Relative superiority ranking 1 3 2
Conclusion
(1)This paper presents a method of fuzzy evaluation and evaluates the numerical simulation results and verifies the feasibility of the evaluation method.
[image:6.595.80.524.588.648.2]Acknowledgement
Thanks for the support of National Natural Science Foundation of China (No. 31302232 and No. 51779038) and Liaoning Provincial Department of Education outstanding talent project (No. LJQ2015017).
References
[1] Liu Tongyu. The flow state effect of artificial reef [J]. Aquatic technology, 2003, (6): 43-44. (in Chinese)
[2] Yu Congda, Yu Cungen, Yan Shiqiang. Research on optimization of artificial reef laying patterns [J]. Ocean and lake, 2004, 35 (4): 299-305.(in Chinese)
[3] Li Jun, Lin Jun, Zhang Shouyu. Numerical experiments on the permeability of the square artificial reef and its impact on the flow field around the reef [J]. Journal of Shanghai ocean university, 2010, 11 (19): 836-840.(in Chinese)
[4] Luo Tiqian. Hydrodynamics [M]. Beijing: mechanical industry press, 2003. (in Chinese)
[5] B.E Launder, D.B Spalding. Lectures in mathematical models of turbulence[M]. London: Academic Press, 1972.
[6] Matsuoka Hiroshi, Nishiwkai YaSushi, Ryjov Alexnader, etc. An evaluation method on the integrated safe guards based on fuzzy theory. Information sciences, 2002, 142(1): 131-150.
[7] Seaman W. Artificial reef evaluation with application to natural marine habitants [M]. Boca Raton: CRC Press, 2000: 51-94.