2016 International Conference on Mathematical, Computational and Statistical Sciences and Engineering (MCSSE 2016) ISBN: 978-1-60595-396-0
Multi-Parameter Placement Optimization of Shipboard
Antennas Based on SAGA
Zhen-ji LIU
1, Zhao GANG
2and Xiao-nan ZHAO
21Wuhan Maritime Communication Research Institute, Wuhan, 430079, China
2China Ship Design and Development Centre, Wuhan, 430064, China
Keywords: Antennas, SAGA, Placement optimization.
Abstract. Along with the development of the computer technology and the optimization Algorithm, the study of shipboard antennas placement has come into optimization era. To the author’s knowledge nobody has used SAGA (Simulated Annealing Genetic Algorithm) to optimize the placement of shipboard antennas. This thesis configures the parameters of SAGA. Utilizing the antenna performance parameters calculated by MLFMA (Multilevel fast multiple algorithm) in ANSYS to SAGA, achieved the placement optimization of shipboard antennas.
Introduction
The placement of shipboard antennas affects the electromagnetic compatibility of the whole system. To keep the electromagnetic compatibility of the system we must study the placement of the antenna, to harmonize the tactical target of the whole system. Optimizing the placement of shipboard antennas aims at maximizing the communication capability of shipboard antennas, and minimize the electromagnetic radiation on human body and the electromagnetic interference between the antennas or the equipments. After physical and numerical method, the antennas placement study came into optimizing simulation era. Shipboard antennas placement optimization is a complex nonlinear and multiple constrained problem. Reference [1], in 2005 EMC(Electromagnetic Compatibility) Nation Key Library optimized shipboard antennas placement based on GA. But if the setting of parameters or the evolutionary strategy is not very felicitous, the Algorithm will always converges to local optimization result. Since the GA has its imminent limitations and the SA (Simulated Annealing Algorithm) has the advantages in some aspects, these two algorithms are combined together to achieve the perfection.
Recent years, SAGA has been used very abroad, such as logistic, pipe network and structure optimization. In this study, we use SAGA to optimize the placement of shipboard antennas.
Simulated Annealing Genetic Algorithm
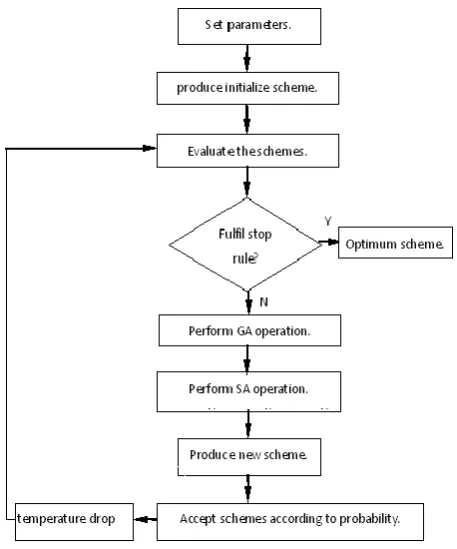
The object of GA is the natural number coding chromosome based on antenna positions. This characteristic of GA made the algorithm have better whole search capability when optimizing the placement of antennas. The SA accepts new results according to annealing principle in the process of search. This characteristic improves the efficiency of SA, and avoids the algorithm convergence to partial results. Integrate GA and SA to form SAGA. Set target function to be interior energy. Set
control parameter to be temperature t . Starts from initialize result i and initialize control
parameter t, to reiterate iterative the results. The control parameter will be attenuated in the
Figure 1. Flow chart of SAGA.
The Optimize Model for Shipboard Antennas Placement
The shipboard antenna optimization is a multi-target problem, as in reference [3] and [4]. We can describe the problem as that, to seek a variable which can fulfil all constrains. The variable should also make the vector which formed by sub-target functions to be optimization. However the sub-target functions are always conflict each other. It is impossible to make all the sub-target function to be optimization simultaneity. We should split the difference to make each sub-target function to be optimization the whole way. So optimize here means to make each sub-target function which formed the target function to fulfil the request of the designer.
Set the position parameter ci to be the optimize variable,
1 2
1 1 1 2 2 2
, , ,
, , , , , , , , , m
m m m
C c c c
x y z x y z x y z
(1)
In this formula, c means the aggregate formed by the position coordinates of the antennas. m
means the number of antennas optimized, here m6.xi、 yi and zi i1,2,,m are the coordinates
of the antennas, unit is meter. The scale of xi, yi and zi is the region of the ship where antenna
can be placed.
Analyze the optimization parameter and relatively standards to form shipboard antennas placement optimization target function and the constrain model. Target function expresses the relationship between antenna positions and technology parameters. The Target function is used to evaluate the antennas placement scheme is good or full. Constrain model is used to exclude the schemes which dissatisfy the standards. The process is carried out by the whole region search of the SA. So we can always gain optimization antennas placement schemes.
Here define the target function F C f, p of shipboard antennas placement optimization.
1
min , ,
n
p p p p
p
F C f F C f
' ' '
1 2 3
1, 1 1 1
, , , , , , , , , , , , ,
M M M
p p ij ij i i i j j j p i i i i i p i i i i i p
i j i i
i j
F C f a d L x y z x y z f a t x y z f a s e x y z f
(3)
In the formula(2), n means the number of the frequency. fp means the work frequency of the
frequency serial number p.
p
F means the target function of the antenna when the frequency is
p
f .p means the weighting coefficient of Fp . In the formula(3), M means the number of
antennas which should be considered in the process of shipboard antennas optimization, M m. '
ij
L
is the relative value of , , , , , ,
ij i i i j j j p
L x y z x y z f .Lij means the space isolator between the antenna
i, i, i
i x y z and the antennaj x y z i, i, i. '
i
is the relative value ofixi,yi,zi,fp. i means the pattern
distortion of the antenna i x y z i, i, i.ei( )' is the relative value ofe x y z fi i, i, ,i p ,e( )i means the relative
near field radiant intensity.
0 , , , , , ,
, , , i i i i p i i i i p
i i i p
E x y z f e x y z f
E x y z f
(4)
In the formula, , , ,
i i i i p
E x y z f means the radiant intensity of the antenna i in the near fields,
where there are human, fuel or arms.
0 i, i, ,i p
E x y z f means the limitation of the fields in relative
standards. dij means the weighting coefficient of isolator for single antenna pair, show in
formula(5).
1, 1
0, 1 ,and 1 M ij ij i j i j d d (5) i
t means the weighting coefficient of pattern distortion for a single antenna.
1
0, 1 ,and 1
M i i i t t (6) i
s means the relative near field radiant intensity for a single antenna.
1 0, 1 ,and 1
M i i i s s
(7)1, 2 3
a a and a mean the weighting coefficient of technology parameters,
1 2 3 1
a a a . The
target of shipboard antennas placement optimization is to optimize the placement of the six antennas. In order to improve the isolation, pattern distortion and near field radiation intensity of the antenna system.
Placement Optimization of Shipboard Antennas Based on Saga
Figure 2. Antennas placement model.
[image:4.595.61.522.304.374.2]The antennas placement schemes are import to the ANSYS software to gain the technology parameters of antennas. Then use the parameters to optimize the antennas placement based on SAGA in Matlab. The following text present the optimization placement based on SAGA and the placement based on GA. Then contrast the antennas position of different schemes gained by different algorithm, as showing in Table 1. We just optimized x coordinate and y coordinate, z coordinate which is fixedness.
Table 1. Antennas position by different algorithm.
Algorithm Antenna 3# Antenna 6# Antenna 9# Antenna 11#
physical model (4.81,97.02) (-7.40,60.50) (-7.20,53.50,) (-2.33,54.52)
GA (4.78,97.98) (-7.03,64.47) (-7.45,55.45,) (-2.15,54.91)
SAGA (4.80,96.80) (-7.50,60.83) (-7.30,53.03,) (-2.36,55.70)
It is obvious that the positions of antennas gained by SAGA are closer to the position gained by physical model than the position gained by GA. We can see that SAGA is applicable to the optimization of shipboard antennas placement. This is a new way for optimization of shipboard antennas placement except GA.
Results and Discussion
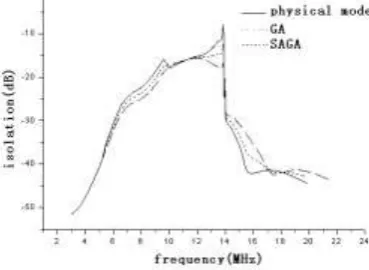
Calculate the capability parameters of each antennas placement scheme based on MLFMA, to evaluate the suitability of SAGA in optimization of antennas placement. Contrast the isolation of
antenna pair 6#and 9#, result is showed in Figure 3. The unit of isolation is dB.
Figure 3. Contrast of isolation.
[image:4.595.201.386.530.665.2]References
[1] Zhang qi and Zhao gang, Application of Genetic Algorithm in Antennas Placement. 2004EMC, Wuhan, China, 2004, 11(1):61-62.
[2] B. Ombuki, M. Nakamura, M. Osamu. A Hybrid Genetic Algorit-hm Simulated Annealing and Tabu Search for Vehicle Routing. Presented at the 6thIASTED International Conference on Artificial Intelligence and Soft Computing, PP.176-181, July 2002.
[3] J.I. Kwon, Lee J.J., Adaptive Simulated Annealing Genetic Algorithm for Control Applications International Journal of Systems Science, 1996, 27(2):241-253.