2016 3rd International Conference on Information and Communication Technology for Education (ICTE 2016) ISBN: 978-1-60595-372-4
1 INTRODUCTION
High-voltage electric power equipment of substations and transmission lines are often exposed in the air, running with the reduction of the equipment's own insulation performance, the surface contamination or the failure of itself. The corona discharge can be caused in such working conditions. The long-term corona discharge will cause serious damage to the insulation of the equipment, therefore detecting the location and intensity of the corona discharge timely and accurately can reduce personal injury and equipment damage, ensure the reliable operation of power system. The radiation spectrum of corona discharge contains ultraviolet (UV) light, visible and infrared spectral bands. Under normal circumstances, if the corona discharge showed obvious visible light, it means that equipment has been damaged or point discharge, but in sunlight environment the detecting of infrared spectrum section is very difficult ,the use of “solar blind” UV spectrum to detect the corona is the preferred method[1]. It will radiate out a large number of UV during the corona discharge. Hence UV imager is commonly used in power system to detect the state of external insulation of transmission and transformation equipment, additionally, it is a solution to assess the running status of the power equipment through the records analysis.
At present, the detection system of “solar blind” UV corona is usually just a way of qualitative detection and only can determine the location of the failure, but not the intensity. In this case, the operator can only evaluate the extent of damage of the power equipment based on subjective judgment according to the corona image. It means this method is not rigorous and objective, so it is difficult to obtain the real situation of the damage of power equipment accurately, it could lead to the misjudgment, result in unnecessary waste, even security risks. In addition, the method also needs the operator is skilled and with more experience. Obviously, if the intensity of corona image is measurable, then the damage of power equipment can be evaluated quantitatively, and provide more accurate and objective evaluation basis for the timely and effective maintenance to power equipment.
2 IMAGE DE-NOISING BASED ON THE MULTI-SCALE MORPHOLOGY FILTERING
Morphological filter is using a predefined structure elements for image de-noising, based on the geometrical characteristics of the target image. It is a problem how to select the suitable shape and size of structural elements according to target image[4].
The Study of Calibration Algorithm for the Detection of
Ultraviolet Corona
Limin Yin
Northeast Dianli University, Jilin City, China
Xingyue Yin, Xiangchao Kong
Jilin Province Electric Power Company Jilin Power Supply Company, Jilin City, China
ABSTRACT: After ultraviolet imaging, the image is low contrast and the target is weak. In this paper, an adaptive multi-scale morphological filtering method is adopted to image de-noising, the experimental result shows that the method can stretch image contrast and weaken noise. The algorithm is easy to deal in parallel and realized on hardware. Then the imaging target (Corona discharge) is extracted by image segmentation method based on region growing and discharge area is calculated. After that, it will be accurately demarcated when the condition of device need to be absolutely measured finally. “solar blind” ultraviolet image will be further processed according to temperature and humidity in order to remove the impact of corona discharge, and provide the precise calibration during the equipment is running.
2.1 The selection of structural elements
During the signal detection of the UV corona of “solar blind”, the MCP (Micro Channel Plate) (at least 40% magnification) is used to magnify (the magnification of 400% of the MCP is 106) the target in order to detect the existence of UV corona. The noise signal is also be amplified inevitably at the same time, it results in the contrast ratio and the signal-noise ratio of the UV image are lower. The image can be processed by mathematical morphology to remove the noise by selecting the appropriate structure elements.
There is no certain rule to select the structural element, but the complexity and size of the shape of the structural element have an important influence on the amount of calculation. So selecting the appropriate shape and size of the structural elements becomes the key point of the image processing
[8].
According to the characteristics of “solar blind” UV image of the corona, and the mass of contrast tests, it was proved that the most effective structural element is the disc type.
The selection of the size of the structure element should be determined according to the characteristics of Japanese standard. If the size of structural element elected is too small, it can’t filter out background noise effectively and the image quality can’t be obviously improved; On the contrary, if too large, it will cause some significant details loss of the image, even the target image could be filtered out [4].
It is discovered that the maximum noise point is smaller than discharge point. So the size of structural element should be between the maximum noise point and discharge point in order to achieve a better effect of de-nosing, but in reality, different discharge images have different discharge area, the size of the structural element should be determined according to the prior knowledge of the target image.
2.2 Algorithm implementation
Removing noise , enhancing and extracting discharge region are the main purpose of “solar blind” UV image processing, which is simpler than the normal visible light image process, the main feature of the UV image of the corona discharge is the shape description for the regional of corona discharge. The performance of morphological operator is mainly characterized by geometric method, which abandons the viewpoint of numerical modeling and analysis.
This explicit description of geometry makes it more suitable for the representation and analysis of the shape. Obviously, morphological filtering algorithm is very suitable for the image processing of the “solar blind” UV image.
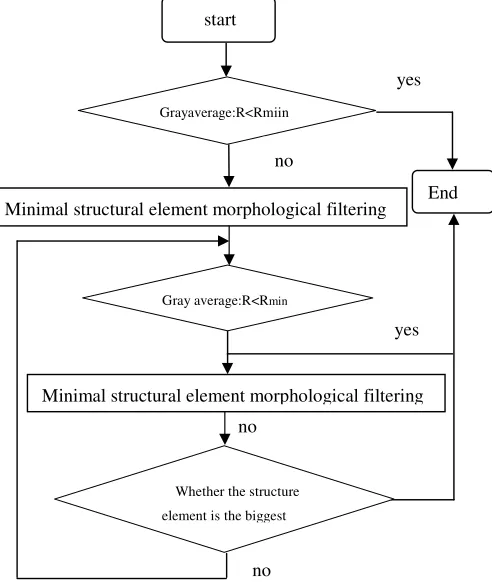
Figure 1. Program flow chart multiple structural element morphological filtering
According to the selected dual-spectrum UV detection system and the maximum area of corona amplification before the power equipment is damaged, and the radius of the selected disk shaped structural elements in this paper are 15, 14, 13, 12, 11, 10, 9, 8, 7, 6, 5, 4.The basic idea of the algorithm is to determine whether the image contains a corona discharge based on the value of image gray at first, if the image does not contain corona, the algorithms will be ended, on the contrary, we need to increase structural element constantly to do some scale morphological filtering to image, and the algorithm and program flow chart are as follows:
2.3 Experimental analysis
Figure 2 shows a corona “solar blind” UV image obtained by UV detection system. Figure 3 shows the image which is using of Wiener filtering to process, we can see from the image that the effect of de-noising effect is not very good, and there is a pseudo corona discharge area. Figure 4 shows the image of processed by homomorphic filtering, obviously, the effect de-noising is better. There is also a pseudo corona discharge area. Figure 5 shows the processed image that the method proposed by this paper, we can see from the image that the effect of de-noising is perfect, and it can extract the target area of corona discharge accurately.
Grayaverage:R<Rmiin
Minimal structural element morphological filtering
Whether the structure element is the biggest
End no
yes
yes
no Gray average:R<Rmin
Minimal structural element morphological filtering start
[image:2.612.311.557.23.314.2]Figure 2. Original image.
[image:3.612.115.236.417.510.2]Figure 3. Wiener filtering.
Figure 4. Homomorphic filtering.
Figure 5. The method of this paper.
The filter method based on the multi-criterion auto-adapted shape, can filter the different shape and size image noise. Firstly, the filter is judged start according to the average gray value, then the filter is judged to finish according to average gray value with auto-adapted structural elements selection. The simulation experiment proved this method is good to image de-noising effect, which can withdraw the corona discharge target sector accurately.
3 EXTRACTION OF THE TARGET CORONA DISCHARGE
3.1 Image segmentation algorithm based on region
growing
Image segmentation is the basic method and important part of image analysis and processing. In order to realize the detection and recognition of the target, we should firstly consider how to use the image segmentation algorithm to detect the area effectively. Currently, the frequently-used segmentation algorithm are mainly the threshold method, the regional transformation, the wavelet transform and the clustering method and so on [5].Combined with the characteristics of the actual collection of images, this paper provide an image segmentation algorithm based on region growing, which can accurately extract the effective detection area finally . The basic idea of region growing is to put together some pixels which have similar properties to constitute the region[6]. Choosing the appropriate growing point, and merging the same or similar pixels around the growth point to the region where the growing point is located according to the rule of growing point. Till the pixels met all the conditions which are all contained to the growing point region, the growing is completed.
The implementation of algorithm is as follows: (1) Searching the region of corona discharge, and compare with the sum of gray values that in a 100 * 100 region which is around each pixel, then we find the brightest region with the maximum of the gray value of the pixel point, the average gray value of the region is also need to be computed;
(2) Analyzing weather the gray value of the region is less than the predetermined initial value, if it is larger, the region is the corona discharge region, and then record the largest gray value pixel.
(3) Cyclic searching for all the pixels, recording maximum gray pixel of the discharge area, and setting it as the growth point.
(4) Calculating the average gray value which is around this pixel region in a 6*6 window, and expand this pixel window constantly, if the gray value is less than the segmentation threshold, the region is the growing region of the growing point, or the growing must be ended. Record the location of the growing region, and set it as the corona discharge region, and calculate the number of pixels.
After the region growing, we will reach the target of the extraction of corona discharge region of the UV image. And then calculating the pixel value of discharge region provides the basis for the determination of the intensity of corona discharge subsequently.
3.2 Experiment simulation
In this paper, we use the region growing method to process the corona image after de-noising, and the simulation results are shown in the following figure.
[image:4.612.118.239.90.318.2]
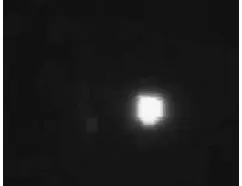
Figure 6. Image after de-noising.
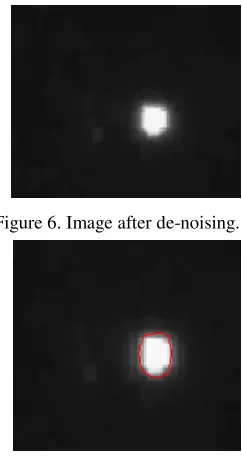
Figure7. Image segmentation.
Figure 6 is the corona discharge image after de-noising, then using the region growing method to it to extract after the discharge target segmented, the result is shown as figure 7, and extracting the bright goal of corona discharge, then calculating the number of pixels is 2000.
4 CALIBRATION OF CORONA DISCHARGE
4.1 Influencing factors of corona discharge
Corona discharge is resulted from the high electric field intensity on the surface of the conductor, and the high electric field intensity can cause discharge of the air ionization. The influencing factors of corona discharge of transmission lines can be divided into two categories:(1)Because of the influence of dust, impurities and industrial pollution on the surface of the wire, it is possible to form a local corona discharge power on the surface of the wire to increase the radiation field strength.(2)The influence of the external environment of the transmission line, the air pollution is more serious, the air density is the lower and the humidity is higher, then the corona discharge is stronger. Winter is dry, there is lesser dust and impurities on the surface of the wire, so the radiation level of corona discharge is relatively lower. Due to the change of seasons, the change of the radiation level of corona discharge is about 3-12 dB. 10% increased the humidity in the air when it is rain or snow, which can make the radiation field intensity of corona
discharge increase about 1.27 dB. When the rainfall is greater than 2mm / h, the radiation intensity of corona discharge is about 15~20 dB higher than that of sunny day. So we must consider the influence of these factors in the corona detection, only in this way we can ensure the correctness of the corona discharge calibration, and determine whether the corona discharge is in the scope which the power equipment is allowed [7].
4.2 Realization of the corona discharge calibration algorithm
In the process of corona discharge test, if we do not consider all kinds of factors that affect the intensity of corona discharge, it will produce some error. In order to reduce the error of corona calibration, in this paper, we mainly considers the influence of environmental factors on corona discharge, and to make corrosion calculation on different discharge regions of the image according to different weather conditions, structural element is in accordance with the different seasons of the weather, such as the summer rainy days are as half of each region of the discharge.
The spot corona discharge original map is obtained in Figure 2. The mentions de-noising and image division algorithm in this article which can calculate 2000 elements in corona discharge target sector. The corona discharge is quite strong. If the barometric pressure, temperature, humidity examined are forecasted standard condition at present, which will be examined and repaired. The present actual spot corona discharges region probably is 200-800 elements if the humidity is quite big and rainfall greater than 2 mm /h, which needn’t to over haul because insulation is in the permission scope.
5 CONCLUSION
Though experimental verification, it is proved that the adaptive multi-scale morphological filter and extraction method based on the corona target of region growing in this paper is very effective to the treatment of corona “solar blind” UV image, which can improve the signal-to-noise ratio of UV image, reduce the noise, extract the target the corona discharge region effectively, calibrate the corona discharge according to different seasons and weather conditions to reduce the detection error.
REFERENCES
[1] Sui XiaoJie ,Song ShouXin. Analysis of corona discharge in high voltage transmission lines [J].Power construction 2006.27. pp: 37- 38
[image:4.612.122.241.90.192.2]the UV imaging method [J]. electric power of Hebei, 2008, 27(3):26-28.
[3]Chen Hu, Zhou ChaoHui, Wang ShouZun. Research on image de-noising method based on mathematical morphology [J]. Journal of Engineering Graphics[J], 2004
(2).pp:116-119.
[4] Chen Ping, Li QingMin. Design and analysis of digital filter based on mathematical morphology[J]. Chinese Journal of Electrical Engineering, 2005, 25(11): 60-65.
[5] Zhang Ling, Guo LeiMin, He Wei.An image segmentation method based on maximum between class variance and region growing [J], Information and Electronic Engineering, 2005, 3(2):91-93,96.
[6] HeTangFei, HanChongZhao, Dai XunFeng. Integrated edge detection and infrared image segmentation of region growing[J], Opto electronic engineering, 2004, 31(10):50-52,68