University of Huddersfield Repository
Oluwajobi, Akinjide O. and Chen, Xun
The Effect of Depth of Cut on the Molecular Dynamics (MD) Simulation of MultiPass Nanometric
Machining
Original Citation
Oluwajobi, Akinjide O. and Chen, Xun (2011) The Effect of Depth of Cut on the Molecular
Dynamics (MD) Simulation of MultiPass Nanometric Machining. In: Proceedings of the 17th
International Conference on Automation & Computing, 10 September 2011. University of
Huddersfield, Huddersfield, UK. ISBN 9781862180987
This version is available at http://eprints.hud.ac.uk/id/eprint/11561/
The University Repository is a digital collection of the research output of the
University, available on Open Access. Copyright and Moral Rights for the items
on this site are retained by the individual author and/or other copyright owners.
Users may access full items free of charge; copies of full text items generally
can be reproduced, displayed or performed and given to third parties in any
format or medium for personal research or study, educational or notforprofit
purposes without prior permission or charge, provided:
•
The authors, title and full bibliographic details is credited in any copy;
•
A hyperlink and/or URL is included for the original metadata page; and
•
The content is not changed in any way.
For more information, including our policy and submission procedure, please
contact the Repository Team at: [email protected].
The Effect of Depth of Cut on the Molecular
Dynamics (MD) Simulation of Multi-Pass
Nanometric Machining
A.O. Oluwajobi1 and X. Chen2
Centre for Precision Technologies University of Huddersfield Queensgate, Huddersfield HD1 3DH, UK 1
[email protected], [email protected]
Abstract— The effect of depth of cut on multi-pass nanometric machining of copper workpiece with diamond tool was studied using the Molecular Dynamics (MD) simulation. The copper-copper interactions were modelled by the EAM potential and the copper-diamond interactions were modelled by the Morse potential. The diamond tool was modelled as a deformable body and the Tersoff potential was applied for the carbon-carbon interactions. It was observed that the average tangential and normal components of the cutting forces increase with increase in depth of cut and they reduced in consecutive cutting passes for each depth of cut. Also, the ratio of the tangential to normal force components decreases as the depth of cut increases, but remains fairly constant after 1.5nm depth of cut. The ratio of the cutting force to area decreases with increase in the depth of cut and remains constant after 2.5nm depth of cut.
Keywords- Multi-Pass; Depth of Cut, Molecular
Dynamics; Nanometric Machining, Cutting Forces
I. INTRODUCTION
.
Current material removal technological requirements in the aerospace, automobile, medical and energy industries are at the nanoscale, with stringent form and surface finish accuracy. At this length scale, machining phenomena take place in a small limited region of tool – workpiece interface, which often contains a few atoms or layers of atoms. At present, it is very difficult to observe the diverse microscopic physical phenomena occurring through experiments at the nanoscale [1]. The interface at this nanometre level may not be considered as a continuous media or homogeneous as assumed by continuum mechanics, so the analysis should be based on discrete atoms, whose interactions are governed by appropriate interatomic potentials. The use of Molecular Dynamics (MD) simulation has proved to be an effective tool for the investigation of machining processes at the nanometre scale. The method gives higher resolution of the cutting process than what is possible by continuum mechanics on that length scale [2].
The MD method was initiated in the late 1950s at Lawrence Radiation Laboratory in the US by Alder and Wainwright in the study of statistical mechanics [3].
Since then, the use of the simulation method has extended from Physics to Materials Science and now to Mechanical Engineering. Rentsch and Inasaki [4] modelled a copper workpiece and a diamond tool using the Lennard-Jones potential for the copper atom interactions. They observed a build-up phenomenon after 25000 time steps, while keeping the tool rigid. Komanduri et al [5] used copper workpiece and an infinitely hard tungsten tool for their simulation. They used Morse potentials and a cutting speed of 500m/s.
Many existing MD simulation studies on nanometric cutting have been limited to single pass or simple line-type groove. As an extension of the single pass studies, Zhang et al [6] modelled folder- line grooves for AFM-based nanometric cutting process of copper workpiece with diamond tool. They used the EAM potential for the copper-copper interactions and the Morse potential for the copper-diamond interactions. They treated the diamond tool as rigid and concluded that the normal, lateral and the resultant forces were almost symmetric with respect to the critical folder angle of 45. Shi et al [7] investigated the multi-groove simulation of single-point tuning of copper workpiece with diamond tool. They used two diamond tools, offset by a fixed distance to simulate a two-groove cutting and modelled the copper-copper and the copper-diamond interactions by using the Morse potential. They also treated the tool as a rigid body and observed that the tool forces increase with increase in feed rate and depth of cut. In practice, most machining processes involve the use of multiple passes to create new surface patterns and the diamond tool is deformable and subjected to wear. This study clearly shows the consecutive passes of cut, which is novel in multi-pass nanometric machining MD simulations. Also, the effect of the variation of depth of cut on the simulation of multi-pass cutting was investigated to model the surface creation in single point diamond turning.
II. THE MD METHODOLOGY
The nanometric cutting model consists of a monocrystalline copper workpiece and a diamond tool. Proceedings of the 17th International Conference on
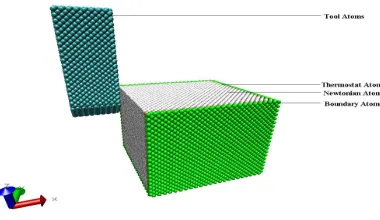
The model configuration has a total of 54232 atoms as shown in Fig. 1. The workpiece is made up of 43240 copper atoms, with the face-centred cubic (FCC) lattice. It includes 3 kinds of atoms namely; boundary atoms, Newtonian atoms and thermostat atoms (See Fig. 1). The cutting tool has 10992 carbon atoms with diamond lattice structure. Fig. 2a shows a diagram of the machined grooves with passes 1 - 3 and Fig. 2b shows the tool tip dimensions, with the upper part as variable, which depends on the depth of cut considered.
Figure 1: The MD Simulation Model
The end of the cutting tool is trapezoidal shaped (fairly pointed, with a blunt end). For the workpiece, the boundary atoms are kept fixed to reduce edge effects.
Pass 1 Pass 2 Pass 3
Depth of Cut D Depth of Cut
(a) Feed
2 Variable
10.73angs
2.65angs (b)
Figure 2a: Cross Section of the Machined Grooves with Passes 1-3 (direction of cut is perpendicular to the paper face) 2b: Tool Tip Dimensions
The Newtonian atoms obey the Newton’s equation of motion. The thermostat atoms conduct the heat generated during the cutting process out of the cutting region. This is achieved by the velocity scaling of the thermostat atoms, (with the conversion between the kinetic energy (KE) and temperature via Eq. 1 [8, 9]);
i B i
i i
T
Nk
v
m
2
3
2
1
2
(1)Where
m
iis the mass of the ith atom,v
iis the resultantvelocity of the ith atom,
N
is the number of the thermostat atoms,T
iis the temperature of the ith atomand
k
Bis the Boltzmann constant (1.3806504 x10⁻²³ JK-1)Whenever the temperature of the thermostat atoms exceeds the preset bulk temperature of 293K, their velocities are scaled by using Eq. 2 [10, 11];
current desired i
new i
T
T
v
v
,
(2)Where
v
i,new is the newly scaled velocity of atom i, iv
is the velocity of atom i,T
current is the current temperature that is calculated from the KE and thedesired
T
is the desired temperature.The simulation conditions applied in this study are the following, viz; bulk temperature is 293K, the cutting direction is along the x-axis, the cutting speed is 150m/s, the feed is 1.5nm, the time step is 0.3fs and the simulation run is 150000 steps. The depths of cut used are 0.5nm, 1.0nm, 1.5nm, 2nm, 2.5nm and 3 nm. The LAMMPS parallel MD software [12] was used for the simulations, on the University of Huddersfield’s High Performance Computing (HPC) grid, with a total of 144 processing cores (36 nodes) and a RAM of 8 GB (800Mhz) per node. The MD software utilized 2 nodes and 4 processors for each simulation. The VMD software [13] was used for the visualization of the results.
III. THE MODELLING PARAMETERS FOR THE
SIMULATION
It has been previously established that the EAM potential is very suitable for the Cu-Cu interactions [14], [15] and for the Cu-C interactions; the Morse potential is a good choice [16].
A. Embedded-Atom Method Potential (EAM) (Eq. 3)
[17] (For the Cu-Cu interactions)
j i
ij ij i
i h i
tot G V r
E
,
, ( )
2 1 )
( (3)
Where
E
totis the total embedding energy,
h,i is the total electron density at atom i due to the rest of the atoms in the system,G
i is the embedding energy for placing an [image:3.595.54.286.377.564.2]B. Morse Potential (Eq. 4) [18] (For the Cu-C interactions)
]} ( exp[ 2 )] ( 2
{exp[ ij e ij e
ij D r r r r
V (4) Where
V
ij is the pair potential,r
ijandr
e areinstantaneous and equilibrium distances between atoms i and j respectively,
and D are constants determined on the basis of the physical properties of the material.The parameters used in the simulations are below, [19];
The cut-off distance chosen was 6.4 Angstroms (that is, the interactions between atoms separated by more than this distance are neglected).
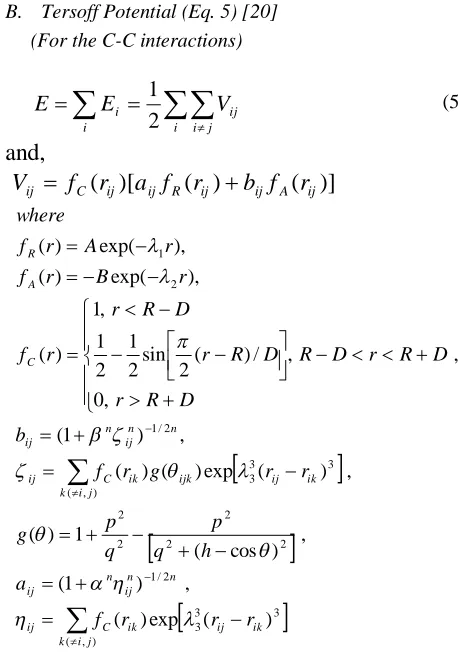
B. Tersoff Potential (Eq. 5) [20]
(For the C-C interactions)
i i i j
ij i V E E 2 1 (5)
and,
)]
(
)
(
)[
(
ij ij R ij ij A ijC
ij
f
r
a
f
r
b
f
r
V
) , ( 3 3 3 2 / 1 2 2 2 2 2 ) , ( 3 3 3 2 / 1 2 1 ) ( exp ) ( , ) 1 ( , ) cos ( 1 ) ( , ) ( exp ) ( ) ( , ) 1 ( , , 0 , / ) ( 2 sin 2 1 2 1 , 1 ) ( ), exp( ) ( ), exp( ) ( j i k ik ij ik C ij n n ij n ij j i k ik ij ijk ik C ij n n ij n ij C A R r r r f a h q p q p g r r g r f b D R r D R r D R D R r D R r r f r B r f r A r f where Where
E
,
E
iare the energies of interacting atoms,V
ij is the pair potential, R and D are cut-off parameters;h
q
p
n
B
A
,
,
1,
2,
3,
,
,
,
,
,
are fitting parameters of the Tersoff potential. [image:4.595.54.283.277.605.2]The simulation parameters used for carbon, are given as [20, 21, 22];
A(eV) = 3
10 3936 .
1 ; B(eV) = 2
10 467 .
3 ;
)
( 1
1
nm
= 34.879;
2(
nm
1)
= 22.119;
= 0.0;
=1.5724107; n =7.2751101; p = 4 10 8049 .3 ;
q = 4.384; h = 1
10 7058 . 5 ;
)
(
1 3 nm
= 22.119; R (nm) = 0.18; D(nm) = 0.02.(
F
x,
F
y,
F
z : are the tangential, lateral and normal components of the cutting forces respectively (eV/Angs = 1.602×10⁻⁹N)).It should be noted that, generally, the interatomic potential parameters used for MD simulations are verified by ascertaining good agreement between their predicted values of the material properties and experimental data.
IV. SIMULATION RESULTS
Figure 3: Simulation of Depth of Cut 0.5nm – Pass 3
Figure 4: Simulation of Depth of Cut 1.5nm – Pass 3
Figure 5: Simulation of Depth of Cut 3nm – Pass 1
nm r
nm eV
D 0.087 , 0.17( ) , e 0.22 1
Figure 6: Simulation of Depth of Cut 3nm – Pass 2
Figure 7: Simulation of Depth of Cut 3nm – Pass 3
Cutting Forces for Depth of Cut 3nm - Pass1
-1.50E+02 -1.00E+02 -5.00E+01 0.00E+00 5.00E+01 1.00E+02 1.50E+02 2.00E+02 2.50E+02
0 20000 40000 60000 80000 100000 120000 140000 160000
No of Ste ps
C
u
tt
in
g
F
o
rc
e
s
(
e
V
/A
)
[image:5.595.309.536.259.417.2]Fx Fy Fz
Figure 8: Cutting Forces for Depth of Cut 3nm – Pass 1
Cutting Forces for Depth of Cut 3nm - Pass2
-1.50E+02 -1.00E+02 -5.00E+01 0.00E+00 5.00E+01 1.00E+02 1.50E+02 2.00E+02
0 20000 40000 60000 80000 100000 120000 140000 160000
No of Ste ps
C
u
tt
in
g
F
o
rc
e
s
(
e
V
/A
)
Fx Fy Fz
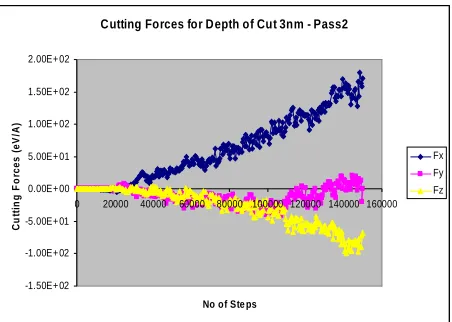
Figure 9: Cutting Forces for Depth of Cut 3nm – Pass 2
Cutting Forces for Depth of Cut 3nm - Pass3
-1.50E+02 -1.00E+02 -5.00E+01 0.00E+00 5.00E+01 1.00E+02 1.50E+02 2.00E+02 2.50E+02
0 20000 40000 60000 80000 100000 120000 140000 160000
No of Steps
C
u
tt
in
g
F
o
rc
e
s
(
e
V
/A
)
Fx Fy Fz
Figure 10: Cutting Forces for Depth of Cut 3nm – Pass 3
Tangential Cutting Force Components for Passes 1-3
0 10 20 30 40 50 60 70 80 90 100
0 5 10 15 20 25 30 35
Depth of Cut (Angs)
T
a
n
g
e
n
ti
a
l
C
u
tt
in
g
F
o
rc
e
s
(
e
V
/A
)
[image:5.595.307.539.446.617.2]Fx_Pas s 1 Fx_Pas s 2 Fx_Pas s 3
Figure 11: Variation of Fx in Passes 1-3 with Depth of Cut
V. RESULTS AND DISCUSSION
[image:5.595.59.288.522.673.2]Lateral Cutting Force Components for Passes 1-3
-15 -10 -5 0 5 10 15
0 5 10 15 20 25 30 35
Depth of Cut (Angs)
L
a
te
ra
l
C
u
tt
in
g
F
o
rc
e
s
(
e
V
/A
)
[image:6.595.66.281.84.387.2]Fy_Pass1 Fy_Pass2 Fy_Pass3
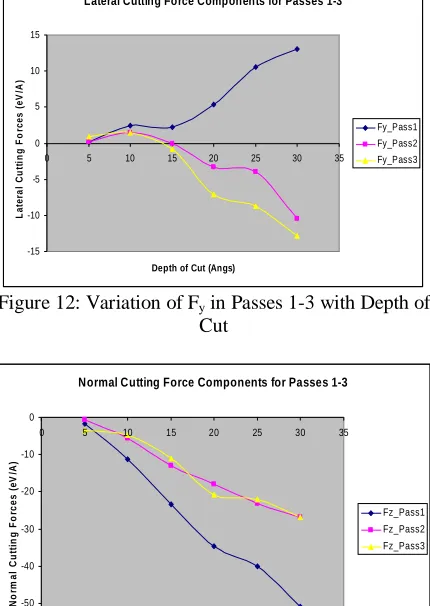
Figure 12: Variation of Fy in Passes 1-3 with Depth of Cut
Normal Cutting Force Components for Passes 1-3
-60 -50 -40 -30 -20 -10 0
0 5 10 15 20 25 30 35
Depth of Cut (Angs)
N
o
rm
a
l
C
u
tt
in
g
F
o
rc
e
s
(
e
V
/A
)
Fz_Pass1 Fz_Pass2 Fz_Pass3
Figure 13: Variation of Fz in Passes 1-3 with Depth of Cut
Ratio of Tangential to Normal Force Components
0 1 2 3 4 5 6 7 8 9 10
0 5 10 15 20 25 30 35
Depth of Cut (Angs)
F
x
/F
z Fx/Fz_Pas s1
[image:6.595.309.540.178.339.2]Fx/Fz_Pas s2 Fx/Fz_Pas s3
Figure 14: Variation of Fx/Fz in Passes 1-3 with Depth of Cut
Figs. 5-7 show the simulation of the three consecutive passes for the depth of cut of 3nm and Figs. 8-10 show the associated cutting forces respectively. The average tangential and the normal cutting force components decrease with the consecutive passes. Figs. 11-13 show the variation of the cutting force components, (Fx, Fy and Fz) with depth of cut, for passes 1-3. It can be seen that for the different passes, both Fx and Fz increase in magnitude with increase in the depth of cut. The average values of Fx and Fz are larger in pass 1 than in passes 2
and 3. Also, the values for passes 2 and 3 are quite close. This is because the cutting cross sectional area for passes 2 and 3 are similar. The variation of Fy is considerably smaller than both Fx and Fz, and it should be zero theoretically. The small variation is due to the atomic vibration during the cutting process. For pass 1, Fy is positive and becomes negative for passes 2 and 3 after the depth of cut of 1.5nm.
Stress Evaluation (Fx/A) for Passes 1-3
0 2E+10 4E+10 6E+10 8E+10 1E+11 1.2E+11 1.4E+11 1.6E+11 1.8E+11
0 5 10 15 20 25 30 35
De pth of Cut (Angs)
T
a
n
g
e
n
ti
a
l
F
o
rc
e
p
e
r
Un
it
A
re
a
F
x
/A
(N
/m
^
2
) Fx /A -Pas s 1
Fx /A -Pas s 2 Fx /A -Pas s 3
Figure 15: Stress Variation with Depth of Cut for Passes 1-3
The change from positive to negative is because for passes 2 and 3, the structure of the workpiece to be cut becomes asymmetrical and skewed to the right. Fig. 14 shows the ratio Fx/Fz, which is a measure of friction for the different passes. It can be seen that this ratio is fairly constant after the depth of cut of 1.5nm, which might be due to the tool geometry. Fig. 15 shows the stress variation with depth of cut for the three passes. It can be observed that as the depth of cut increases, the stress values decrease and it is higher for passes 2 and 3. The stress values are in the range from 160GPa to 20GPa. The values remain constant at around 20 GPa for all passes for higher depth of cut – from 2.5nm. This is due to the tool geometry, which becomes similar for higher depths of cut. The highest stress values are for depth of cut of 0.5nm during passes 2 and 3. It shows that the cutting resistance of the copper material is highest at very small depth cuts.
VI. CONCLUSION
[image:6.595.61.284.456.625.2]REFERENCES
[1] Rentsch, R., “Nanoscale cutting”, in Davim, J.P.
and Jackson, M.J. (Eds.): Nano and
Micromachining, Wiley-ISTE, 2008, pp. 1–24
[2] Komanduri R. and L.M. Raff, “A Review on the
Molecular Dynamics Simulation of Machining at the Atomic Scale”, Proceedings of the Institution of Mechanical Engineers, Part B: Journal of Engineering Manufacture, Vol. 215, No. 12, 2001, pp. 1639-1672
[3] Alder B.J.and T.E. Wainwright, “Studies in Molecular Dynamics. I. General Method”, Journal of Chemical Physics, Vol 31, 1959, pp. 459-466
[4] Rentsch R. and I. Inasaki, “Molecular Dynamics Simulation for Abrasive Processes”, Annals of the CIRP Vol. 43, No 1, 1994, pp. 327-330
[5] Komanduri R., N. Chandrasekaran and L.M.
Raff, “Some Aspects of Machining with Negative-Rake Tools Simulating Grinding: A Molecular Dynamics Simulation Approach”, Philosophical Magazine Part B, Vol. 79, No 7, 1999, pp. 955-968
[6] Zhang J.T. , T. Sun, Y. Yan, Y. Liang and S. Dong, “Molecular Dynamics Study of Groove
Fabrication Process using AFM-Based
Nanometric Cutting Technique”, Applied
Physics A (Materials Science and Processing), Vol. 94, 2009, pp. 593-600
[7] Shi J., Y. Shi and C.R. Liu, “Evaluation of a Three-Dimensional Single-Point Turning at Atomistic Level by a Molecular Dynamics Simulation”, International Journal of Advanced Manufacturing Technology, Vol. 45, Nos 1-4, 2011, pp. 161-171
[8] Cai M., X. Li and M. Rahman, “Molecular
Dynamics Modelling and Simulation of
Nanoscale Ductile Cutting of Silicon“,
International Journal of Computer Applications in Technology, Vol. 28, No. 1, 2007, pp 2-8 [9] Guo Y., Y. Liang, M. Chen, Q. Bai and L. Lu,
“Molecular Dynamics Simulations of Thermal Effects in Nanometric Cutting Process“, Science China Technological Sciences, Vol. 53, No. 3, 2010, pp. 870-874
[10]Cheong W.C.D., L. Zhang and H. Tanaka,
“Some Essentials of Simulating Nano-Surface Processes using the Molecular Dynamics Method “, Key Engineering Materials, Vol. 196, 2001, pp. 31-42
[11]Lin Z.-C. Z.-D. Chen and J.-C. Huang,
“Establishment of a Cutting Force Model and Study of the Stress-Strain Distribution in Nano-scale Copper Material Orthogonal Cutting“,
International Journal of Advanced
Manufacturing Technology, Vol. 33, No. 5-6 2007, pp. 425-435
[12]Plimpton S. J., “Fast Parallel Algorithms for Short-Range Molecular Dynamics”, J Comp
Phys, Vol. 117, 1995, pp. 1-19 and
www.lammps.sandia.gov
[13]Visual Molecular Dynamics (VMD),
http://www.ks.uiuc.edu/Research/vmd/ (Accessed in 2010)
[14]Oluwajobi A.O. and X. Chen, “The Effect of Interatomic Potentials on Nanometric Abrasive
Machining”, Proceedings of the 16th
International Conference on Automation and Computing, 2010, pp. 130-135
[15]Oluwajobi A.O. and X. Chen, “The
Fundamentals of Modelling Abrasive Machining Using Molecular Dynamics”, International Journal of Abrasive Technology, Vol. 3, No. 4. 2010, pp. 354-381
[16]Pei Q.X., C. Lu, F.Z. Fang and H. Wu, ‘Nanometric Cutting of Copper: A Molecular Dynamics Study’, Comp.Mat. Sci., Vol. 37, 2006, pp. 434-441
[17]Foiles S.M., “Application of the Embedded Atom Method to Liquid Transition Metals”, Physical Review B, Vol. 32 No 6, 1985, pp. 3409-3415
[18]Morse P.M., “Diatomic Molecules according to Wave Mechanics II Vibrational Levels”, Physical Review Vol. 34, 1929, pp. 57-64
[19]Hwang H.J., O-K Kwon and J. W. Kang,
“Copper Nanocluster Diffusion in Carbon Nanotube”, Solid St. Comm. 129, 2004, pp. 687-690
[20]Tersoff J., “Empirical Interatomic Potential for Silicon with Improved Elastic Properties”, Physical Review B, Vol. 38 No 14, 1988, pp. 9902-9905
[21]Raffi-Tabar H. and G.A. Mansoori, “Interatomic Potential Models for Nanostructures“, in
Encyclopedia of Nanoscience and
Nanotechnology, ed. H.S. Nalwa, American Scientific Publishers, Vol X, 2003, pp. 1-17 [22]Saito Y., N. Sasaki, H. Moriya, A. Kagatsume
and S. Noro, “Parameter Optimization of Tersoff
Interatomic Potentials Using Genetic