Utilization of Cheese Whey for Bio-ethanol Production
Abdel-Naser A. Zohri
1, Nanis H. Gomah
2,*, Maysa A. Ali
11Department of Botany & Microbiology, Faculty of Science, Assiut University, Egypt 2Department of Dairy Science, Faculty of Agriculture, Assiut University, Egypt
*Corresponding Author: nanis2000eg@yahoo.com
Copyright © 2014 Horizon Research Publishing All rights reserved.
Abstract
This study was aimed to investigate the feasibility of bio- ethanol production by batch fermentation of kareish cheese whey. Two forms of whey; untreated (crude) whey containing 5% lactose and treated whey (deproteinized and concentrated to 14% lactose) were utilized. Fermentation processes were performed by two strains of Kluyveromyces marxianus and four strains ofSaccharomyces cerevisiae which were previously
recognized as ethanol- producing strains. Effects of different initial pH values, as well as, external supplementation of treated whey by four different nitrogen sources on the rate of ethanol production by two of the highest producing strains were also investigated. All the studied yeast strains were able to grow and produce ethanol from both crude and treated whey. Levels of ethanol production ranged between 3.4- 18.5g/l and 24.11-57.66 g/l from crude and treated whey, respectively. The most suitable initial pH maximizing ethanol yield was 5.5 and the best added nitrogen source was yeast extract. Maximum ethanol levels produced by K. marxianus ZMS3GU133329 and S.cerevisiae EC1118 from treated whey adjusted to pH 5.5 and supplemented by 0.3% yeast extract reached to 69.85 and 65.36 g/L, corresponding to 97.8 and 91.4% of the theoretical values, respectively. The kinetic parameters and productivity were calculated and discussed for all experiments.
Keywords
Cheese Whey , Ethanol Production ,Kluyveromyces Marxianus , S.cerevisiae
1. Introduction
Cheese whey is the main by-product formed during the coagulation of milk casein in cheese making. Whey is produced in large amounts and has a high polluting load, therefore representing a significant environmental problem. On the other hand, whey retains much of the milk nutrients, including functional proteins and peptides, lipids, lactose, minerals and vitamins, challenging the industry to face whey surplus as a resource and not only as a waste problem. Cheese whey is byproduct represents about 85-95% of the milk volume and retains 55% of milk nutrients. Among the
most abundant of these nutrients are lactose, soluble proteins, lipids, mineral salts and B group vitamins (1, 2, 3).
About 50% of the total world cheese-whey production is now treated and transformed into various food products such as direct utilization as drinking waters for farm animals and as an agricultural fertilizer, using of powdered cheese whey for animal feeding, in smaller quantities, it might be used in human foods (ice creams, baked goods, cakes, sauces, milky derivatives, and so on), as lactose and delactosed by-products, and the rest as cheese whey-protein concentrates (3). In Egypt, whey from the manufacture of cheese represents a commercial effluent produced in such massive quantities, whose disposal is a major problem from many municipal sewage treatment plants. Almost, all of the cheese whey in Egypt goes out as west. (4)
The fermentation of whey lactose into ethanol particularly using yeast, has been frequently referred in the literature, since at least the 1940s. Although the yeasts that assimilate lactose aerobically are widespread, those that ferment lactose are rather rare (5), including Kluyveromyces lactis, K. marixianus, and Candida pseudotropicalis. Therefore, alternative uses are being sought, with most of them based on the direct fermentation of lactose or fermentation of glucose and galactose obtained by hydrolysis of lactose (6, 7, 8).
steadily increasing around the world for a number of reasons. Domestic production and use of ethanol for fuel can decrease dependence on foreign oil, reduce trade deficits, create jobs in rural areas, reduce air pollution and reduce global climate change carbon dioxide buildup (13). Also, Ethanol considered both renewable and environmentally friendly, is believed to be one of the best alternatives, leading to a dramatic increase in its production capacity. It is nowadays an important product in the fuel market. Its market grew from less than a billion liters in 1975 to more than 39 billion liters in 2006 and is expected to reach 100 billion liters in 2015 (14).
2. Materials and Methods
Yeast Strains and Inoculum Preparation
Six yeast strains were used; two of them are
Kluyveromyces marixianus ZMS1-GU133331 and K.
marixianus ZMS3-GU133329 previously recorded in our laboratory as highly ethanol producers (15). Three brewing strains namely Saccharomyces cerevisiae EC1118, S. cerevisiae CY3079 and S. cerevisiae GHM were kindly provided by Prof. S. Schubert, Institute of Plant Nutrition, Leibig University, Giessen, Germany. The sixth yeast strain is a baker's yeast (S. cerevisiae) produced by Egyptian Sugar and Integrated Industries Company, Egypt. Inoculum were prepared by transferring one loop full of 48 hours culture grown on a slant of YMPGA medium to 250 ml Erlenmeyer flask containing 50 ml sterilized YMPG broth. After incubation on a rotary shaker (150 rpm) at 30ºC for 48 hours, the inoculum was transferred at the rate of 10% or 20% to fermentation medium. The initial concentration of inoculum was adjusted at 2×10⁷ CFU/ml.
Cheese whey
Crude kareish cheese whey was obtained from dairy products Laboratory, Dairy Department, Faculty of agriculture, Assiut University, Egypt.The chemical composition of this whey was as flow: lactose, 5%; NaCl, 3%; protein, 0.65% and fat, 0.03. Treated Cheese Whey was prepared as described by (17) on three steps:
(1) Deproteinization by heating to 90ºC followed by filtration for removing the coagulated protein.
(2) Reconcentration for increasing the reducing sugars content to 14% by heating the previous filtrate at 100 ºC.
(3) Centrifugation at 5000 rpm for 10 min for removing all solid materials.
Ethanol production from crude and treated cheese whey
The six selected yeast strains were examined for their ability to produce ethanol from crude and treated cheese whey. The fermentation process was conducted in 100 ml glass bottles containing 45 ml of crude or treated cheese whey adjusted to pH 4.5 and inoculated with 5 ml yeast cells suspension (2×10⁷ cells/ml). The cultures were incubated on
a rotary shaker (150 rpm) at 35ºC for 5 hours under aerobic condition and complete the fermentation period (72 hours) under anaerobic condition. The fermentation processes were carried out in triplicate and the analytical data represent the average ± standard deviation.
Effect of different pH values on ethanol production from treated whey
In order to maximize ethanol production by the best two studied yeast strains (Kluyveromyces marixianus
ZMS1-GU133329 and Saccharomyces cerevisiae EC1118), Treated whey samples were adjusted to different initial pH values (4.0, 5.0, 5.5 and 6.5). Fermentation process was conducted as previously mentioned.
Effect of different nutritional supplements on ethanol production
Four different nutritional supplements namely, yeast extract, malt extract, (NH4)2SO4, and KH2PO3 were added individually to treated whey at concentration of 3 g / l to investigate their effect on ethanol production by
Kluyveromyces marixianus ZMS1-GU133329 and
Saccharomyces cerevisiae EC1118. Fermentation process was conducted at the optimum temperature and PH values as previously described.
Detection of ethanol
Ethanol content was estimated by bi-chromate method as described by (18).Volumetric ethanol productivity (V. E. P. g / l / h) and ethanol yield from theoretical value (YE of TH) were calculated according to (19). Fermentation efficiency (F. Eff. %) is expressed as g sugar utilized /100 g initial sugar according to (20). Other fermentation kinetics parameters such as ethanol concentration over the consumed sugar [Y E/CS (g / g)] and ethanol concentration over the initial sugar [Y E/IS ( g / g] were calculated according to (21).
Determination of sugar
Initial and residual sugar concentrations were determined by 3, 5 - dinitrosalicylic acid (DNS) method according to (22).
Determination of pH value
pH values were measured by Microprocessor pH-mv meter pH 526.
3. Results and Discussion
Ethanol production from crude (non-treated) and treated cheese whey
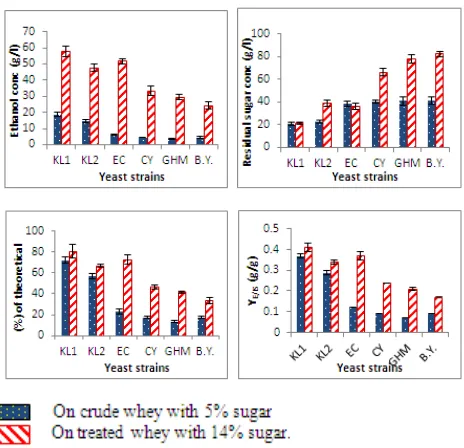
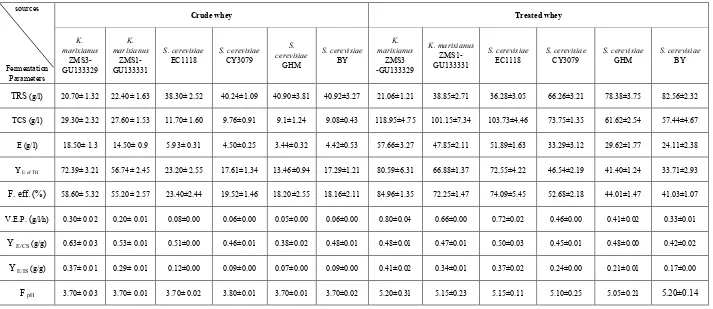
Results recorded in table (1) and illustrated in figure (1). showed that, all the six yeast strains were able to grow and produce ethanol from crude and treated cheese whey. In case of crude cheese whey, ethanol concentrations by K.
ZMS1-GU133331 were 18.50 and 14.50 g/l (equal to 72.39 and 56.74% of the theoretical value, respectively). While ethanol levels formed by of S. cerevisiae EC1118, S. cerevisiae CY3079, S. cerevisiae GHM and S. cerevisiae BY reached to 5.93, 4.50, 3.44 and 4.42 g/l (equal to 23.20, 17.61, 13.46 and 17.29% of the theoretical value, respectively) which were very low comparing to the ethanol concentrations produced by the two strains of K. marixianus. Fermentation efficiencies of K. marixianus
ZMS3-GU133329 and K. Marixianus ZMS1-GU133331 were 58.60 and 55.20%, respectively, while for S. cerevisiae
EC1118, S. cerevisiae CY3079, S. cerevisiae GHM and S. cerevisiae BY, were 23.40, 19.52, 18.20 and 18.16%, respectively. The volumetric productivities of ethanol during the fermentation period (72h) ranged from 0.05 to 0.30 g/l/h by all the six yeast strain under study. Ethanol yield over the consumed sugar YE/CS ranged from 0.38 to 0.63 g/g while ethanol yields over the initial sugar YE/IS ranged from 0.07 to 0.37 g/g for all the six yeast strains. PH value decreased from the initial pH 5 to 3.7 or 3.8 at the end of fermentation period.
[image:3.595.61.293.321.545.2]
Figure 1. Ethanol concentration (g/l), residual sugar concentration (g/l), % of ethanol from theoretical value (%) and Y E/IS (g/g) during batch
fermentation of cheese whey at 35oC and pH 5 for 72 hours by the six yeast
strains
On the other hand, data in table (1) obviously showed that fermentation of treated whey containing 14% sugar resulted in so much higher ethanol production than crude whey by all the studied yeast strains. Maximum ethanol level (57.66 g/l, equal to 80.59% of the theoretical value) was obtained by K. marixianus ZMS3-GU133329. Saccharomyces cerevisiae
EC1118 comes as the second highly ethanol producing strain (51.89 g/l, equal to 72.55% of the theoretical value). It was followed by K. marixianus ZMS1-GU133331, S. cerevisiae
CY3079, S.cerevisiae GHM and S. cerevisiae BY which produced 47.85, 33.29, 29.62 and 24.11 g/l (equal to 66.88, 46.54, 41.40 and 33.71% of the theoretical value, respectively). The amount of unconsumed sugar ranged from 21.06 to 82.56 g/l at the end of fermentation period.
Fermentation efficiencies of K. marixianus
ZMS3-GU133329, S. cerevisiae EC1118, K. marixianus
ZMS1-GU133331, S. cerevisiae CY3079, S. cerevisiae
GHM and S. cerevisiae BY were 84.96, 74.09, 72.25, 52.68, 44.01 and 41.03%, respectively. Ethanol volumetric productivities for all the six yeast strains were fluctuated between 0.33 and 0.80 g/l/h. YE/CS values were ranged from 0.42 to 0.48 g/g while YE/IS values were ranged from 0.17 to 0.41 g/g for all the tested yeast strains. The final pH of the fermentation media didn't alter and ranged from 5.05 to 5.2, which was almost comparable with the initial pH.
These data revealed that all the six yeast strains under study were able to grow and produce ethanol on crude and treated cheese whey. Levels of ethanol production were varied and ranged between 3.4 – 18.5 g/l and 24.11 – 57.66 g/l from crude and treated whey, respectively. The low ethanol yield obtained from crude whey was also observed by (24). They fermented crude whey by K. marixianus
KD-15 and demonstrated that the fermentation of lactose in crude whey is ineffective from an economic viewpoint on account of the high dilution and low concentration of ethanol achieved, requiring high energy inputs for distillation. Also, (7) reported that the production cost of ethanol was improved when the concentration of lactose increases from 100 to 120 g / l (10 – 12%)
.
The obtained results also indicated that K. marixianus
ZMS3-GU133329 was superior as ethanol producer from both crude and treated cheese whey. This might be explained by its ability to metabolize lactose, owing to the presence of a lactose permease and β-galactosidase (25). Saccharomyces cerevisiae EC1118 comes as a second highly ethanol producing strain from treated whey. It is expected that heat treatment used for water evaporation may lead to decomposition of lactose into glucose and galactose. (26) suggested that pre-hydrolysis of whey lactose into mixture of glucose and galactose would allow fermentation by highly fermentative strains of S. cerevisiae.
Since K. marixianus ZMS3-GU133329 and S. cerevisiae
Table 1. Fermentation kinetics of bio-ethanol production from crude (5% sugar) and treated cheese whey (14% sugar) by different highly ethanol producers yeast strains in batch cultures at pH 5 & 35oC for 72 hours.
sources
Fermentation Parameters
Crude whey Treated whey
K. marixianus
ZMS3- GU133329
K. marixianus
ZMS1- GU133331
S. cerevisiae
EC1118 S. cerevisiae CY3079
S. cerevisiae
GHM
S. cerevisiae
BY
K. marixianus
ZMS3 -GU133329
K. marixianus
ZMS1- GU133331
S. cerevisiae
EC1118 S. cerevisiae CY3079 S. cerevisiae GHM S. cerevisiae BY
TRS (g/l) 20.70± 1.32 22.40± 1.63 38.30± 2.52 40.24±1.09 40.90±3.81 40.92±3.27 21.06±1.21 38.85±2.71 36.28±3.05 66.26±3.21 78.38±3.75 82.56±2.32
TCS (g/l) 29.30± 2.32 27.60± 1.53 11.70± 1.60 9.76±0.91 9.1±1.24 9.08±0.43 118.95±4.75 101.15±7.34 103.73±4.46 73.75±1.35 61.62±2.54 57.44±4.67
E (g/l) 18.50± 1.3 14.50± 0.9 5.93± 0.31 4.50±0.25 3.44±0.32 4.42±0.53 57.66±3.27 47.85±2.11 51.89±1.63 33.29±3.12 29.62±1.77 24.11±2.38
Y E of TH 72.39± 3.21 56.74± 2.45 23.20± 2.55 17.61±1.34 13.46±0.94 17.29±1.21 80.59±6.31 66.88±1.37 72.55±4.22 46.54±2.19 41.40±1.24 33.71±2.93
F. eff. (%) 58.60± 5.32 55.20± 2.57 23.40±2.44 19.52±1.46 18.20±2.55 18.16±2.11 84.96±1.35 72.25±1.47 74.09±5.45 52.68±2.18 44.01±1.47 41.03±1.07
V.E.P. (g/l/h) 0.30± 0.02 0.20± 0.01 0.08±0.00 0.06±0.00 0.05±0.00 0.06±0.00 0.80±0.04 0.66±0.00 0.72±0.02 0.46±0.00 0.41±0.02 0.33±0.01
Y E/CS(g/g) 0.63± 0.03 0.53± 0.01 0.51±0.00 0.46±0.01 0.38±0.02 0.48±0.01 0.48±0.01 0.47±0.01 0.50±0.03 0.45±0.01 0.48±0.00 0.42±0.02
Y E/IS(g/g) 0.37± 0.01 0.29± 0.01 0.12±0.00 0.09±0.00 0.07±0.00 0.09±0.00 0.41±0.02 0.34±0.01 0.37±0.02 0.24±0.00 0.21±0.01 0.17±0.00
Effect of different pH values on ethanol production from treated cheese whey:
[image:5.595.59.294.168.425.2]Data concerning fermentation of treated cheese whey (14 % sugar) adjusted to different pH values (3.5, 4.5, 5.5 and 6.5) by the highest two ethanol- producing yeast strains (K. marixianus ZMS3-GU133329 and S. cerevisiae EC1118) are presented in Tables 2,3,4 and 5 ;
Figure 2. Ethanol concentration (g/l), residual sugar concentration (g/l), % of ethanol from theoretical value (%) and Y E/IS (g/g) during batch
fermentation of treated cheese whey with 14% sugar at 35oC & pH 3.5 for
144 hours.
At pH 3.5, the maximum ethanol level formed by K. marixianus was 36.40 g/l after 48 h while S. cerevisiae
produced 32.60 g/l after 72 h of fermentation. The amounts of unconsumed sugar at the end of fermentation process were 64.8 and 55.30 g/l in case of K. marixianus and S. cerevisiae, respectively. The fermentation efficiency of K. marixianus
and S. cerevisiae reached to 87.28 and 60.51 %, respectively, after 144 hour for each. The highest volumetric productivity of K. marixianus and S. cerevisiae were 1.04 and 0.9 g/l/h which recorded during the first and third 24 hours of fermentation, respectively. The maximum ethanol yields over both consumed (YE/CS) and initial sugar (YE/IS) of K.
marixianus were 0.53 and 0.30 g/g after 48h, respectively,
while those of S. cerevisiae were 0.50 and 0.23 g/g after 72h, respectively. The final pH decreased to 3.0 and 3.1 for K. marixianus and S. cerevisiae, respectively (Table, 2 and Figure, 2)
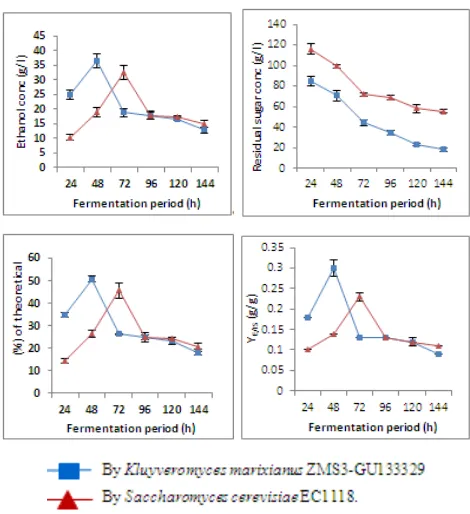
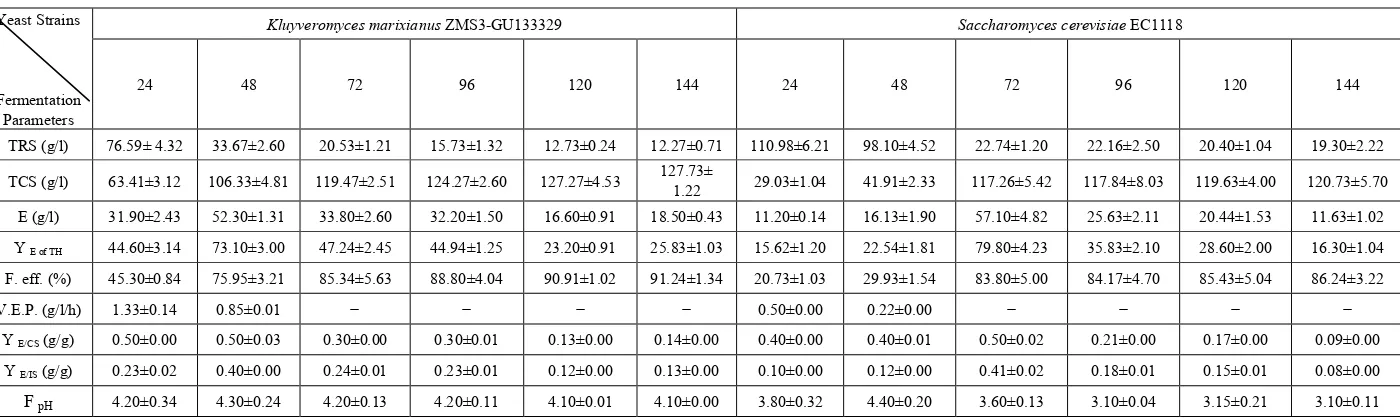
In case of pH 4.5: The maxima ethanol levels of K. marixianus and S. cerevisiae were 52.30 and 57.10 g/l recorded after 48h and 72 h, respectively. The amounts of residual sugar decreased with time to reach 12.27 and 27.30 g/l by using K. marixianus and S. cerevisiae, respectively, at the end of fermentation period. Fermentation efficiency increased with time to reach 91.24 and 80.52 % for K. marixianus and S. cerevisiae, respectively, after 144 hours. The highest volumetric productivity values of K. marixianus
and S. cerevisiae were 1.33 and 0.5 g/l/h which recorded during the first 24 hours of fermentation. The maxima values of (YE/CS) and (YE/IS) for K. marixianus were 0.50 and 0.40 g/g, while those for S. cerevisiae were 0.50 and 0.41 g/g, respectively. The final pH decreased in case of K. marixianus to 4.10 and for S. cerevisiae to 3.8 (Table, 3 and Figure, 3).
Figure 3. Ethanol concentration (g/l), residual sugar concentration (g/l), % of ethanol from theoretical value (%) and Y E/IS (g/g) during batch
fermentation of treated cheese whey with 14% sugar at 35oC & pH 4.5 for
[image:5.595.313.551.330.583.2]Table 2. Fermentation kinetics of bio-ethanol production by Kluyveromyces marixianus ZMS3-GU133329 and Saccharomyces cerevisiae EC1118 from treated whey adjusted to pH 3.5 Yeast
Strains
Fermentation Parameters
Kluyveromyces marixianus ZMS3-GU133329 Saccharomyces cerevisiae EC1118
24 48 72 96 120 144 24 48 72 96 120 144
TRS (g/l) 84.58±4.82 70.81±5.21 44.10±2.31 34.31±1.84 22.90±1.51 17.81±1.20 115.96±5.21 98.95±2.11 71.61±1.43 68.51±2.44 58.10±4.12 55.30±1.82 TCS (g/l) 55.42±4.21 69.19±2.11 95.92±4.60 105.69±1.47 117.20±2.10 122.20±1.43 24.10±1.42 41.10±0.91 68.40±1.22 71.50±3.43 81.94±1.44 84.72±4.12 E (g/l) 25.00±1.65 36.40±2.42 18.74±1.24 17.80±1.33 16.72±0.59 12.77±1.12 10.30±0.87 18.96±1.52 32.60±2.33 17.84±1.21 17.30±0.35 14.90±1.21 Y E of TH 34.95±1.04 50.81±1.22 26.20±0.34 24.90±2.31 23.36±1.70 17.90±0.81 14.32±0.93 26.51±1.55 45.60±3.55 24.94±1.21 24.15±0.53 20.80±1.23
F. eff. (%) 39.60±2.14 49.42±1.45 68.51±5.14 75.50±3.01 83.70±4.00 87.28±5.04 17.20±1.32 29.33±2.10 48.90±3.21 51.10±1.24 58.53±0.92 60.51±0.83 V.E.P. (g/l/h) 1.04±0.12 0.50±0.00 − − − − 0.43±0.00 0.36±0.00 0.90±0.00 − − −
Y E/CS (g/g) 0.45±0.01 0.53±0.03 0.20±0.02 0.17±0.00 0.14±0.00 0.10±0.01 0.10±0.00 0.20±0.00 0.50±0.00 0.30±0.00 0.30±0.00 0.30±0.01
Y E/IS (g/g) 0.18±0.00 0.30±0.02 0.13±0.00 0.13±0.00 0.12±0.01 0.09±0.00 0.10±0.00 0.14±0.00 0.23±0.01 0.13±0.00 0.12±0.00 0.11±0.00
F pH 3.20±1.81 3.00±0.53 3.00±0.92 3.10±1.03 3.00±1.00 3.00±0.84 3.30±1.44 3.20±0.51 3.30±0.24 3.10±0.43 3.20±0.22 3.10±0.44
.Table 3. Fermentation kinetics of bio-ethanol production by Kluyveromyces marixianus ZMS3-GU133329 and Saccharomyces cerevisiae EC1118 from treated whey adjusted to pH 4.5.. Yeast Strains
Fermentation Parameters
Kluyveromyces marixianus ZMS3-GU133329 Saccharomyces cerevisiae EC1118
24 48 72 96 120 144 24 48 72 96 120 144
TRS (g/l) 76.59± 4.32 33.67±2.60 20.53±1.21 15.73±1.32 12.73±0.24 12.27±0.71 110.98±6.21 98.10±4.52 22.74±1.20 22.16±2.50 20.40±1.04 19.30±2.22
TCS (g/l) 63.41±3.12 106.33±4.81 119.47±2.51 124.27±2.60 127.27±4.53 127.73± 1.22 29.03±1.04 41.91±2.33 117.26±5.42 117.84±8.03 119.63±4.00 120.73±5.70
E (g/l) 31.90±2.43 52.30±1.31 33.80±2.60 32.20±1.50 16.60±0.91 18.50±0.43 11.20±0.14 16.13±1.90 57.10±4.82 25.63±2.11 20.44±1.53 11.63±1.02 Y E of TH 44.60±3.14 73.10±3.00 47.24±2.45 44.94±1.25 23.20±0.91 25.83±1.03 15.62±1.20 22.54±1.81 79.80±4.23 35.83±2.10 28.60±2.00 16.30±1.04
F. eff. (%) 45.30±0.84 75.95±3.21 85.34±5.63 88.80±4.04 90.91±1.02 91.24±1.34 20.73±1.03 29.93±1.54 83.80±5.00 84.17±4.70 85.43±5.04 86.24±3.22 V.E.P. (g/l/h) 1.33±0.14 0.85±0.01 − − − − 0.50±0.00 0.22±0.00 − − − −
Y E/CS (g/g) 0.50±0.00 0.50±0.03 0.30±0.00 0.30±0.01 0.13±0.00 0.14±0.00 0.40±0.00 0.40±0.01 0.50±0.02 0.21±0.00 0.17±0.00 0.09±0.00
Y E/IS (g/g) 0.23±0.02 0.40±0.00 0.24±0.01 0.23±0.01 0.12±0.00 0.13±0.00 0.10±0.00 0.12±0.00 0.41±0.02 0.18±0.01 0.15±0.01 0.08±0.00
Figure 4. Ethanol concentration (g/l), residual sugar concentration (g/l), % of ethanol from theoretical value (%) and Y E/IS (g/g) during batch
fermentation of treated cheese whey with 14% sugar at 35oC & pH 5.5 for
144 hours
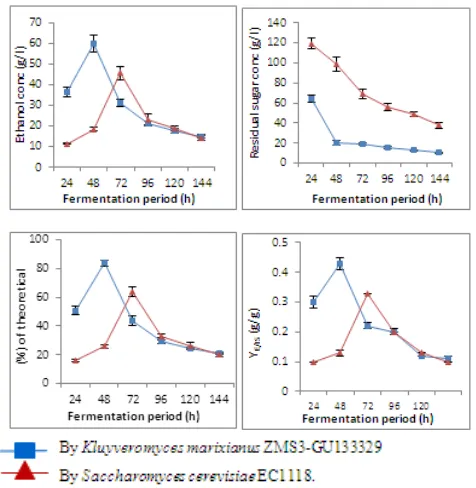
Concerning the third pH value 5.5, The maximum ethanol level reached to 69.60 g/l (equal to 97.23 % of the theoretical value) by using of K. marixianus for 48h. On the other hand,
S. cerevisiae formed 64.30 g ethanol per liter as maximum value after 72 h of fermentation. The amount of residual sugar decreased with time until reached to 0.30 and 9.21 g/l by using K. marixianus and S. cerevisiae, respectively, at the end of fermentation time (Table, 4 and Figure, 4). Fermentation efficiency increased to the maximum values (99.80 and 93.42 %) by K. marixianus and S. cerevisiae, respectively, after 144 h. The maxima ethanol productivities produced by K. marixianus and S. cerevisiae were 1.60 and 2.70 g/l/h after 48h and 72h, respectively. The values of YE/CS and YE/IS produced by K. marixianus were 0.70 and 0.50 g/g after 24 and 48h, respectively.
Data obtained at pH 6.5 indicated that, the highest ethanol levels produced by both K. marixianus and S. cerevisiae
were 59.90 and 45.60 g/l after 48 and 72h, respectively. The amounts of unconsumed sugar detected in case of K.
marixianus and S. cerevisiae were 10.52 and 37.81 g/l, respectively, at the end of fermentation process. The maxima values of fermentation efficiencies of K. marixianus and S. cerevisiae were 92.50 and 72.99 %, respectively (Table, 5 and Figure, 5).
[image:7.595.312.550.143.387.2]
Figure 5. Ethanol concentration (g/l), residual sugar concentration (g/l), % of ethanol from theoretical value (%) and Y E/IS (g/g) during batch
fermentation of treated cheese whey with 14% suga at 35oC & pH 6.5 for
144 hours..
Our results revealed that pH 5.5 was the most suitable which resulted in the highest ethanol production by both K. marixianus and S.cerevisiae. Similar results were recorded by several investigators, (17) studied the utilization of cheese whey powder for ethanol fermentation and found that ethanol yield at pH 5 or 6 was considerably higher than those obtained at other pH values which ranged from 3 to 7. Our results were also in closed agreement with that reported by (24) who found that a pH value around 5.5 improves the fermentation process of ricotta cheese whey into ethanol by
Table 4. Fermentation kinetics of bio-ethanol production by Kluyveromyces marixianus ZMS3-GU133329 and Saccharomyces cerevisiae EC1118 from treated whey adjusted topH 5.5. Yeast
Strains
Fermentation Parameters
Kluyveromyces marixianus ZMS3-GU133329 Saccharomyces cerevisiae EC1118
24 48 72 96 120 144 24 48 72 96 120 144
TRS (g/l) 94.80±2.21 2.02±0.11 1.40±0.10 0.71±0.00 0.50±0.01 0.30±0.01 118.95±6.24 82.63±5.70 11.31±1.22 9.73±0.71 9.70±0.53 9.21±0.01 TCS (g/l) 45.30±2.00 137.99± 7.01 138.62± 5.24 139.30±3.00 139.60±7.04 139.72±2.80 21.05±2.00 57.40±3.21 128.69±4.33 130.30±5.71 130.32±4.63 130.80±6.62
E (g/l) 31.33±2.11 69.60±4.24 50.30±4.33 36.80±2.80 23.04±1.03 15.94±1.01 10.08±0.83 26.96±2.14 64.30±3.11 47.34±3.21 18.23±1.42 15.51±1.22 Y E of TH 43.80±1.44 97.23±4.70 70.24±5.11 51.41±2.40 32.21±1.01 22.30±1.50 14.10±1.01 37.70±2.50 89.81±4.34 66.20±5.70 25.50±2.00 21.70±1.42
F. eff. (%) 32.00±2.44 99.00±5.23 99.01±4.23 99.50±6.01 99.70±200 99.80±5.72 15.04±0.80 40.98±2.13 91.92±4.00 93.05±3.80 93.08±2.22 93.42±1.43 V.E.P. (g/l/h) 1.31±0.11 1.60±0.12 − − − − 0.42±0.01 1.12±0.12 2.70±0.23 − − −
Y E/CS (g/g) 0.70±0.05 0.50±0.02 0.40±0.01 0.30±0.01 0.20±0.01 0.11±0.00 0.50±0.00 0.50±0.00 0.50±0.01 0.40±0.02 0.14±0.00 0.12±0.00
Y E/IS (g/g) 0.22±0.00 0.50±0.02 0.40±0.01 0.30±0.00 0.20±0.00 0.11±0.00 0.10±0.00 0.20±0.00 0.50±0.03 0.34±0.02 0.13±0.00 0.11±0.00
[image:8.808.52.756.92.298.2]F pH 5.30±0.21 5.30±0.11 5.10±0.31 5.00±0.42 5.00±0.04 5.00±0.11 5.25±0.20 5.25±0.30 5.20±0.24 5.20±0.13 5.15±0.11 5.15±0.50
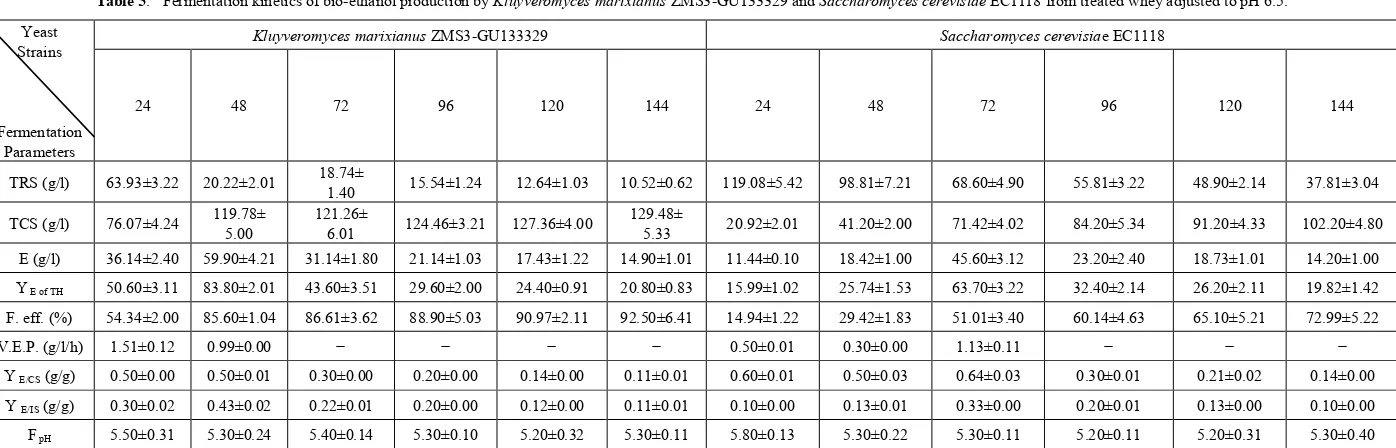
Table 5. Fermentation kinetics of bio-ethanol production by Kluyveromyces marixianus ZMS3-GU133329 and Saccharomyces cerevisiae EC1118 from treated whey adjusted topH 6.5. Yeast
Strains
Fermentation Parameters
Kluyveromyces marixianus ZMS3-GU133329 Saccharomyces cerevisiae EC1118
24 48 72 96 120 144 24 48 72 96 120 144
TRS (g/l) 63.93±3.22 20.22±2.01 18.74± 1.40 15.54±1.24 12.64±1.03 10.52±0.62 119.08±5.42 98.81±7.21 68.60±4.90 55.81±3.22 48.90±2.14 37.81±3.04
TCS (g/l) 76.07±4.24 119.78± 5.00 121.26± 6.01 124.46±3.21 127.36±4.00 129.48± 5.33 20.92±2.01 41.20±2.00 71.42±4.02 84.20±5.34 91.20±4.33 102.20±4.80 E (g/l) 36.14±2.40 59.90±4.21 31.14±1.80 21.14±1.03 17.43±1.22 14.90±1.01 11.44±0.10 18.42±1.00 45.60±3.12 23.20±2.40 18.73±1.01 14.20±1.00 Y E of TH 50.60±3.11 83.80±2.01 43.60±3.51 29.60±2.00 24.40±0.91 20.80±0.83 15.99±1.02 25.74±1.53 63.70±3.22 32.40±2.14 26.20±2.11 19.82±1.42
F. eff. (%) 54.34±2.00 85.60±1.04 86.61±3.62 88.90±5.03 90.97±2.11 92.50±6.41 14.94±1.22 29.42±1.83 51.01±3.40 60.14±4.63 65.10±5.21 72.99±5.22 V.E.P. (g/l/h) 1.51±0.12 0.99±0.00 − − − − 0.50±0.01 0.30±0.00 1.13±0.11 − − −
Y E/CS (g/g) 0.50±0.00 0.50±0.01 0.30±0.00 0.20±0.00 0.14±0.00 0.11±0.01 0.60±0.01 0.50±0.03 0.64±0.03 0.30±0.01 0.21±0.02 0.14±0.00
Y E/IS (g/g) 0.30±0.02 0.43±0.02 0.22±0.01 0.20±0.00 0.12±0.00 0.11±0.01 0.10±0.00 0.13±0.01 0.33±0.00 0.20±0.01 0.13±0.00 0.10±0.00
[image:8.808.58.756.305.529.2]Effect of different nutritional supplements on the production of ethanol from treated cheese whey:
This experiment was designed to study the effect of different four N-sources ((NH4)2SO4, KH2PO4, yeast extract and malt extract) at 3 g/l on the ethanol production from treated whey (14% sugar) at pH 5.5 and temperature 35oC for 144 hours by both highly producers yeast strains
(Kluyveromyces marixianus ZMS3-GU133329 and
[image:9.595.61.296.106.430.2]Saccharomyces cerevisiae EC1118).
Figure 6. Ethanol concentration (g/l), residual sugar concentration (g/l) % of ethanol from theoretical value (%) and Y E/IS (g/g) during batch
fermentation of treated cheese whey with 14% sugar and 0.3% (NH4)2SO4 at
35oC & pH 5.5 for 144 hours.
Concerning the first N-sources (NH4)2SO4, data in table (6) and illustrated by figure (6) indicated that the maxima ethanol concentrations for both K. marixianus and S. cerevisiae reached to 68.82 and 44.54 g/l (equal to 96.20 and 62.30 % of the theoretical values) after 48 and 72h, respectively. The amount of unconsumed sugar by both K. marixianus and S. cerevisiae were 0.22 and 15.71 g/l, respectively after 144 hours. The fermentation efficiencies for K. marixianus and S. cerevisiae reached to 99.84 and 88.80%, respectively at the end of fermentation period. The highest ethanol volumetric productivities were 1.51 and 0.50 g/l/h for K. marixianus and S. cerevisiae, respectively. The
maxima values of both YE/CS and YE/IS for K. marixianus were 0.50 g/g after 48h. While the maxima values of YE/CS and YE/IS were 0.50 and 0.32 g/g, respectively, after 72h for S.
cerevisiae.
In treated whey supplemented with KH2PO4, the maxima ethanol levels formed by K. marixianus and S. cerevisiae
were 68.73 and 44.68 g/l after 48 and 72h respectively. The amount of unconsumed sugar by both K. marixianus and S. cerevisiae were 1.22 and 13.82 g/l after 144 hours (Table, 7 and Figure,7). The maxima fermentation efficiencies for K. marixianus and S. cerevisiae were 99.13 and 90.12 %, respectively after 144 hours. The highest volumetric productivities for K. marixianus and S. cerevisiae were 1.50 and 1.10 after 24 and 72 h, respectively. Maximum ethanol yields over both consumed sugar (YE/CS) and initial sugar (YE/IS) produced by K. marixianus were 0.50 and 0.50 g/g after 24 and 48h, respectively. While maximum YE/CS and YE/IS values of S. cerevisiae were 0.50 and 0.32 g/g after 24 and 72 h, respectively.( Table, 7).
Figure 7. Ethanol concentration (g/l), residual sugar concentration (g/l), % of ethanol from theoretical value (%) and Y E/IS (g/g) during batch
fermentation of treated cheese whey with 14% sugar and 0.3% KH2PO4 at
[image:9.595.318.548.321.577.2]Table 6. Fermentation kinetics of bio-ethanol production from treated cheese whey with 14% initial sugar supplemented with 0.3% (NH4)2SO4 by Kluyveromyces marixianus ZMS3-GU133329 and Saccharomyces cerevisiae
EC1118. Yeast Strains
Fermentation Parameters
Kluyveromyces marixianus ZMS3-GU133329 Saccharomyces cerevisiae EC1118
24 48 72 96 120 144 24 48 72 96 120 144
TRS (g/l) 74.93±5.32 3.63±2.14 2.83±0.13 1.74±0.11 0.94±0.05 0.22±0.01 110.50±7.22 98.66±7.22 47.31±2.14 35.50±2.01 25.21±2.00 15.71±1.04
TCS (g/l) 65.07±3.44 136.37± 5.72 137.17± 6.30 138.26±4.62 139.06±5.54 139.78±7.34 29.50±2.11 41.34±3.24 92.69±6.42 104.50±7.81 114.79±6.50 124.29±7.41 E (g/l) 32.45±2.14 68.82±4.03 49.32±3.62 35.35±2.33 24.95±1.54 14.46±1.21 11.63±1.03 17.48±1.34 44.54±3.24 25.41±2.11 18.63±1.22 12.53±1.00 Y E of TH 45.40±3.21 96.20±6.22 68.94±4.23 49.41±3.70 34.90±2.44 20.21±1.53 16.3±1.22 24.43±2.01 62.30±5.42 35.52±2.34 26.04±2.11 17.51±1.04
F. eff. (%) 46.50±3.24 97.41±4.82 97.98±3.33 98.80±6.23 99.33±5.61 99.84±4.72 21.10±2.11 29.53±2.32 66.21±5.40 74.64±5.24 81.99±4.30 88.80±6.52 V.E.P. (g/l/h) 1.40±0.14 1.51±1.01 − − − − 0.50±0.04 0.24±0.01 − − − −
Y E/CS (g/g) 0.50±0.02 0.50±0.04 0.40±0.01 0.30±0.02 0.20±0.02 0.10±0.01 0.40±0.02 0.42±0.03 0.50±0.04 0.24±0.01 0.20±0.01 0.10±0.01
Y E/IS (g/g) 0.23±0.02 0.50±0.03 0.40±0.01 0.30±0.01 0.20±0.02 0.10±0.01 0.08±0.00 0.12±0.01 0.32±0.02 0.20±0.02 0.13±0.01 0.10±0.01
F pH 5.50±0.21 5.40±0.32 5.40±0.50 5.20±0.41 5.30±0.22 5.20±0.42 5.40±0.21 5.40±0.34 5.20±0.11 5.20±0.41 5.30±0.20 5.20±0.13
Table 7. Fermentation kinetics of bio-ethanol production from treated cheese whey with 14% initial sugar supplemented with 0.3% KH2PO4 by Kluyveromyces marixianus ZMS3-GU133329 and Saccharomyces cerevisiae
EC1118. Yeast Strains
Fermentation Parameters
Kluyveromyces marixianus ZMS3-GU133329 Saccharomyces cerevisiae EC1118
24 48 72 96 120 144 24 48 72 96 120 144
TRS (g/l) 67.93±5.22 3.63±0.13 2.83±0.14 2.32±0.11 1.54±0.12 1.22±0.10 112.42±9.24 99.37±7.50 44.22±4.11 32.78±3.00 25.11±1.53 13.82±1.04 TCS (g/l) 72.07±4.21 136.37±3.01 137.17±5.61 137.68±5.00 138.46±4.35 138.78±6.70 27.58±2.04 40.63±3.50 95.78±6.34 107.22±8.03 114.89±5.21 126.18±6.00
E (g/l) 35.44±3.21 68.73±4.22 45.33±3.11 34.12±2.64 25.66±2.01 15.73±1.50 12.32±1.04 18.75±1.52 44.68±3.22 24.21±2.11 15.85±1.31 12.44±1.20 Y E of TH 49.5±3.21 96.07±6.21 63.40±4.22 47.70±3.41 35.90±2.11 21.99±2.41 17.22±1.12 26.21±2.31 62.50±5.40 33.84±2.51 22.20±2.00 17.40±1.23
F. eff. (%) 51.50±5.11 97.41±5.14 97.98±4.22 98.34±4.73 98.90±4.51 99.13±3.12 19.70±1.02 29.02±2.11 68.41±3.14 76.60±5.22 82.06±4.23 90.12±5.80 V.E.P. (g/l/h) 1.50±0.12 1.40±0.10 − − − − 0.51±0.04 0.30±0.02 1.10±0.10 − − −
Y E/CS (g/g) 0.50±0.15 0.50±0.03 0.33±0.01 0.30±0.02 0.20±0.01 0.11±0.01 0.50±0.05 0.50±0.02 0.50±0.03 0.23±0.02 0.14±0.01 0.10±0.01
Y E/IS (g/g) 0.30±0.02 0.50±0.01 0.32±0.03 0.24±0.00 0.20±0.01 0.11±0.01 0.10±0.00 0.13±0.01 0.32±0.02 0.20±0.01 0.11±0.00 0.10±0.02
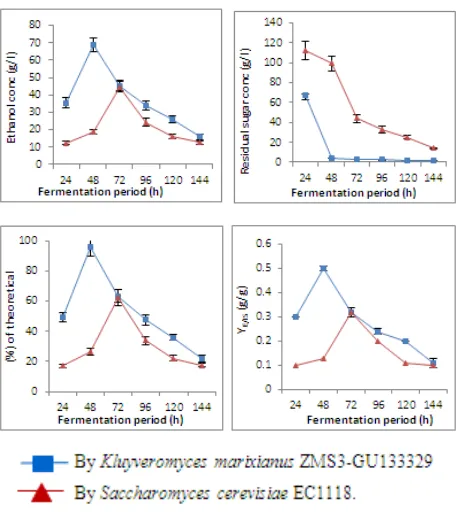
[image:10.808.51.757.335.529.2]Regarding the addition of yeast extract, data in table (8) and figure (8) showed that the maximum ethanol levels for K. marixianus and S. cerevisiae were 69.85 and 65.36 g/l after 48 and 72 h, respectively. The residual sugar at the end of fermentation process for K. marixianus and S. cerevisiae
were 0.11 and 4.53 g/l, respectively. The fermentation efficiencies increased with time and the maximum values produced by K. marixianus and S. cerevisiae were 99.92 and 96.80 %, respectively after 144h. The maxima volumetric productivities were 1.60 and 1.33 g/l/h after 24 and 48h produced by K. marixianus and S. cerevisiae, respectively. Maximum YE/CS and YE/IS values of K. marixianus were the same and equal to 0.50 g/g after 24 and 48h, respectively.
[image:11.595.314.550.158.392.2]Saccharomyces cerevisiae produced the maximum YE/CS and YE/IS values (0.50 for each) after 48 and 72h, respectively.
Figure 8. Ethanol concentration (g/l), residual sugar concentration (g/l), % of ethanol from theoretical value (%) and Y E/IS (g/g) during batch
fermentation of treated cheese whey with 14% sugar and 0.3% yeast extract at 35oC & pH 5.5 for 144 hours.
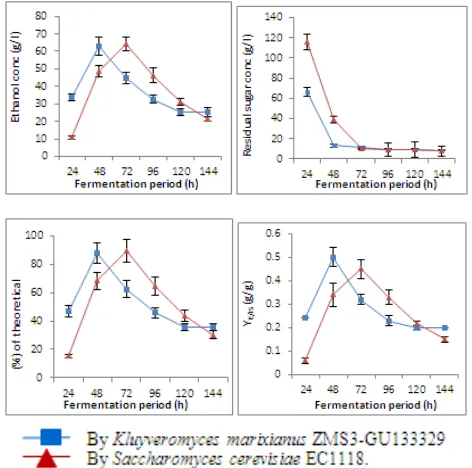
Addition of 3 g/l malt extract to treated whey showed that the highest ethanol yield for K. marixianus and S. cerevisiae
were 62.83 and 64.14 g/l recorded after 48 and 72h, respectively. The amount of unconsumed sugar at the end of fermentation process for K. marixianus and S. cerevisiae
were 8.48 and 7.57 g/l, respectively (Table, 9 and Figure, 9). The maxima fermentation efficiencies for K. marixianus and
S. cerevisiae were 93.94 and 94.60%, respectively, after 144 hours. Maximum ethanol volumetric productivities of K.
marixianus and S. cerevisiae were 1.41 and 1.6 g/l/h after 24 and 48h, respectively. The maximum values of YE/CS and YE/IS for both the studied yeast strains were the same and equal to 0.50 g/g after 48 h. The final pH values decreased and reached to 5.1and 5.2 for K. marixianus and S .cerevisiae, respectively (Table, 9 and Figure, 9).
Figure 9. Ethanol concentration (g/l), residual sugar concentration (g/l), % of ethanol from theoretical value (%) and Y E/IS (g/g) during batch
fermentation of treated cheese whey with 14% sugar and 0.3% malt extract at 35oC & pH 5.5 for 144 hours.
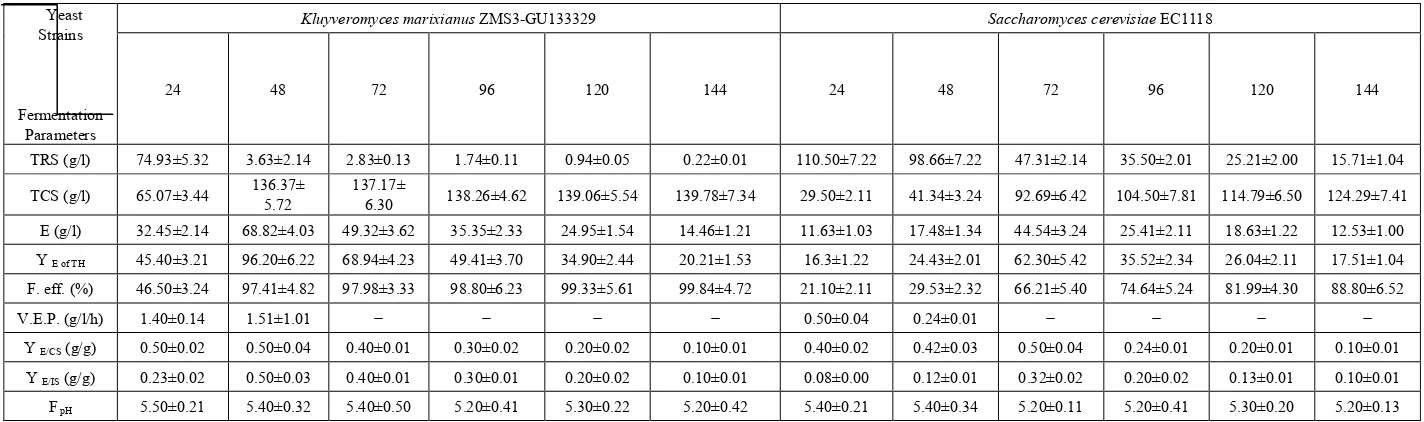
[image:11.595.64.292.260.497.2]Table 8. Fermentation kinetics of bio-ethanol production from treated cheese whey with 14% initial sugar supplemented with 0.3% yeast extract by Kluyveromyces marixianus ZMS3-GU133329 and Saccharomyces cerevisiae
1118
Yeast Strains
Fermentation Parameters
Kluyveromyces marixianus ZMS3-GU133329 Saccharomyces cerevisiae EC1118
24 48 72 96 120 144 24 48 72 96 120 144
TRS (g/l) 59.58±2.12 0.32±0.01 0.25±0.01 0.24±0.02 0.13±0.00 0.11±0.01 104.50±5.34 40.46±3.40 8.82±4.63 8.74±5.44 7.61±6.52 4.53±3.20 TCS (g/l) 80.42±3.21 139.68±7.91 139.75±9.51 139.76±6.72 139.87±4.33 139.89±8.43 35.50±2.51 99.54±6.42 131.18±8.21 131.26±8.04 132.39±6.34 135.47±9.71
E (g/l) 37.56±3.11 69.85±5.42 46.75±4.33 38.52±2.72 24.34±2.00 16.88±1.31 15.43±1.22 47.33±3.21 65.36±5.04 45.43±4.00 30.41±2.34 22.29±2.11 Y E of TH 52.60±4.22 97.80±5.31 65.43±4.10 53.91±3.21 34.10±2.12 23.62±2.14 21.60±1.93 66.20±4.31 91.40±5.22 63.50±4.30 42.51±3.10 31.20±2.14
F. eff. (%) 57.44±4.03 99.80±6.30 99.82±6.54 99.83±5.22 99.91±4.21 99.92±8.42 25.40±1.53 71.10±6.42 93.70±7.60 93.80±8.61 94.60±7.24 96.80±5.22 V.E.P. (g/l/h) 1.60±0.14 1.34±0.11 − − − 0.64±0.02 1.33±0.11 0.80±0.04 − − −
Y E/CS (g/g) 0.50±0.02 0.50±0.05 0.33±0.02 0.30±0.02 0.20±0.01 0.12±0.01 0.43±0.02 0.50±0.05 0.50±0.01 0.40±0.02 0.23±0.02 0.20±0.02
Y E/IS (g/g) 0.30±0.02 0.50±0.01 0.33±0.03 0.30±0.01 0.20±0.01 0.12±0.01 0.11±0.01 0.33±0.03 0.46±0.02 0.32±0.02 0.21±0.01 0.15±0.01
[image:12.808.53.760.97.296.2]F pH 5.30±0.22 5.40±0.01 5.40±0.13 5.20±0.14 5.20±0.31 5.20±0.11 5.40±0.24 5.40±0.43 5.30±0.31 5.20±0.41 5.30±0.22 5.20±0.50
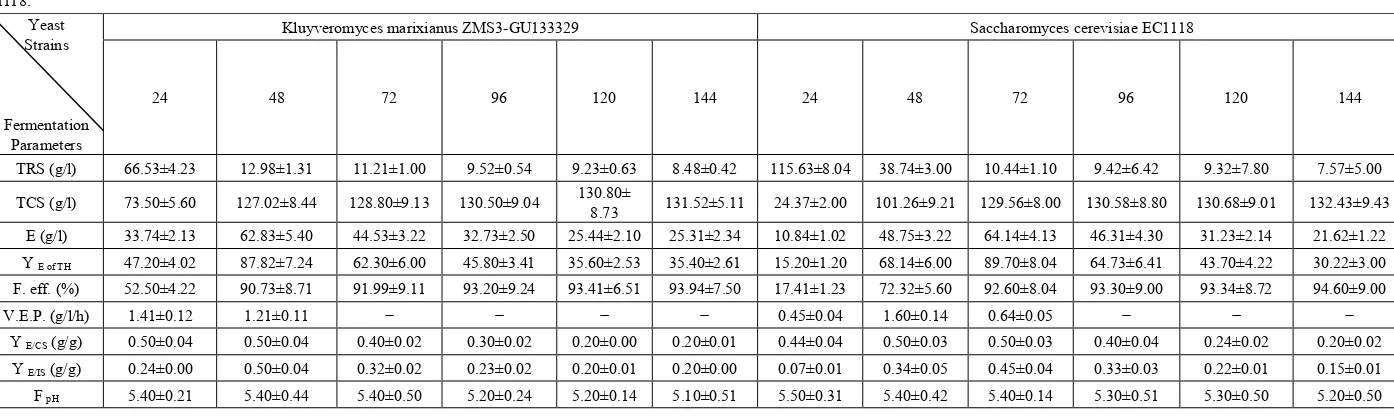
Table 9. Fermentation kinetics of bio-ethanol production from treated cheese whey with 14% initial sugar supplemented with 0.3% malt extract by Kluyveromyces marixianus ZMS3-GU133329 and Saccharomyces cerevisiae
EC1118. Yeast Strains
Fermentation Parameters
Kluyveromyces marixianus ZMS3-GU133329 Saccharomyces cerevisiae EC1118
24 48 72 96 120 144 24 48 72 96 120 144
TRS (g/l) 66.53±4.23 12.98±1.31 11.21±1.00 9.52±0.54 9.23±0.63 8.48±0.42 115.63±8.04 38.74±3.00 10.44±1.10 9.42±6.42 9.32±7.80 7.57±5.00 TCS (g/l) 73.50±5.60 127.02±8.44 128.80±9.13 130.50±9.04 130.80± 8.73 131.52±5.11 24.37±2.00 101.26±9.21 129.56±8.00 130.58±8.80 130.68±9.01 132.43±9.43
E (g/l) 33.74±2.13 62.83±5.40 44.53±3.22 32.73±2.50 25.44±2.10 25.31±2.34 10.84±1.02 48.75±3.22 64.14±4.13 46.31±4.30 31.23±2.14 21.62±1.22 Y E of TH 47.20±4.02 87.82±7.24 62.30±6.00 45.80±3.41 35.60±2.53 35.40±2.61 15.20±1.20 68.14±6.00 89.70±8.04 64.73±6.41 43.70±4.22 30.22±3.00
F. eff. (%) 52.50±4.22 90.73±8.71 91.99±9.11 93.20±9.24 93.41±6.51 93.94±7.50 17.41±1.23 72.32±5.60 92.60±8.04 93.30±9.00 93.34±8.72 94.60±9.00 V.E.P. (g/l/h) 1.41±0.12 1.21±0.11 − − − − 0.45±0.04 1.60±0.14 0.64±0.05 − − −
Y E/CS (g/g) 0.50±0.04 0.50±0.04 0.40±0.02 0.30±0.02 0.20±0.00 0.20±0.01 0.44±0.04 0.50±0.03 0.50±0.03 0.40±0.04 0.24±0.02 0.20±0.02
Y E/IS (g/g) 0.24±0.00 0.50±0.04 0.32±0.02 0.23±0.02 0.20±0.01 0.20±0.00 0.07±0.01 0.34±0.05 0.45±0.04 0.33±0.03 0.22±0.01 0.15±0.01
[image:12.808.55.752.316.524.2]REFERANCES
[1] Yves, V. (1979): Le lactoserum. Matiere premiere noblepour les industries alimentaires humaine set animales. Revue Laitiere Franaise, 372: 27-39.
[2] Anon (1983): Les produitsobtenus a partir du lactoserum, Revue LaitiereFranaise,422, 44-47.
[3] Marwaha, S. S. and Kennedy, J. F. (1988): Review: whey pollution problem and potential utilization. Int. J. Food Sci. Technol., 23: 323-336.
[4] El-Kady, I. A.; Eman Mostafa, M. and Zohri, A. A. (1995): Utilization of cheese whey for lipid and sterol production by some isolates of xerophilous fungi. Folia Microbiologica (CZECH) 40(2): 209-212.
[5] Fukuhara, H. (2006): Kluyveromyces lactis—a retrospective. FEMS Yeast Res, 6:323–4.
[6] Friend, B. A. and Shahani, K. M. (1979): Whey fermentation New Zealand J. Dairy Sci. Technol., 14: 143-155
[7] Mawson, A. J. (1994): Bioconversions for whey utilization and waste abatement. Bioresour Technol Biomass Bioenergy Biowastes Convers Technol Biotrans form Prod Technol, 47: 195–203
[8] Nolan, A. M.; Barron, N.; Brady, T.; McAree, T.; Smith, D.; McHale, L. and McHale, A. P. (1994): Ethanol production at 45°C by an alginate-immobilized, thermotolerant strain of Kluyveromyces marxianus following growth on glucose-containing media. Biotechnol.Lett.,16: 849-852. [9] Tin, C.S.F. and Mawson, A.J. (1993): Ethanol production
from whey in a membrane recycle bioreactor. Process Biochemistry, 28(4): 217-221
[10] Moulin, G. and Galzy, P. (1984): Whey, a potential substrate for biotechnology. Biotechnol Genet Eng Rev., 1:347–373. [11] Ozmihci, S., Kargi, F. (2007b). Kinetics of batch ethanol
fermentation of cheese-whey powder (CWP) solution as function of substrate and yeast concentrations. Bioresource Technology, 98, 2978–2984.
[12] Oliveira, M. E. D.; Vaughan,B. E. and Rykiel, E. J. J. Jr. (2005):Ethanol as fuel: energy, carbon dioxide balances, and ecological footprint. Bioscience, 55:593–602.
[13] Badger, P. C. (2002): Ethanol from Cellulose: A General Review. Trends in new crops and new uses. J. Janick and A.
Whipkey (eds.). Alexandria, VA. ASHS Press, 17-12. [14] Litcht, F. O. (2006): “World Ethanol Markets: The outlook to
2015” Tunbridge Wells, Agra Europe Special report, UK. [15] Maysa, M. A. Ali (2010): Studies on production of ethanol
and single cell proteins by local yeast isolates. M. Sc. Thesis, Botany & Microbiology Department, Faculty of Science, Assiut University, Egypt.
[16] Wickerham, L. J. (1951): Taxonomy of yeasts. Techn. Bull. 1029, U.S.Dept. Agr., Washington, D.C.
[17] Serpil, O. and Fikret, K. (2006): Utilization of cheese whey powder (CWP) for ethanol fermentations: effects of operating parameters. Enzyme Microb Technol 38:711–8.
[18] Zohri, A. A. and Eman Mostafa, (2000): Ethanol production from dates in Saudi Arabia on industrial scale. Microbiology. 28 (2): 76-81.
[19] Limtong, S.; Sringiew, C. and Yongmanitchai, W. (2007): Production of fuel ethanol at high temperature from sugar cane juice by a newly isolated Kluyveromyces marixianus. Bioresource Technology, 98: 3367-3374.
[20] Roukas, T.(1996):Ethanol production from non-sterilized beet molasses by free and immobilized Saccharomyces cerevisiae cells using fed-batch culture. Journal of Food Engineering 27: 87-96.
[21] Siqueira, P. F.; Karp, S. G.; Carvalho, J. C.; Sturm W.; Rodriguez-Leon, J. A.; Tholozan, J Singhania, R. R.;Pandey, A. and Soccol, C.R. (2008): Production of bio-ethanol from soybean molasses by Saccharomyces cerevisiae. at laboratory, pilot and industrial scales. Bioresource Technology, 99: 8156–8163.
[22] Chanda, S. and Chakrabarti, S. (1996): Plant origin liquid waste, a source for single cell protein production by yeast. Biores Technol. 57: 51–4.
[23] Miller, G.L. (1959). Use of dinitrosalycilic acid reagent for determination of reducing sugars. Anal Chem. 31:315–71. [24] Sansonetti, S.; Curcio, S.; Calabro, V. and Iorio, G. (2009):
Bio-ethanol production by fermentation of ricotta cheese whey as an effective alternative non-vegetable source. Biomass and bioenergy 33: 1687 – 1692.
[25] Rubio-Texeira, M. (2006): Endless versatility in the biotechnological applications of Kluyveromyces LAC genes. Biotechnol Adv. 24:212-25.