Current Status of Renewable Energy Technologies
for Electricity Generation in Rwanda and Their
Estimated Potentials
Hakizimana Eustache1,*, Diego Sandoval1, Umaru Garba Wali2, Kayibanda Venant3
1African Center of Excellence in Energy for Sustainable Development, University of Rwanda, Kigali, Rwanda 2Department of Civil, Environmental and Geomatics Engineering, University of Rwanda, Kigali, Rwanda 3Department of Mechanical and Energy Engineering, School of Engineering, University of Rwanda, Kigali, Rwanda
Copyright©2019 by authors, all rights reserved. Authors agree that this article remains permanently open access under the terms of the Creative Commons Attribution License 4.0 International License
Abstract
Renewable energy technologies produce sustainable, clean energy from sources such as the sun, the wind, plants and water.Renewable energy often provides energy in four important areas: electricity generation, air and water heating/cooling, transportation and rural (off-grid) energy services. According to the Rwanda Energy Group, in 2018, the total installed capacity of Rwanda’s power generating plants was recorded at 218MW. Renewable sources of energy accounted for about 113.14 MW (52.4%) of total energy consumption in Rwanda. Renewable energy technologies have the potential to strengthen the nation's energy security, improve environmental quality and contribute to a strong energy economy. The purpose of this paper is to review the current renewable energy technologies in Rwanda with an estimation of their potential; the challenges of new and existing renewable energy technologies are also presented. The most important renewable energy technologies(i.e., hydro, solar and biomass energy) are discussed and analysed.Moreover,
each renewable energy technology’s description is followed by its current potential share, its challenges, the advantages of increased adoption, future perspectives and disadvantages. The results show that 35.13% of Rwandan households are connected to the national grid and 11.33% accessing through off-grid systems. These show that access to electricity remains low, so in the rural areas, efforts are also required to provide electricity to those who are not close to the national grid.Keywords
Renewable Energy Sources, Energy Technology and Sustainable Energy Systems1. Introduction
Officially, the Republic of Rwanda is an independent
country in Central and East Africa and one of the smallest countries on the African mainland, with an area of 10,169 sq. miles (26,338 km2) and an estimated population of 12,501,156 million (March 2018) [1]. Located a few degrees south of the equator, it borders with Burundi in the South, Democratic Republic of Congo in the West, Tanzania in the East and Uganda in the North. Rwanda is in the African Great Lakes region and is highly elevated; its geography is dominated by mountains in the west and savanna to the east, with numerous lakes throughout the country. The climate is temperate to subtropical, with two rainy seasons and two dry seasons each year. This geographic location makes Rwanda the potential source of renewable energy. The potential especially for renewable energy such as hydro, biomass and solar energy are huge and play a major role in the country’s energy mix [2]. Hydropower is the foremost energy resource utilized for power generation in the country. The primary energy balance in Rwanda consists of biomass at 93.1%, fuel at 6% and electricity at 0.9% [1, 2]. In the biomass category, wood fuel consumption stands at 80.4% and charcoal at 1.9%, while agricultural waste and peat occupy 10.8%. Yet, wind and geothermal energy have been evaluated for long-term renewable technologies for Rwanda. Each comes with its own unique set of technologies and benefits, and challenges are also discussed, with their current potential presented here.
2. Research Elaboration
2.1. Rwanda Energy Sector Structure
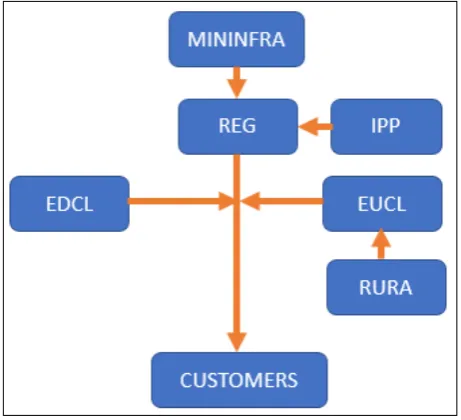
sustainable basis [31]. The management of energy systems in Rwanda involves various ministries and government agencies as well as private entities and individuals. The main parties involved in the energy in the country include the Ministry of Infrastructure (MININFRA), the Ministry of Natural Resources (MINIRENA), the Ministry of Local Government (MINALOC), the Ministry of Finance and Economic Planning (MINECOFIN), the Ministry of Trade and Industry (MINICOM), Rwanda Energy Group (REG), Rwanda Utilities Regulatory Agency (RURA) and the Independent Power Producers (IPPs). MININFRA is responsible for the development of national policies and strategies related to energy generation in the country. The government of Rwanda, through the Ministry of Infrastructure (MININFRA), sees its role in the off-grid energy sector including training, strategy, and development of technical specifications for energy equipment and recommendation of strategies for the development of the private sector, while regulation of the sector is the preserve of the Rwanda Utilities Regulatory Authority (RURA). Rwanda Energy Group (REG) is a private company established in 2014, wholly owned by the government. It carries operations out by two subsidiaries, the Energy Development Corporation Limited (EDCL) and the Energy Utility Corporation Limited (EUCL). EDCL supports new capacity and transmission development both by itself and with independent power producers (IPP), while EUCL was incorporated to have devoted attention in providing energy utility services in the Country through operations and maintenance of existing generation plants, transmission and distribution network and retail of electricity to end-users. The aim is to make the whole electricity transmission and distribution process as safe, efficient and reliable as possible.
The utility will also play a key role in the execution of Power Purchase/Power Sales Agreements with IPPS and other regional utilities for import and export.
2.2. Methodology
This paper used a literature review, analyses and site visits and survey to the Rwanda National Electricity Control Centre and some of the data gathered from REG installations nationwide to obtain data and information for the study. a review regarding methods and tools used to evaluate the potential of renewable energy technology such as hydro, solar and biomass energy and challenges for each renewable resource is highlighted. These enabled us to evaluate the state of the power sector in Rwanda through its targets such as the 512 MW installed power generation capacity by 2023/24, its electrification strategies, and its available energy resources and the
[image:2.595.306.537.126.336.2]challenges to exploit them. It is also expected to provide universal access (100%) by 2023/24 and achieve 52% on-grid connections and 48% off-grid connections.
Figure 1. Structure of Rwanda Energy Sector
2.3. Rwanda Electricity Transmission Network and Distribution
Figure 2. Rwanda Electricity Transmission Network and Distribution, Source: REG [4]
3. Data Collection
Electricity supply of Rwanda is composed of domestic generation and the imported electricity from neighbor countries and regional shared power plants. The source of energy used is from the following sources: hydropower
Table 1. Power generation plants by 2018 [20]
ID Name Technology Capacity (MW)
1 Ntaruka Hydro 11.25
2 Mukungwa 1 Hydro 12.00
3 Nyabarongo Hydro 28.00
4 Gisenyi Hydro 1.20
5 Gihira Hydro 1.80
6 Murunda Hydro 0.1
7 Rukarara 1 Hydro 9.5
8 Rugezi Hydro 2.2
9 Keya Hydro 2.2
10 Nyamyotsi I Hydro 0.1
11 Nyamyotsi II Hydro 0.1
12 Agatobwe Hydro 0.2
13 Mutobo Hydro 0.2
14 Nkora Hydro 0.68
15 Cyimbili Hydro 0.3
16 Gaseke Hydro 0.582
17 Mazimeru Hydro 0.5
18 Janja Hydro 0.2
19 Gashashi Hydro 0.2
20 Nyabahanga I Hydro 0.2
21 Nshili1 Hydro 0.4
22 Musarara Hydro 0.45
23 Mukungwa 2 Hydro 2.5
24 Rukarara 2 Hydro 2.2
25 Nyirabuhombohombo Hydro 0.5
26 Giciye1 Hydro 4
27 Ruzizi 2 Hydro 12.00
28 Giciye2 Hydro 4
30 Jali Solar 0.25
31 GigaWatt/Rwamagana Solar 8.50
32 Nyamata Solar Solar 0.03
33 Nasho Solar PP Solar 3.30
34 Ruzizi 1 Hydro 3.50
35 Jabana 1 Diesel 7.8
36 Jabana 2 Diesel 20
37 Mukungwa Thermal Diesel 10
38 KSEZ Thermal Diesel 10
39 Birembo Thermal Diesel 10
40 Gishoma Peat 15
41 Rice Husk Biomass 0.07
42 KP1 Methane 3.6
43 Kibuye Gaz methane (Kivuwatt) Methane 26.4
Table 2. Current Power Generation/Electricity Mix in Rwanda [20] S/N Technology Installed Capacity(Mw)
1 Hydropower 47%
2 Solar 5%
3 Methane 14%
4 Thermal 27%
5 Peat 7%
4. Rwanda Renewable Energy
Technology Situation
It makes renewable energy technology in Rwanda up of five sub-technologies such as biomass, solar, peat, geothermal and hydropower. Biomass is the most used and dominates both the demand and supply sides of the Rwandan economy. Micro hydro-power constitutes a significant potential for the rural power supply with many areas having ample rainfall and most streams and rivers unexploited. Solar irradiation is high - between 4-6 kWh/m2/day - but diffusion is hampered by the high initial cost and limitations on high load usage. Biogas is promising for thermal energy need for farms and small institutions, especially considering many households that own cows and other livestock. The geothermal exploration in Rwanda is still at the geoscientific surface exploration stage. Gisenyi and Bugarama prospects are given priority for locating sites for exploratory wells. Currently, the total installed capacity to generate electricity in Rwanda is 218 MW from more than 40 power plants, mainly hydro. Hydropower plants in Rwanda contributed about 101.062 Mw in 2018, or about 50 percent of Rwanda’s energy use. An estimate of the potential for solar energy in Rwanda included the potential for on-grid and off-grid Photovoltaics (PV) and concentrating solar power (CSP). The solar power plant in Rwanda contributed about 12.02 Mw. Most Rwandans live in rural areas where traditional biomass, mainly wood fuel has remained the leading source of energy for cooking. The statistics show that biomass (mostly wood fuel) accounts for about 83% of the total energy consumption. The off-grid energy technologies are not connected to the national electricity grid and provide energy services to the differences households.
4.1. Hydropower Plant
Hydropower is the foremost energy resource in Rwanda utilized for power generation. The Hydropower Atlas has identified 70 hydro sites in the country with a combined capacity of 15 MW [19]. Over the last decade, Rwanda’s hydropower sector showed a tremendous progress. The overall installed capacity of power is about 218 MW. Hydropower makes up approx. 46.3% of the total installed
capacity. 21 hydropower plants are grid connected and accountable to 101 MW. They include the national and shared regional power plant. The hydropower plants are either publicly owned and operated, leased to private companies, or privately owned (IPP). There are currently 11 off-grid micro hydropower plants supplying isolated networks in Rwanda for a total capacity of 1.311 MW.
Figure 3. Current microgrid installations and designated off-grid areas [36]
4.2. Solar Energy Technology
Energy from the sun is called solar energy means that the solar energy is energy from sunlight. Solar energy is a type of renewable energy; it will never run out and sometimes called radiant energy. These are different kinds of radiant energy emitted by the sun. The most important is light infrared rays, Ultraviolet rays, and X- Rays. Today, satellite data shows that the territory of Rwanda is in the global zone where the daily global radiation (annual average) is between 4 and 6 kWh/m²/ day. The current average of solar radiation is about 4.5 kWh / m² / day for most of the country and it sunshine time per day is 8 hours, which make solar energy in Rwanda economically viable. The Government of Rwanda is targeting 100% electricity access by 2024 promoting the use of renewable energy, mostly on-grid and off-grid solar PV systems. Two solar PV plants namely GIGAWATT Global Solar Power (8.5 MW) and Jali Solar Power (0.25 MW) located in Rwamagana and Gasabo districts respectively are connected to the National Grid [8]. Households far away from the planned national grid coverage are encouraged to use Solar Photovoltaics (PVs) to reduce the cost of access to electricity. Rwanda’s total on-grid installed solar energy is 12.08 MW.
4.3. Biomass Energy Technology
[image:5.595.308.537.170.346.2]grown in water) and their derivatives. It includes forest crops and residues, crops grown especially for their energy content on “energy farms” and animal manure.
Biomass can be burned for heating and cooking, and eve n generating electricity. The most common source of biomass energy is from the burning of wood, but energy can also be generated by burning animal manure (dung), herbaceous plant material (non-wood), peat (partially decomposed plant and animal tissues), or converted biomass such as charcoal (wood that has been partially burned to produce a coal-like substance). Biomass can also be converted into a liquid biofuel such as ethanol or methanol. Biomass is also largely consumed for cooking, with wood used by rural households and charcoal by urban households [10].
The use of modern bio-energy systems in Rwanda started with the promotion of institutional and domestic biogas technology whereby as of June 2016, 10,216 households and 81 institutions were connected with biogas systems with provision of cooking energy, lighting energy, quality fertilizer, and employment creation opportunity [8]. Biogas systems installed in the schools and prisons have reduced firewood consumption by close to 60% and 40% respectively, along with significantly improved hygienic conditions and cost savings. Currently, 11 out of 14 prisons use biogas for cooking. This has reduced the costs of cooking in prisons by 50% in comparison to using electricity [12].
5. Findings and Data Analysis
In 2018, the total population are 12,501,156 million and the cumulative connectivity rate is 46.46% of Rwandan households including 35.13% connected to the national grid and 11.33% accessing through off-grid systems (mainly solar). The electricity produced in Rwanda is generated using different renewable sources namely hydro, solar and slow renewable resource (Peat). The 52.2% of the electricity supplied during the second quarter of 2018 is generated from hydro, 2.2% from solar energy and 0.2% from peat power plants. Most Rwandans live in rural areas where traditional biomass, mainly wood fuel has remained the leading source of energy for cooking. Rwanda's energy balance shows that about 85% of its overall primary energy
consumption is based on biomass (99% of all households use biomass for cooking) and 11% from petroleum products (transport, electricity generation and industrial use). The average monthly consumption per household on fuelwood is 1,930 Rwf. The first study is done on Rwanda’s peat study indicated that the country peat bogs contain up to 155 million tons of dry peat covering a combined area of 50,000 hectares. About 77% of peat reserves are near Akanyaru and Nyabarongo rivers and the Rwabusoro Plains. The pre-feasibility studies done on seven sites in 2013 indicated that there is potential for at least three of these sites suitable for developing small-scale peat energy generation of 15MW each [14]. In Rwanda, Hydropower generates about 47% of the nation's energy. This electricity can be used for heating such kettle, iron for clothes (repasser), electric cooker and cooling such a fridge. Currently, over 258,414 households have benefited access to electricity from solar energy through Independent Power Producers countrywide. Households located far away from the planned national grid coverage are encouraged to use Mini-grid Solar Photovoltaics (PVs) to reduce the cost of access to electricity. Solar Water Heater (SWH) systems use energy from the sun (solar radiation) to heat water that can be used for bathing as well as washing clothes and most typical household equipment. Solar water heater technology is simple, easy to install and connected to the existing water supply system. By using this technology, it can be reduced the dependence of electricity, fossil or biomass fuel and save money and improve the environment protection. So far, 2,464 SWHs have been installed in different households across the country. Peat is a relatively easy energy source but with potential environmental risks of disturbing the water cycle and reducing biodiversity. Rwanda also calls for a strategic and well-laid out plan to transition from wood fuel and charcoal to clean and more efficient cooking methods by providing more sustainable energy alternatives such as biomass pellets and Liquefied Petroleum Gas (LPG). The strategy also includes for modern agriculture and better forestry management methods to increase productivity.
[image:6.595.67.534.632.751.2]The renewable power capacity data are shown in the table 4 represents the maximum net generating capacity of power plants in Rwanda and other installations that use renewable energy sources to produce electricity.
Table 3. Renewable Energy technology and estimated potentials in Rwanda [21]
S/N Technology
Electricity generation mix (kW) Energy mix in power consumption (kWh) Current Share
(%) Potential Capacity Installed Share (%) Current Potential Consumption
1 Hydropower 52.2 400,000 101,062 52.2 375,551,845 -
2 Solar energy 2.2 12,060 12,060 2.2 13,937,961 4.5 kWh/m2 x day ̴ 5 peak sun hours
3 Peat 0.2 15,000 15,000
4 Biogas - 85% used for cooking and Heating
Table 4. Evolution of the renewable electricity capacity in Rwanda [15]
Technology Name Unit 2007 2008 2009 2010 2011 2012 2013 2014 2015 2016 2017
Hydropower MW 40.1 40.1 40.3 49.6 55.2 56.5 60.1 66.3 94.3 98.3 98.8
Solar energy
(Photovoltaic) MW 0.3 0.3 0.3 0.3 0.3 0.3 0.3 9 9.2 9.4 12.9
Bioenergy MW 0.8 0.8 0.8 0.8 0.8 0.8 0.8 0.8 0.8 0.8 0.8
Solid biofuels MW 0.8 0.8 0.8 0.8 0.8 0.8 0.8 0.8 0.8 0.8 0.8
Bagasse MW 0.8 0.8 0.8 0.8 0.8 0.8 0.8 0.8 0.8 0.8 0.8
Source: International Renewable Energy Agency
6. Conclusions and Future Work
Currently, 11.33% of Rwandan households are connected off-grid and 35.13% on grids. The Government target will be to increase the off-grid to achieve 100% connectivity in 2024. During the elaboration of the Second Economic Development and Poverty Reduction Strategy (EDPRS II), the Government of Rwanda took a clear policy decision to diversify the sources of electricity from traditional dominant grid to include even off-grid connections. Subsequently, households far away from the planned national grid coverage have been encouraged to use alternatively cheaper connections such as Mini-grids and Solar Photovoltaics (PVs) to reduce the cost of access to electricity whilst relieving constraints on historical government subsidies. The cost of installing an off-grid system depends on how much electricity needs to be produced. The cost of on-grid is higher at around $700 for each connection while that the off-grid is only $65 which is why it’s more advantageous for households to embrace off-grid solutions and Off grids are also efficient and easy to implement. The off-grid systems have a wide range of technologies such as a basic solar lantern that can charge a phone or radio to a solar home system that can light up entire house and power some homes appliances. The households (rural area) located far away from the national grid or those consuming insufficient electricity will be advised to get access through off-grid solutions such as mobisol, minigrids or solar PV solutions. In situations where there is the option of going on grid or off grid, cost and location will be the primary considerations. Biogas technology has promised for thermal energy need for farms and small institutions, especially considering many households that own cows and other livestock. Biomass is renewed, when you cut and replant it otherwise, we are destroying our environment. The rural population of the country uses firewood for meeting their cooking requirements. This reduces the national forest wealth and our forest area can be conserved by using biogas. The Government‘s Vision asks for a reduction of biomass consumption by 50% by 2020. Currently, there are a number of alternative fuels to Biomass; Biogas program is currently implemented as a suitable fuel for cooking. Liquefied Petroleum Gas (LPG) and Kerosene are potential alternatives, as well as pellets and briquettes that can be
used in cooking.
REFERENCES
[1] Wikipedia contributors, “Rwanda.” Wikipedia, The Free Encyclopedia, https://en.wikipedia.org/wiki/Rwanda (accessed July 26, 2018).
[2] De Dieu Uwisengeyimana, Jean, Ahmet Teke, and Turgay Ibrikci. “Current Overview of Renewable Energy Resources in Rwanda.” Journal of Energy and Natural Resources 5, no. 6 (2016): 92–97. doi:10.11648/j.jenr.2016 0506.13
[3] http://www.mininfra.gov.rw/index.php?id=generation [4] http://www.reg.rw/what-we-do/distribution/
[5] http://www.reg.rw/what-we-do/generation/hydro-power/ [6] [http://www.reg.rw/index.php/projects/generation/169-hydr
o-power]
[7] http://www.mininfra.gov.rw/index.php?id=79 [8] [ http://www.rura.rw/index.php?id=67]
[9] https://energypedia.info/wiki/Rwanda_Energy_Situation#Bi omass_Sector
[10]http://www.mininfra.gov.rw/index.php?id=85
[11]MININFRA, RURAL ELECTRIFICATION STRATEGY (RES), June, 2016.
[12]http://www.mininfra.gov.rw/index.php?id=85
[13] http://www.reg.rw/index.php/projects/generation/174-solar-energy
[14]http://www.mininfra.gov.rw/index.php?id=311 [15]http://www.mininfra.gov.rw/index.php?id=82 [16]IRENA, Renewable Capacity Statistics 2018
[17]https://energypedia.info/wiki/Rwanda_Energy_Situation [18]http://www.reg.rw/index.php/projects/biogas.
[21]http://www.mininfra.gov.rw/index.php?id=312 [22]http://www.reg.rw/what-we-do/generation/ [23]REG transmission master plan, April 2018.
[24]RURA (2018), Key statistics in electricity sub-sector in Rwanda.
[25]REG looks to off-grids to realise power generation, access targets, https://www.newtimes.co.rw/section/read/226747 [26]Renewable energy, power for sustainable future (Boyle) [27]MININFRA, “Rwanda Ministry of Infrastructure,” 2016.
[Online]. Available: htttp://www.mininfra.gov.rw. [Accessed 13 January 2016].
[28]B. K. Safari, “A review of energy in Rwanda,” Elsevier, vol. 14, no. 14, pp. 524-529, 2010.
[29]John Twidell and Tony Weir, Second edition, Renewable Energy Resources
[30]Yas_ar Demirel, Green Energy and Technology, http://www.springer.com/series/8059
[31]Prbir-Basu-Biomass-Gasification-and-Pyrolysis-Practical-D esign-and-Theory-2010
[32]MININFRA, “Rwanda Energy sector strategic plan,” Rwanda Ministry of Infrastructure, Kigali, 2015
[33]Quaschning, V., Understanding Renewable Energy Systems, James & James Earthscan Sterling, VA: Earthscan, London [34]AfDB. 2013. Rwanda Energy Sector Review and Action
Plan. The African Development Bank Group (AfDB). [35]https://waterportal.rwfa.rw/toolbox/470
[36]Towards universal energy access by 2020 in Rwanda, Ministry of Infrastructure, page 7
![Figure 2. Rwanda Electricity Transmission Network and Distribution, Source: REG [4]](https://thumb-us.123doks.com/thumbv2/123dok_us/8788553.908187/3.595.70.527.80.404/figure-rwanda-electricity-transmission-network-distribution-source-reg.webp)
![Table 1. Power generation plants by 2018 [20]](https://thumb-us.123doks.com/thumbv2/123dok_us/8788553.908187/4.595.74.527.95.727/table-power-generation-plants.webp)
![Table 2. Current Power Generation/Electricity Mix in Rwanda [20]](https://thumb-us.123doks.com/thumbv2/123dok_us/8788553.908187/5.595.308.537.170.346/table-current-power-generation-electricity-mix-rwanda.webp)
![Table 3. Renewable Energy technology and estimated potentials in Rwanda [21]](https://thumb-us.123doks.com/thumbv2/123dok_us/8788553.908187/6.595.67.534.632.751/table-renewable-energy-technology-estimated-potentials-rwanda.webp)
![Table 4. Evolution of the renewable electricity capacity in Rwanda [15]](https://thumb-us.123doks.com/thumbv2/123dok_us/8788553.908187/7.595.66.532.91.187/table-evolution-renewable-electricity-capacity-rwanda.webp)
