Mercury Determination by New Asymmetric Triazene
Ligand, 1-(2-Ethoxyphenyl)-3-(4-Nitrophenyl)Triazene
(ENT) ) with Partial Least-Squares Calibration
Method (PLS) Method
Salameh Azimi
1,*, Mohammadreza Sadeghi Moghaddam
21Faculty of Industrial and Mechanical Engineering, Qazvin Branch, Islamic Azad University, Qazvin, Iran 2Department of urban planning, Qazvin Branch, Islamic Azad University, Qazvin, Iran
*Corresponding Author: salamehazimi@gmail.com
Copyright © 2014 Horizon Research Publishing All rights reserved.
Abstract
Synthesis, characterization, spectrophotometric studies of three mercury (II) complexes of 1-(2-ethoxyphenyl)-3-(4-nitrophenyl) triazene (ENT) are reported in this article and it was characterized by means of NMR, FT-IR, UV spectroscopy and CHN analysis, then determination of Hg(II) was performed by spectrophotometric determination using chemo metric techniques and new triazen ligand which was prepared by us. The calibration graphs of individual components were linear in the ranges of 1 -5.25 mg·L-1. The root means square errors of prediction (RMSEP) were 4.4 х10-3 The proposed method are simple, fast, inexpensive and do not need to any separation or preparation method.Keywords
Synthesis, Triazen Ligand, Spectrophotometric Determinatio Chemo Metric Techniques, Mercury1. Introduction
The first extensive investigation of the coordination chemistry of a triazene derivative (1,3-diphenyltriazene) was carried out in 1887 by Meldola [1]. The study of transition metal complexses 1, 3-diaryl triazenide ligands has increased greatly in the past few years, because of their potential reactivity in relation to their coordination modes [2-4].
Over the last three decades there has been increasing global concern over the public health impacts attributed to environmental pollution, in particular, the global burden of disease [5].
Mercury is one of the most toxic elements and a threat to wild life [5], therefore determining and analyzing this element is so critical.
Several methods have been proposed for the individual or
simultaneous determination of some heavy metals [6, 7]. Several techniques such as atomic absorption [8-12], inductively coupled plasma [13, 14], solid and liquid extraction [15, 16] have been used for mercury determination in different samples.
Spectrophotometry[8]1-(2-Ethoxyphenyl)-3-(4-nitrophen yl) triazene (ENT) reacts with several metal ions to form colored metal complexes. This chelating agent has been used to determine several metal ions by ultraviolet-visible (UV-Vis) spectrophotometry.
In this study a new asymetic triazen ligand was synthesized and characterized with several different methods then chelating agents of the ligand with three kinds of mercury salts were examined then PLS was employed as a simple method for determination of mercury.
2. Experimental
2.1. Reagents
Reagent grade mercury (II) nitrate, acetate and chloride, acetonitril and all other reagents used were supplied by Merck chemical company. 1-(2-ethoxyphenyl) -3-(4-nitrophenyl) triazene (ENT) ligand (L) was prepared which will be discussed in next section.
2.2. Synthesis and Characterization of ENT
containing 0.35 g (5 mmol) in 10 ml of water was added during 15 min under stirring solution. Afterwards, 0.68 ml (5 mmol) of 2-ethoxyaniline (1.06 g mL−1) was added drop wise with vigorous stirring for a period of 30 min to this mixture. Finally, a solution containing 14.76 g (0.18 mol) of sodium acetate in 45 ml of water was added and stirred for 45 min. The orange-colored product was filtered and dissolved in diethyl ether. After the evaporation of diethyl ether, a purified sharp pale orange powder, which has a melting point of 101–102 °C, was produced (yield, 72%).
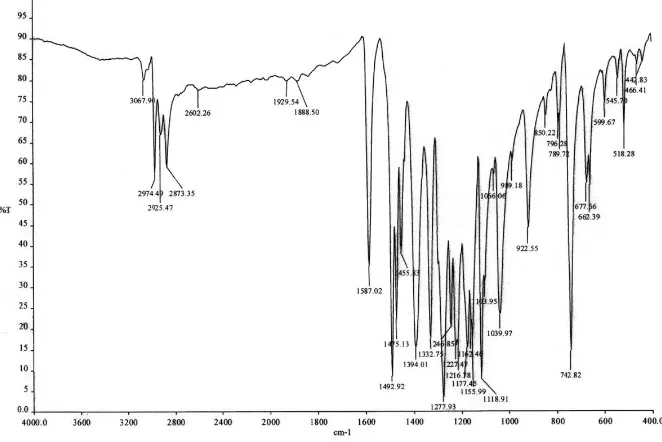
Infrared and 1H NMR spectra and CHN analysis, were confirmed the ENT structure. IR (KBr): 3389, 3325, 2984, 1600, 1519, 1468, 1343, 1253, 1209, 1113, 1045, 894, 739 cm-1.
1H NMR (DMSO): δ 1.37 (CH3, 3), 4.13 (CH2, 2), 6.94-8.06(phenyl protons, 8), 12.89 (NH, 1).
CHN: (C14H14N4O3) C: 58.66%, H: 4.82%, N: 19.52%.
Figure 1. 1-(2-ethoxyphenyl)-3-(4-nitrophenyl) triazene (ENT)
2.3 Physical Measurements
Elemental (C, H, N and O) analyses were made on a Perkin-Elmer Model automatic analyzer.
Infrared (IR) spectra were recorded on Perkin-Elmer Model 843.
NMR spectra were recorded on a Bruker Avance 300
spectrometer, and all chemical shifts are reported in δ units downfield from Me4Si.
UV–vis absorption spectra were recorded using the double-beam in-time spectrophotometer (Perkin-Elmer model Lambda 25, U.S.A.) with a 1 cm quartz cell, a scan rate of 400 nm/min and slit width of 2 mm and the temperature of the cell holder was maintained at 25 ◦. FT-IR spectrum of ENT is shown in figure 2.
3. Results and Discussion
3.1. Solution Studies
The electronic absorption spectra of the ligand L in the presence of the increasing concentration of mercury (II) ions in acetonitril at room temperature are shown in Fig.2. Fig3 and Fig4. In a typical procedure, 2.0 ml of ligand solution (5.0 × 10⁻⁵ M) in acetonitrile was placed in the spectrophotometer cell and the absorbance of the solution was measured. Then a known amount of the concentrated solution of Hg (II) nitrate, Hg(II) acetate and Hg(II) choloride in acetonitrile (5.0 × 10⁻³ M) were added in a stepwise manner using a 5µl Hamilton syringe separately. The absorbance spectrum of the solution was recorded after each addition. Fig.3. shows that, the absorbance band of ENT at wavelength 393 nm decreases and at 402 nm increases by increasing in metal ion concentration and it reveals distinct inflection points at a metal-to-ligand molar ratio of about 1 emphasizing the formation of a 1:1 complexes. The conditional formation constants was evaluated as log K =4.88 ± 0.003 by using a non-linear least-squares curve fitting program KINFIT.
[image:2.595.138.469.512.733.2]Figure 3. (a) Electronic absorption spectra of ligand [ENT] in acetonitril (5.0 × 10_5 M) in the presence of increasing concentration of Hg (II) acetate at room temperature. (b) Corresponding mole ratio plot at 450 nm.
Figure 4. (a) Electronic absorption spectra of ligand [ENT] in acetonitril (5.0 × 10_5 M) in the presence of increasing concentration of Hg(II) nitrate at room temperature. (b)Corresponding mole ratio plot at 438 nm.
[image:3.595.114.501.299.480.2] [image:3.595.121.493.515.704.2]Fig4, shows that, the absorbance band of ENT at wavelength 344 nm decreases and at 350 nm increases by increasing in metal ion concentration of Hg (II) nitrate and it reveals distinct inflection points at a metal-to-ligand molar ratio of about 0.5 emphasizing the formation of a 1:2 complex. The conditional formation constants was evaluated as log K =4.93 ± 0.003 by using a non-linear least-squares curve fitting program KINFIT.
Fig5 shows that, the absorbance band of ENT at wavelength 270 nm decreases and at 290 nm increases by increasing in metal ion concentration of Hg (II) chloride and it reveals distinct inflection points at a metal-to-ligand molar ratio of about 0.5 emphasizing the formation of a 1:2 complex. The conditional formation constants was evaluated as log K =4.56 ± 0.001 by using a non-linear least-squares curve fitting program KINFIT.
Solution studies show that our ligand chelated to mercury nitrate better than the other mercury salts, therefore mercury nitrate was selected for further studies.
3.2. Extraction Procedure
Thirty mixtures with different mercury concentration and triazen ligand were selected as the calibration set. Their composition was randomly designed for obtaining more information from calibration procedure. Under this condition, the Calibration model was obtained. The calibration model was validated with 5 synthetic mixtures containing the metal ion in different concentrations. The results obtained are given in Tables 1 and 2. Each solution was prepared to contain combinations of the concentration levels 0.5-10 mg/L of mercury. Twenty seven of these solutions were used as a calibration set for PLS model development. Another 5 calibration mixtures, not included in the previous set were employed as an independent test set called the prediction set. To select the number of factors in the PLS algorithm, the leave one out cross-validation method, was used [20]. The prediction error was calculated for each component in the prediction set. The optimum number of factors (latent variables) was determined by computing the prediction error sum of squares (PRESS) for different numbers of latent variables (1-10 latent variables).
Table 1. Characteristics of calibration graphs for the determination of mercury by the proposed method
Analyt slope Intercept Correlation coefficient Linear range (mg/L)
Limit of detection (mg/L)
Hg 0.032 0.01 0.995 1 -5.25 0.8
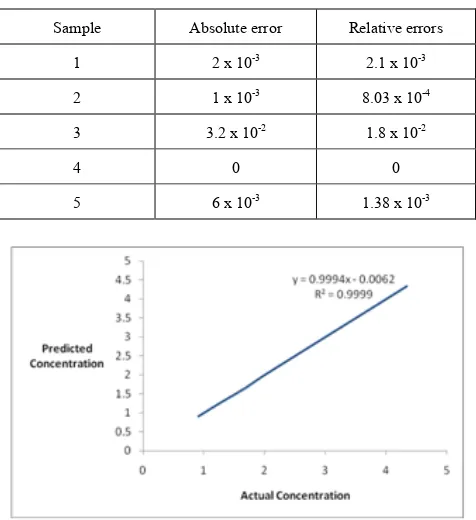
[image:4.595.313.549.105.213.2]Fig. 6 shows a plot of PRESS against the number of factors for each numbers of components. The 7 factors were selected as the optimum number of factors and the model with these numbers of factors was used for prediction of the test samples (Table 2), Table 3 shows the relative and absolute errors between the actual and prediction concentration by PLS model.
Figure 7 is shown the relativity between actual concentration and the predicted one by the model.
Figure 6. Plot of PRESS against the number of factors
Table 2. Composition of prediction set, their predictions by PLS model and statistical parameters for the system
Sample concentration(mg/L) Actual concentration(mg/L) Prediction
1 0.910 0.912
2 1.245 1.244
3 1.700 1.668
4 2.010 2.010
[image:4.595.314.553.265.374.2]5 4.341 4.335
Table 3. Absolute and relative errors by PLS model.
Sample Absolute error Relative errors
1 2 х 10-3 2.1 х 10-3
2 1 х 10-3 8.03 х 10-4
3 3.2 х 10-2 1.8 х 10-2
4 0 0
5 6 х 10-3 1.38 х 10-3
Figure 7. Predicted concentration versus real concentration for Hg (II) ion in the prediction set
4. Conclusion
[image:4.595.313.551.392.652.2]reaction between triazen ligand and mercury ions, in comparison of three different formation constants of three mercury salts we can conclude that mercury nitrate has the highest interaction with our triazen ligand because of its highest formation constant, mercury nitrate and choloride gave us the ML2 complexes but mercury acetate gave us ML complex.
REFERENCES
[1] R.Meldola, F.W.Streatfield. J. Chem. Soc. 52 (1887) 434. [2] K.Verize, G.Van Koten. Comprehensive Coordination
Chemistry, Pergamon Press, Oxford, 1987.
[3] M.K.Rofouei, M.Hematyar, V.Ghoulipour. J.A.Gharamaleki, Inorg.Chim. Acta 362 ,3777, 2009.
[4] J.J.Nuricumbo-Escobar,Campos-Alvarado.C, Rocha-Alonso.F, Mol. Struct. 928, 85, 2009.
[5] Salameh Azimi, Mohammadreza Sadeghi Moghaddam, Environment and Ecology Research 1(1): 12-20, 2013
[6] Azimi Salameh, Rofouei Mohammad Kazem and M.
Sharifkhani Samira, Journal of Materials Science and Engineering B 1. 895-900, 2011.
[7] H.Khani.H, M.K.Rofouei, P.Arab, Z.Vafaei, Journal of Hazardous Materials 183, 402, 2011.
[8] H. Khajehsharifi, E. Pourbasheer, Genetic-algorithm-based wavelength selection in multicomponent spectrophotometric determination by PLS: application on ascorbic acid and uric acid mixture, Journal of the Chinese Chemical Society 55, 163-170, 2008.
[9] B. Izgi, C.DemirU, ¸S.G¨u¸cer, Application of factorial design for mercury determination by trapping and graphite furnace atomic absorption spectrometrySpectrochimica Acta Part B 55, 971-977, 2000.
[10] A.Q. Shah, T.G. Kazi, J.A. Baig, H.I. Afridi, G.A. Kandhro, M.B. Arain, N.F. Kolachi, S.K. Wadhwa, Total mercury determination in different tissues of broiler chicken by using cloud point extraction and cold vapor atomic absorption spectrometry, Food and Chemical Toxicology, 48, 1, 65-69, 2010.
[11] E. Stanisz, J. Werner, H.Matusiewicz, Mercury species determination by task specific ionic liquid-based ultrasound-assisted dispersive liquid–liquid microextraction combined with cold vapour generation atomic absorption spectrometry, Microchemical Journal, 110, 28-35, 2013. [12] A. de Jesus, A.V. Zmozinski, M. A. Vieira, A. S. Ribeiro, M.
M. da Silva, Determination of mercury in naphtha and petroleum condensate by photochemical vapor generation atomic absorption spectrometry. Microchemical Journal, 110, 227-232, 2013.
[13] N. Rey-Raap, A. Gallardo, Determination of mercury distribution inside spent compact fluorescent lamps by atomic absorption spectrometry. Waste Management, 32, 5, 944-948, 2012.
[14] S.Samuel. A.de Souza, C.Dobal, F. Barbosa Jr. A simple method for methylmercury, inorganic mercury and ethylmercury determination in plasma samples by high performance liquid chromatography–cold-vapor-inductively coupled plasma mass spectrometry. Analytica Chimica Acta, 761, 11-17, 2013.
[15] J. Hellings, S.B. Adeloju, T.V. Verheyen, Rapid determination of ultra-trace concentrations of mercury in plants and soils by cold vapour inductively coupled plasma-optical emission spectrometry Microchemical Journal, 111, 62-66, 2013.
[16] E. Stanisz, J. Werner, H. Matusiewicz, Mercury species determination by task specific ionic liquid-based ultrasound-assisted dispersive liquid–liquid microextraction combined with cold vapour generation atomic absorption spectrometry. Microchemical Journal, 110, 28-35.2013. [17] M. R. Jamali, A. Firouzjah, R. Rahnama, Solvent-assisted
![Figure 3. (a) Electronic absorption spectra of ligand [ENT] in acetonitril (5.0 × 10_5 M) in the presence of increasing concentration of Hg (II) acetate at room temperature](https://thumb-us.123doks.com/thumbv2/123dok_us/8787871.907855/3.595.121.493.515.704/figure-electronic-absorption-acetonitril-presence-increasing-concentration-temperature.webp)