33
III. RESEARCH METHODS
This chapter discusses research design, population and sample, research procedure, data collecting technique, try out, scoring system, and hypothesis test as elaborated in the following section.
3.1. Research Design
In conducting this research, the researcher has used a co-relational study of ex post facto design. According to Setiyadi (2006:144) ex post facto design is the design to search the cause-effect correlation, moreover, the researcher does not carry out of a treatment nor an experiment of any kind to subjects, but the data is collected after the fact.
There are two types of ex post facto research design, “co-relational study involves one group and casual comparative study involve two groups” (Setiyadi. 2006:144). Since this research involved one class only, co-relational study was used with the formula as follows :
T1 T2
34
Whereby, in collecting the data, the researcher has given reading comprehension test in two types of text (T2) to see the students’ reading comprehension ability. After that, she distribute the questionnaire (T1) in order to know the students’ learning strategies employed by the language learners in comprehending reading text. Then, the data from questionnaire (T1) is correlated with the data from reading comprehension (T2).
3.2. Population and Sample
3.2.1. Population
The population of this research is the second grade of SMP Negeri 1 Batanghari in 2012-2013 academic year. There are six classes of the second grade in that school with the total of students in second grade are 167 students. The number of the students of each class are about 30 until 25 students.
3.2.2. Sample
35
3.3. Research Procedure
This passage has concerned more about the ways or steps the data are collected beginning from the preparation to analyzing the data.
3.3.1. Determining the Research Problem
Based on the researcher’s background of problem in the first chapter, it is formulated that is there any correlation between students’ learning strategies and text types in students’ reading comprehension; and which learning strategy is mostly applied by the students in reading.
3.3.2. Determining the Population and then Selecting the Sample
The populations of this research is the second year of SMPN 1 Batanghari and for the sample just one class has been chosen randomly.
3.3.3. Administering the Try-Out Test
36
validity. The aim of try-out is to determine the quality of the test used as the instrument of the research, and to determine which item should be revised for the test.
3.3.4. Administering the Test
The research has been held in two meeting. The first has been used in conducting reading comprehension test 1 and test 2, the second has been used in conducting questionnaire of learning strategies.
3.3.5. Analyzing the Data
The results of reading comprehension tests have been analyzed by using Pearson Product Moment Correlation of SPSS for Window version 16.0 to find out whether there is correlation between the two groups and determining the strategy which is mostly applied by the students in reading.
3.4. Data Collecting Technique
The instruments of the research are reading comprehension test and questionnaire.
3.4.1. Reading Comprehension Test
37
to correlate the students’ learning strategy and text types in students’ reading comprehension. Each text type consists of 20 multiple choices: a, b, c, and d.
3.4.2. Questionnaire
Questionnaire of reading strategy is used to gather information about the students’ opinion in the strategy that are used by students’ in reading.
The questionnaire which has been given for the students was modified from “Language Learning Strategy Questionnaire” (Setiyadi, 2006) which was modeled specially to search learning strategies employed by learners per skill. The researcher used Language Learning Strategy Questionnaire for reading skill only.
The researcher gave a set of questionnaire in order to know the students’ learning strategies in studying English especially in reading. She has modified Setiyadi’s questionnaire (2006) and arranged the questionnaire which classified into three learning strategies: metacognitive, cognitive, and social. The questionnaire consisted of 30 items that has been prepared based on the indicators of metacognitive, cognitive, and social strategies, which has determined which items designed to measure the three strategies. Each item has a numerical value, for example:
1 = I never do it
38
3.5.Try Out
Before administering the reading comprehension test to the subject class, the researcher has conducted reading comprehension try out tests in VIII.E which consisted of 38 students. The instrument contained 30 questions of reading comprehension with four optional alternative answers for each (A, B, C, and D), one was the correct answer and the rest were distracters. The highest score in reading comprehension test 1 (descriptive text) is 93 and the lowest score is 27 with the mean score is 56,62. While, the highest score in reading comprehension test 2 (recount text) is 87 and the lowest score is 30 with the mean is 57,92. Furthermore, the medians are 51,50 in reading comprehension test 1 and 57,00 in reading comprehension test 2. (See Appendices 10 & 11)
The reading comprehension try out test is very important since a good test should meet the criteria in the term of level of difficulty, discrimination power, reliability as well as validity, as they will be elaborated in the following section:
3.5.1. Validity
A. Validity of Reading Comprehension
39
Face validity will not be used because it only concerns with the layout of the test while the criterio-related validity is concerned with measuring the success in the future, as in replacement test (Hatch and Farhady. 1982:251).
a. Content Validity
Content validity is the extent to which a test measure a representative sample of subject matter content, the focus of content validity is on the adequacy of sample and not simply on the appearance of the test (Hatch and Farhady, 1982:251). This means, the items of the test should represent the material that have been taught. The test has based on the guideline of teaching English for the second year student of Junior High School and the learners’ handbook.
b. Construct Validity
Construct validity is concerned with whether the test is actually in line with the theory of what it means to know the language (Shohamy, 1985:74). It means that the test items should really test the students or test items should really measure the students’ ability in reading comprehension.
40
Table 1. Table Specification of Reading Comprehension Test 1 (Descriptive Text)
No. Reading Specification Item Number Percentage
1 Determining main idea 1,3,8,11,16,23,30 23% 2 Finding detail information 2,4,9,10,12,17,18,20,26,28,29 37%
3 Finding references 7,14,24 10%
4 Finding inferences 6,15,21,22,27 17%
5 Understanding vocabularies 5,13,19,25 13%
[image:8.595.118.515.226.314.2]Total 30 100%
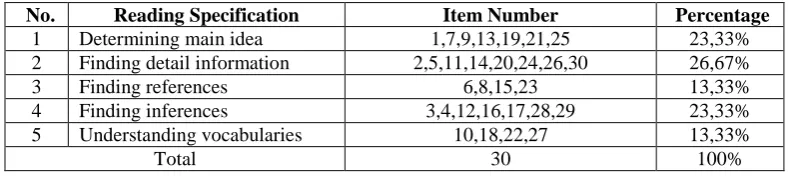
Table 2. Table Specification of Reading Comprehension Test 2 (Recount Text)
No. Reading Specification Item Number Percentage
1 Determining main idea 1,7,9,13,19,21,25 23,33% 2 Finding detail information 2,5,11,14,20,24,26,30 26,67%
3 Finding references 6,8,15,23 13,33%
4 Finding inferences 3,4,12,16,17,28,29 23,33% 5 Understanding vocabularies 10,18,22,27 13,33%
Total 30 100%
B. Validity of Questionnaire
The validity of questionnaire is also measured to find if the componets were proportionally suitable and related to the relevant theories of learning strategies. According to Hatch and Farhady (1978), there are least two validity should be fulfilled; content and construct validity. Since the questionnaire has modified from “Language Learning Strategy Questionnaire” (Setiyadi, 2006) which was modeled specially to search learning strategies employed by learners per skill. The researcher used Language Learning Strategy Questionnaire for reading skill only. The following table describes the aspects of learning strategies in questionnaire.
Table 3. Table Strategy Classification of The LLSQ
Strategies Reading
Cognitive Item no. 1-10
Metacognitive Item no. 11-20
Social Item no. 21-30
41
The student’s choices or preferences on the item selected will indicate their group, whether they belong to cognitive, metacognitive, and social groups. For example: item 1-10 belong to cognitive, item 11-20 belong to metacognitive, and item 21-30 belong to social. The result of the questionnaire validity can be seen on Appendix 23.
3.5.2. Reliability
A. Reliability of Reading Comprehension
Reliability is simple consistency of a test. In other words, how far it can measure the subject at separated time, but it shows the same result relatively (Setiyadi.2006:113). Reliability can be defined as the extent to which a test produce consistent results when administered under similar condition (Hatch and Farhady.1982:244). Reliability of the tests is estimated by using split-half method. To measure the coefficient of the reliability between odd and even group, this research used the person product moment formula as follows:
(∑ ) (∑ ) (∑ )
√* ∑ (∑ ) + * ∑ (∑ ) +
Where :
r xy : coeficient of reliability between X variable and Y variable
(Product Moment Correlation formula) N : numbers of the students
42 x2 :square of X
y2 : square of Y
Then, the researcher has used “Spearmen Bown’s Prophecy formula” (Hatch and Farhady,1982; 247) to know the coefficient correlation of whole items. The formula as follows:
Where:
rk : the realiability of the test
r1 : the reliability of half test (Hatch and Farhady.1982:247)
The criterian of reliability are: 0.80 – 1.00 : very high 0.60 – 0.79 : high 0.40 – 0.59 : average 0.20 – 0.39 : low 0.0– 0.19 : very low
43 B. Reliability of Questionnaire
The researcher has collected the data by using the quantitative one. First of all, the result of the questionnaire was scored based on Likert Scale. The score ranged from 1-5. To make sure that the data gathers from the questionnaire had been reliable, she used reliability analysis based on Cronbach Alpha Coefficient of SPSS for window. Cronbach Alpha Coefficient is the most common used to measure the consistency among indicators in the questionnaire which was counted based on the correlation between each items. The Alpha ranged from 0 to 1. The higher alpha, the more reliable the items of the questionnaire (Setiyadi,2006). The result shows that the reliability of questionnaire were very high reliability, 0.930. (See Appendix 22)
3.5.3. Level of Difficulty
Level of difficulty relates to “how easy of difficult the item is from the point of view of the students who took the test. It is important since test items which are too easy (that all students get right) can tell us nothing about differences within the test population” (Shohamy, 1985:79). Moreover, Heaton (1975:182) states that the difficulty level of an item shows how easy or difficult that particular item done by the participants. Level of difficulty is generally expressed as the fraction (or percentage) of the students who answered the item correctly. It is calculated by the following formula:
LD = N
44 Where:
LD : level of difficulty
U : the number of upper group students who are answer correctly L : the number of lower group students who are answer correctly N : the total number of students who take the test
The criteria are:
<0.30 : difficult 0.30-0.70 : good
>0.70 : easy (Shohamy, 1985; 79)
The researcher has found that there were 4 items (13%) were difficult, 20 items (67%) were good, and the rest 6 items (20%) were easy in reading comprehension test 1. Then in reading comprehension test 2, the researcher has found that there were 1 item (3%) was difficult, 20 items (67%) were good, and the rest 9 items (30%) were easy. However, the researcher did not omit all the difficult and easy items, but only omit some items which were very difficult and very easy items.
45
3.5.4. Discrimination Power of the Test
Discrimination power refers to “the extent to which the item differentiates between high and low level students on that test. A good item according to his criterion is one in which good students did well and bad students failed” (Shohamy, 1985:81).
The formula is used :
DP =
( )
Where:
DP = discrimination power
Upper = proportion of “high group” students getting the item correct Lower = proportion of “low group” students getting the item correct N = total number of students (Shohamy, 1985:82)
The criteria are: 0.00-0.20 = Poor 0.21-0.40 = Satisfied 0.41-0.70 = Good 0.71-1.00 = Excellent
(Negative)= bad items (should be omitted) (Heaton,1975: 182)
46
the table and criteria on Appendix 7 of reading comprehension test 2, the researcher concluded that 6 items (20%) were no discrimination and the rests were possitive discrimination 24 items (80%) where 9 items were poor, 15 items were satisfactory, 5 items were good, and 1 item was bad.
After counting the level of difficulty and discrimination power of each item, the researcher found that 10 of 30 items could not meet the criteria of good test and should be dropped in both of reading test. The items of reading comprehension test 1 were numbers 1, 4, 9, 10, 12, 16, 19, 22, 23, and 25, while in reading comprehension test 2 were numbers 1, 2, 8, 10, 12, 14, 20, 25, 26, and 29. (See Appendices 6 and 7)
3.6. Scoring System
In scoring the result of students’ test, the researcher has used Percentage Correct (Lyman, 1971:95). The percentage correct score was used in reporting the result of classroom achievement tests. The researcher has calculated the result of the test by using this formula:
X%c
=
100(Lyman, 1971:95)
Where :
X%c = percentage of correct score
R = number of right answers
47
3.7. Hypothesis Test
To conclude a possible correlation between learning strategies and text types in students’ reading comprehension, the researcher has used the criterion of the hypothesis acceptance. To determine whether the first hypothesis is accepted or rejected, the following criteria for acceptance:
H0= r value < r table
H1=r value >r table
Notes:
H0 : There is no correlation between students’ learning strategies and text
types in students’ reading comprehension. We can accept this hypothesis if r value is lower than r table.
H1 : There is a correlation between students’ learning strategies and text types
in students’ reading comprehension. We can accept this hypothesis if r
value is higher than r table.
Setiyadi (2006: 167) states that coefficient correlation is always between -1 up to +1. The coefficient correlation can be seen as follow: