Breast Tumor Localization Using Simultaneous
Perturbation Stochastic-Neural Algorithm
Ahmad AbdulSadda
Communication Department, Al Najaf Technical College, Foundation of Technical Education ∗Corresponding Author: abdulsad@msu.edu
Copyright c⃝2013 Horizon Research Publishing All rights reserved.
Abstract
Many impalpable or occult breast cancers cannot be localized using imaging techniques like mam-mography and ultrasound. An accurate localization of the tumor is, however, essential to guide the surgeon to the lesion, and ensure its correct and adequate removal with satisfactory excision margins. Current breast tumor localization techniques are invasive and often result in a cosmetic disfigurement. In this paper, we use the ultrawide band radar-based microwave breast imaging technique to non-invasively localize (impalpable) tumors in the breast. We consider four clinically important lesion features: location, size, depth and spatial orientation within the breast. A comparison of the energy of the received signal from healthy and cancerous breasts exhibits some remarkable differences in some frequency bands. We, therefore, use the energy spectrum of the receiving antenna signal decomposed by wavelet transform as the input to a Simultaneous Perturbation Neural Network (SPNN) classifier. Fur-thermore, we determine the optimum structure and gains of the SPNN, in terms of optimum initial weights and optimum number of nodes in the hidden layer. We use CST Microwave Studio to simulate a data set of 1024 cancer cases with various tumor location, size, depth and direction inside the breast. Our results show that the proposed algorithm gives accurate localization of the breast lesion, and possesses a high sensitivity to small tumor sizes. Additionally, it can accurately detect and classify multiple tumors with short learning and testing time.Keywords
Breast Cancer Localization, Radar-based Microwave Breast Imaging, Wavelet Decomposition, Simultaneous Perturbation Stochastic Analysis(SPSA), Neural Networks1
Introduction
A complete understanding of the distribution of tumor before therapy is a key factor in managing any case of advanced breast cancer. This is particularly true if pre-operative chemotherapy is used in an attempt to allow breast preservation [1]. The key to surgical planning for
breast conservation is tumor localization. Impalpable or occult breast cancers are being found with increasing frequency as microcalcifications, opacities or parenchy-mal distortions. If the tumor shrinks to 50% or more after chemotherapy or if the tumor shrinks to less than 2 cm, then the surgeon would need an accurate guide to the lesion in order to remove it from the breast with sat-isfactory excision margins, and be well tolerated by the patient. The goal in definite local therapy is to obtain tumor free margins of 1 cm in all dimensions around the residual tumor or calcifications [1].
con-tour and result in a poor coregistration of US data with laser data. Moreover, breast compression is likely to cause a radial movement of the tumor, thus distorting the results of the coregistration.
In this paper, we propose a new noninvasive tumor localization method based on the ultrawide band mi-crowave backscatter technique. We use the wavelet de-composition to compress while enhancing the backscat-tered signal’s signature in the frequency domain, and an optimized simultaneous perturbation neural network for accurate tumor localization. Microwave imaging is an al-ternative imaging method for detecting breast cancer [5]. It is based on the electrical properties of the breast tis-sues. Cancerous tissues exhibit electrical characteris-tics that show significant and consistent contrast with healthy breast tissues. Cancer detection with microwave imaging is based on this contrast in electrical proper-ties. Ultra wideband radar-based microwave imaging uses an antenna to highlight the breast with low-power ultra wideband pulses of microwave energy. The scat-tered energy is received by a receiving antenna. The early part of the received signal contains the skin-breast interface response, whereas the late-time response con-tains the backscattered signal from inside the breast, and might contain possible lesions [5]. The received signal, however, has a low resolution due to clutter or various healthy tissue backscattering. It is therefore difficult to reconstruct the fine characteristics, e.g., location, depth, size, and direction of a detected lesion in the breast.
So far, previous work in ultra wideband microwave imaging has focused on tumor detection and breast seg-mentation into healthy tissue and abnormal lesions. In particular, breast cancer detection using neural net-works has been described by many researchers [5–8]. Al-Shenawee’s group [6–8] showed the applicability of artificial neural networks to breast cancer detection us-ing radar-based microwave imagus-ing. Specifically, they were able to detect tumors by using an estimate of the dielectric permittivity of the breast. However, they nei-ther provided details about the neural network structure nor tried to optimize its design.
In this paper, we propose to localize breast lesions in terms of their (i) location, (ii) size, (iii) depth, and (iv) spatial orientation within the breast. Spatial orientation of the tumor with respect to the nipple may illustrate ductal extension of tumor, and this factor may have an influence on the shape and volume of the excised speci-men. We found that there are remarkable differences in specific frequency bands between healthy and tumor tis-sues. We foster this difference in the frequency domain for tumor localization by using the wavelet transform of the received signal’s energy to obtain a discriminative feature vector for the neural network classifier. An im-portant byproduct of the wavelet decomposition is the compression of the total number of input data to few wavelet coefficients. In order to avoid the common neu-ral network problems of local minima, convergence, and overfitting of the data, we use the simultaneous pertur-bation stochastic approximation (SPSA) algorithm to select the optimum number of hidden nodes and the op-timum initial weights for the network.
The rest of the paper is organized as follows: In Sec-tion 2, we present the breast model that we will use in
Tumor Receiving antena
Transmiting antena Breast
y
[image:2.595.316.541.65.259.2]x
Figure 1. Breast model with transmitting and receiving anten-nas.
our simulations to assess the performance of the pro-posed algorithm. The extraction of the wavelet feature vector index is presented in Section 3. Section 4 in-troduces the simultaneous perturbation stochastic- neu-ral network and discusses the tumor classification and characterization algorithm and it addresses the exten-sive testing procedure and computes the performance of the proposed technique. Concluding remarks and future work are discussed in Section 5.
2
The Breast Model:
Problem
Formulation
Following the work by El-Shenawee et al [6], we model the breast as a homogenous region, which can possibly contain one or multiple lesions. In particular, our model ignores the skin-breast interface since it has been shown that its effect reduces to a dc level difference in the power of the received signal [8]. The transmitting antenna op-erates at a frequency of 6 GHz. This frequency has been determined by trial and error in order to determine the best radiation pattern [9]. To receive adequate signal at the pickup location without exceeding the specified radiation safety limits, an array of three patch antennas was designed to focus the main beam in the direction of the tumor. The distance between the breast and the antenna array is set to 2 cm with total feeding power of 300mW. The breast cancer model with the antenna po-sition is described in Fig. 1. The received signal carries information about the tumor status inside the breast, and is related, through the Maxwell equations, to the dielectric permittivity of the breast [7].
In our breast model, we take into account the depen-dence of the relative dielectric permittivity of the breast, ϵr, on the frequency by using the following first-order
Debye dispersion formula: ϵr=ϵ∞+
ϵs−ϵ∞
1 +ω2τ2, (1)
Whereϵsandϵ∞are the space permittivity, and the high
an-Figure 2. Time-domain measurements of the received signal for a healthy and cancerous breasts.
gular frequency, andτ is the time constant. The values of the Debye parameters for normal and cancerous tis-sues have been determined experimentally in [6]. Figure 2 shows an example of the time domain measurement of the received signal for a healthy and cancerous breasts.
3
Wavelet-based Feature Vector
Even though the response signal of the breast to an ultra wideband microwave frequency can be easily mea-sured using patch antennas [9], the raw received signal cannot be used directly to fully identify the abnormal lesions within the breast due to the high amount of clut-ter from healthy tissues. An appropriate representative index vector has to be constructed from the received signal, and used for tumor characterization and classi-fication. A comparison of the energy of the received signal from healthy and cancerous breasts exhibits some remarkable differences in specific frequency bands. This is because tumors will suppress or enhance certain fre-quency components of the received signal, and conse-quently cause energy increase or decrease of the received signal. Therefore, the energy of the received signal con-tains information on abnormal lesions. Additionally, the energy variation of one or several frequency components of the signal can indicate a special characteristic of the lesion. In order to extract the tumor information from the breast response signal, we first decompose the sig-nal into multiple sub-sigsig-nals in various frequency bands using the wavelet decomposition as follows
S0,0[n] = 2∑k−1
j=1
Sk,j[n], n= 0,1,· · · , N−1, (2)
Where S0,0[n] denotes the sampled received signal of
lengthN, andSk,j[n] is the sub-signal with orthogonal
frequency band and k indicates the layer number of the tree structure of the wavelet decomposition. The energy of thejth order sub-signals can be expressed as
Uk,j= N
∑
n=1
|Sk,j[n]|2. (3)
Assuming that the energy of the jth-order sub-signals
of the healthy and cancerous tissues are Uh
k,j and U c k,j
respectively, the wavelet index vector can be constructed as follows:
Vd= [v1, v2, , v2k−1]T = [1−
Uk,c1
Uh k,1
,1−U
c k,2
Uh k,2
,· · · ,1−U
c k,2k−1
Uh k,2k−1
]T (4) The elements of different index vectors not only indicate the differences between healthy and cancerous tissues, but also suggest the differences between various lesion types. We will use the energy vector as the input feature vector to the genetic neural network classifier [10].
4
Optimum design of the neural
network using the
Simultane-ous perturbation algorithm
4.1
Simultaneous
perturbation
algo-rithm
Stochastic approximation (SA) represents an impor-tant class of search algorithms used in error function minimization. Many well-known techniques are applied to the problems of minimizing loss functions or root finding with noisy input information, including general-network back propagation, perturbation analysis for discrete-event systems, recursive least squares and least mean squares, and some forms of simulated annealing cases of SA [11]. Therefore, any improvement in gen-eral SA methodology can have a potential bearing on a wide range of practical implementations [12]. As with all search algorithms, there are adjustable coefficients in SA that must be specified and can have a profound effect on the algorithm performance. It is known that choos-ing these coefficients accordchoos-ing to an SA analogue of the deterministic Newton-Raphson algorithm provides an optimal or near optimal form of search. However, di-rectly determining the required Hessian matrix (or the Jacobean matrix for root finding) to achieve its optimal form has often been difficult or impossible in practice. In particular, the problem of minimizing a (scalar) differ-entiable loss functionL(θ) (in our case it is represented by the error to weight gradient)where θ ∈Rp, p= 1 is considered [11]. A typical example would be some mea-sure of mean-square error for the output of a process as a function of design parameters. For many cases of practical interest, this is equivalent to finding the unique minimum such that [12]:
g(θ)≡ ∂L
∂θ;atθ=θ
∗ (5)
where θ∗ in our case is represented by the optimal neu-ral network weight. For the gradient-free setting, it is assumed that measurements L(θ) denoted as y(θ) are available at the various values of θ. These measure-ments may or may not include random noise. No direct measurements (either with or without noise) ofg(θ) are assumed available in this setting. A recursive procedure has been used to calculate θ in general SA form, given as [8]:
b
θk+1=θbk−akbgk(θ)b (6)
where θbk represents the estimate of θ at the kth
[image:3.595.89.288.66.191.2]represents an approximation of g(θ); typically, theb ith
component ofbgk(θ)(ib = 1,2, ..., p) is given by [7]:
b
gk(θ) =b
y(bθk+ck∆k)−y(bθk−ck∆k)
2ck∆ki
(7) where the elements of the user specified random per-turbation vector ∆k = (∆k1, ...,∆kp) are assumed to be
independent and symmetrically distributed around zero, andck is a positive scalar. SPSA makes use of decaying
gain sequencesak, andck in the form [8]:
ak =
a
(A+k+ 1)σ; (8)
ck =
c
(k+ 1)γ (9)
where A,γ , a, and c are non-negative coefficients. We use the simultaneous perturbation algorithm to deter-mine the optimal initial weights and the optimum num-ber of nodes in the hidden layer of the neural network. The optimal initial weights will guarantee a faster con-vergence to the global minimum of the objective func-tion, and the optimum number of nodes in the hidden layer will avoid the bias-variance dilemma of neural net-works. Given a data set, it is known that a small number of nodes in the hidden layer captures the data trend only in a small region of the pattern, whereas a large num-ber of nodes in the hidden layer results in overfitting the data [13]. In the tumor localization problem, it is important to obtain a high accuracy in order to design a computer-aided system, which will ultimately replace preoperative invasive techniques for tumor localization.
4.2
Simultaneous
perturbation
neural
network
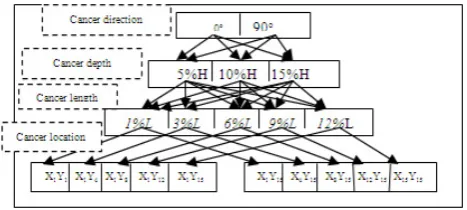
We use a three-layer artificial neural network (ANN) with a hyperbolic activation function, which has been shown to approximate any smooth mapping,: (1) An in-put layer that receives the index vector of the received signal, which has 32 nodes; (2) A hidden layer, which processes the data; and (3) An output layer that indi-cates the tumor status we are interested in classifying.
In this paper, we consider the following breast cancer statuses: In this paper, we consider the following breast cancer statuses:
1. Tumor spatial orientation of 0oand 90o
correspond-ing to a longitudinal or a transverse lesion, and ex-pressed using one bipolar nodal output of -1 or 1. 2. Three possible tumor depth: 5%H, 10%H, and
15%H denoted using the nodal outputs with two digits (1,-1),(-1,1), and (11), respectively.
3. 15 possible tumor cell lengths: 1%L,2%L,· · ·15%L represented using the nodal outputs with four digits (1,−1,−1,−1),(−1,1,−1,−1),· · ·,(1,1,1,1), re-spectively.
[image:4.595.302.536.52.157.2]4. 15 possible ranges ofx-coordinates, with respect to the breast length L, and 15 possible ranges of y-coordinates, with respect to the breast widthB, of the tumor location at 5%,15%,25%,30%,35%,40%
Figure 3. A representation of 60 statuses of tumor characteris-tics. Observe that the proposed system can actually account for 37,767 possible tumor statuses with only 32 input nodes and 15 output nodes.
,45%,50%,55%,60%,65%,70%,75%,85%, and 95%. The x, y coordinates are described us-ing two sets of nodal outputs with four digits (1,−1,−1,−1),
(−1,1,−1,−1),· · ·(1,1,1,1), respectively.
Figure 3 shows 60 examples of cancer statuses among the 32,767 possible cancer statuses that can be described by the NN. Observe that we need 15 nodes in the output layer of this NN. The healthy case (no tumor) will be represented by the value 0 at all 15 nodes in the output layer.
Our ultimate goal would be to assess the performance of the proposed tumor localization system in breast can-cer patients. However, due to the legal and techni-cal difficulties involved in obtaining ultrawideband mi-crowave backscatter signals from patients, we opted to use the CST Microwave Studio to simulate the backscat-tered microwave signal from cancerous breasts. We model the breast as a homogeneous cylindrical shape attached to a half-sphere, and containing a tumor, mod-eled as a small sphere inside the breast. In this re-ported set of simulations, we use a tumor of radius 8 mm. Observe that it is very difficult to observe such a small size tumor using the standard imaging methods like mammography and ultrasound imaging. The De-bye parameters for healthy breast tissues are given by ϵs = 10, ϵ∞ = 7, τ = 6.4 ps, and for cancerous tissues
are ϵs = 40, ϵ∞ = 5.573, τ = 9.149 ps at 6 GHz [8].
Therefore, using Eq. (1), the relative dielectric permit-tivity of a healthy (resp., cancerous) breast isϵr= 9.89
(resp.,ϵr= 38.20).
Table 1
Output bit Sample case 1 Sample case 2 Sample case 3 Sample case 4 Sample case 5
1 1 0.98 1 0.92 1 0.97 1 0.97 1 1.12 2 1 1.01 1 1.04 1 1.03 1 0.93 1 0.96 3 1 0.941 1 1.18 1 0.97 1 0.92 1 0.97 4 1 0.92 1 1.13 -1 -1.03 1 0.95 1 0.98 5 -1 -0.94 1 1.02 1 0.91 -1 -0.96 1 1.03 6 -1 -0.97 1 0.96 1 0.97 -1 -0.95 1 0.98 7 -1 -0.92 -1 -1.1 -1 -1.03 -1 -1.03 1 1.02 8 1 1.06 -1 -0.97 -1 -0.93 -1 -0.97 1 0.97 9 -1 -0.94 -1 -0.95 -1 -0.95 -1 -0.94 1 0.99 10 -1 -0.94 1 0.99 -1 -0.98 1 1.02 1 0.94 11 -1 -0.95 -1 -1.03 1 0.95 1 0.97 1 0.98 12 1 0.95 1 0.94 1 0.97 1 0.98 1 0.97 13 1 0.94 1 0.96 1 0.94 1 0.94 1 0.95 14 1 1.05 1 1.03 1 0.98 1 0.96 1 1.02 15 1 0.98 1 1.02 1 1.02 1 0.94 1 0.94
5
Conclusion
Breast tumor localization is a very serious issue can-cer type for women throughout the world. The com-monly used diagnostic techniques, like mammography, are reported to lack high diagnostic capability. There-fore, there is an absolute necessity to develop better di-agnostic techniques. Breast cancer signal can be conve-niently acquired using the microwave imaging modality with transmitting and receiving patch antennas. In this paper, we showed that we can detect and classify breast tumor cases using the antenna spectrum of the breast re-sponses decomposed by wavelet transform and fed to an optimized genetic neural network. Our simulations show that the required number of inputs to the neural net-work is greatly reduced, thus reducing the time and ef-fort needed for the genetic neural network training. The simultaneous perturbation algorithm gave us the opti-mal number of nodes in the hidden layer with the best initial weights as well. The main contribution of this pa-per goes beyond tumor detection to tumor localization by determining important clinical properties of any de-tected tumor, such as location, size and depth. If known at the diagnosis time, these properties can provide the clinician with valuable head-start clues; for instance the type of the abnormality in the breast, namely benign or malignant, and if an immediate surgery is needed or if an appropriate treatment should be taken first in or-der to shrink the tumor before surgery. Furthermore, a computer-aided diagnosis system based on the proposed algorithm for tumor localization will save money and pain to the patients by avoiding expensive (invasive or non-invasive) techniques to localize the exact position of the tumor before surgery. Finally, the proposed algo-rithm can be applied to any tumor localization within the body as long as the tumor and healthy tissue prop-erties exhibit significant differences in the wavelet or fre-quency domain.
REFERENCES
[1] S. E. Singletary, G. L. Robb, and G. N. Hortobagyi,
Advanced therapy of breast disease, PMPH-USA, 2004.
[2] A. Haid, M. Knauer, S. Dunzinger, and et al. Z. Jasare-vic, “Intra-operative sonography: a valuable aid during breast-conserving surgery for occult breast cancer,”
An-nals of surgical oncology, vol. 14, no. 11, pp. 3090–30101, November 2007.
[3] C. J. C. Cash, G. M. Treece, A. D. Purushotham, and et al. P. Britton, “Noninvasive method of preopera-tive localization with three-dimensional us and surface contour mapping,” Radiology: Volume 245: Number 2 2007, vol. 245, no. 2, pp. 556–566, November 2007.
[4] C. De Cicco, M. Pizzamiglio, G. Trifiro, and et al. A. Luini, “Radioguided occult lesion localisation (roll) and surgical biopsy in breast cancer. technical aspects.,”
The quarterly journal of nuclear medicine, vol. 46, no. 2, pp. 145151, June 2002.
[5] E. Fear and M. Stuchly, “Microwave detection of breast cancer,” IEEE Transaction on Microwave theory and techniques, vol. 48, no. 11, pp. 1854–1863, 2000.
[6] D. Woten, J. Lusth, and M. Al-Shenawee, “Interpreting artificial network output for the microwave detection of breast cancer,” IEEE Microwave and Wireless Compo-nents Letter, vol. 17, no. 12, pp. 825 – 827, December 2007.
[7] D. Woten and M. Al-Shenawee, “Improvement of ar-tificial neural network detection of breast cancer using broadband dual polarized antenna,” inIEEE Antennas and Propagation Internation Symposium, June 2007, pp. 261–264.
[8] D. Woten and M. Al-Shenawee, “Error analysis of breast tumor signature versus skin thickness at microwave fre-quencies,” inIEEE Antennas and Propagation Interna-tion Symposium, July 2008, pp. 1–4.
[9] S. Suh, A comprehensive investigation of new planar wideband antennas, Ph.D. thesis, Virginia Polytechnic Institute, Blacksburg, VA, USA, 2002.
[10] L. Yam, Y. Yan, L. Cheng, and J. Jiang, “Identification of complex crack damage for honeycomb sandwich plate using wavelet analysis and normal networks,” Smart Materials and Structures, vol. 12, pp. 661671, 2003.
[11] J. C. Spall, “Multivariate stochastic approximation us-ing a simultaneous perturbation gradient approxima-tion,” IEEE Transaction Automation Control, vol. 37, pp. 332–331, 1992.
[12] J. C. Spall, “Developments in stochastic optimization algorithms with gradient approximation based on func-tion measurement,” Winter Simulation Conference, pp. 207–214, 1994.