The California Organic Foods Act (COFA) was signed into law in 1990. COFA’s primary goal was to provide assurance to producers, processors, handlers and consumers that foods produced and marketed as organic would indeed be as claimed. Stan- dards and procedures were put into place in 1992 to regulate the produc- tion, processing, handling and labeling of organic products.
COFA requires all growers and/or businesses that choose to market, handle and/or process organic prod- ucts within the state to register with the California Department of Food and Agriculture (CDFA) Organic Program on a yearly basis. For growers, this means filling out a form that asks for farm location and acreage farmed or- ganically. The form also has a table asking for a listing of commodities grown, including the commodity type and gross sales for each commodity grown and marketed as organic. As a result, data is available from the regis- tration forms to statistically character- ize California’s organic agriculture for
porting by growers of “commodity” and ”type” on the registration forms. For example, consider three growers of navel oranges. When asked to re- port the commodity and type grown, one grower might list ”oranges/na- vel,” another might list ”citrus/or- anges,” while yet another grower might only list ”fruit.” Still others gave detailed listings of the commodities grown, but only one encompassing sales figure. To avoid these ambigu- ities in the future, CDFA has devel- oped a list of commodities and types from which growers will select. commodity groups: field crops; fruit and nut crops; livestock; combined fruit, nut and vegetable crops; nursery and flower; and vegetable crops. The combined fruit, nut and vegetable cat- egory was necessary because a num- ber of growers reported their produc- tion under the broad heading ”fruits and vegetables,” making it impossible to separate acreage or gross sales into the other commodity groups. Other growers reported crops that fell into more than one principal commodity Producers were divided into major
group. For example, a number of growers reported separate sales in both the field crop and vegetable crop commodity group categories. As a re- sult, the actual number of growers (1,159) and the total number of obser- vations in the commodity groups (1,277) are not equal. In other words, many growers reported sales in more than one of the major commodity groups, which is referred to as the mixed commodity group in the analysis.
Growers were also divided into eight geographic regions based prima- rily on climate conditions. The map in figure 1 shows the counties in each region.
Industry
size
[image:1.594.330.576.29.360.2]all growers in the state in 1992-93, ex- cluding dairy and livestock.
These numbers should be inter- preted with some caution. Land that was double or multiple cropped was counted as one physical acre. As a re- sult, the number of harvested acres is undoubtedly higher than the physical acres.
Industry experts estimate that gross sales for 1992-93 were close to $85 mil- lion, but unfortunately, this number cannot be substantiated. The reported gross sales of $75.4 million is thought to be low due to limitations of the data. Most importantly, growers are not obligated to report to CDFA sales in excess of $5 million, so total sales may be underreported. Further, it is reasonable to assume some under- reporting of sales because registration fees are levied by CDFA and are based on a grower’s total gross sales. Un- doubtedly, some growers did not reg- ister at all in the first year of required registration but rather took a wait- and-see attitude. These unregistered growers would contribute to the underreporting of sales as well as an underestimate of the number of grow- ers and number of acres in organic production.
Organic commodities
Because the inconsistent reporting of commodity types by growers made it impossible to determine gross sales for individual commodities, aggre- gated commodity groups were used instead. However, it is informative to note the variety of commodities men- tioned in reporting forms for every major commodity group (table 2). Vir- tually every major commodity in Cali- fornia is represented on the 1992-93 list with the notable exception of dairy. (The 1996 registration does include a few dairies.) The list illustrates the breadth and potential of the industry.
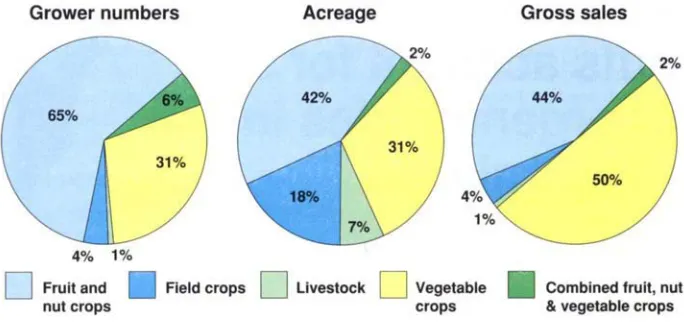
[image:2.594.221.563.66.227.2]In the aggregated commodity groups, fruit and nut crops and veg- etable crops combined represented 96% of the gross sales on 75% of all acreage (table 1, fig. 2). Breaking out the two major commodity groups, fruit and nuts comprised the largest share of acreage, but followed veg- etables in gross sales. In contrast, field
Fig. 2. Organic agriculture in California by commodity group, 1992-93.
crops had a small percentage of sales, but a significant share of the acreage. Specifically, fruit and nut crops ac- count for almost half (42%) of the total organic-producing acres for the state; vegetable crops about one-third (31 %);
and field crops one-fifth (18%) of the acreage.
Fruit and nut crops and vegetable crops made comparable contributions to total gross sales. Vegetable crops were the highest value commodity group for the state, with $37.7 million, representing 50% of the total gross sales (table 1, fig. 2). Fruit and nut crops generated $33.5 million, or 44% of the state’s total gross sales, while field crops totaled only $2.9 million, or 4% of the total gross sales.
Distribution of production The San Joaquin Valley region had the highest number of organically farmed acres in the state for 1992-93, with about one-third of the total or- ganic acres (table 3). The organic acre- age was split between fruit and nuts (55%) and vegetables (40%). In fact, fruit and nut crops in the San Joaquin
Valley showed the largest acreage
(16%) for any region and commodity group; only 2% of the acreage was in organic field crops.
In contrast, the Sacramento Valley, with about one-fourth of the state’s acreage, planted almost three-fourths to field crops, one-fifth to fruits and nuts and only one-tenth to vegetables. The division of acreage into commod- ity groups in the Central Coast region, which encompassed about one-tenth of the total acreage, was similar to the commodity break down for the San Joaquin Valley.
The county with the greatest num- ber of acres registered as organic was Kern in the San Joaquin Valley (13% of total organic acres); second was Fresno, also in the San Joaquin Valley (8% of total organic acres). Both of these counties show acreage split be- tween fruit and nut crops, and veg- etable crops.
other fifth. Kern County growers, with the greatest number of acres un- der organic production for a single county, also have the highest gross sales, $18 million, with about one- fourth of the state’s total organic sales. Two-thirds of that income was from fruit and nut crops and the other third was from vegetable crops, with a rela- tively small contribution from field crops. Monterey County was the sec- ond highest grossing county with $9 million (12%), virtually all from veg- etable crops. Ventura County was third with $5 million (7%), also domi- nated by vegetable crops.
Farm profiles
by
commodity Vegetable crops and fruit and nut crops combined dominate the industryVegetable crops account for 31% of the state’s organic acreage and reap $37.7 million, representing 50% of the total gross organic sales.
with respect to numbers of farms or growers (table 4, fig. 2). All but 5% of the growers produced some fruit, nut or vegetable crop. Almost three-fourths of the growers produced fruit and nuts, about one-third reported vegetable crops and only 4% grew field crops.
The characteristics of the median farm in each commodity
group
ex- plains the relative importance of the group to the organic industry as a whole, with respect to acreage and gross sales. The median is used in- stead of the average because of the high concentration of small farms. size farm at 80 acres. Half of the farmsField crops had the largest median
growing field crops cultivated be- tween 40 and 350 acres. Only the larg- est 10% farmed more than 600 acres. In marked contrast, the median vegetable crop and fruit and nut crop operations were very small with only 2.3 acres and 6 acres, respectively. Three- fourths of the vegetable growers had fewer than 12 acres and only 10% had more than 60 acres. Similarly, three- fourths of the fruit and nut farms pro- duced on less than 20 acres, only 10% on more than 60 acres.
nut crops significantly lower ($1,393 per acre). The median gross return per acre for field crops reflected the lowest value of any commodity group ($361 per acre). Farms producing field crops showed the highest median annual gross sales ($50,000) followed by mixed commodities ($13,000) and nursery and flowers ($10,000). Two- thirds of the vegetable crops and three-fourths of the fruit and nut crops farms reported annual sales less than $17,000, while three-fourths of the field crop farms reported over $15,000. This suggests that most of the produc- ers of organic fruit, nuts and veg- etables are supplemented by some other income, and field-crop produc- ers are more likely to be full-time farmers. This result is not surprising considering the high investment costs required for field-crop production.
Vegetable-crop production is char- acterized by a large number of small growers showing relatively high re- turns per acre. Fruit and nut produc- tion accounts for three-fourths of the growers on small farms and lower re- turns per acre than the vegetable crop growers. The relatively small number of field-crop producers manage larger farms than the other crop producers for modest net returns per acre, but the highest sales per farm.
ganic farm has 5 acres and total sales of $7,500 annually. Half of the farms are between 2 and 20 acres and gross between $2,400 and $24,000 a year. About 20% of the growers grossed over $40,000 and 14% grossed over $100,000 for the year. This suggests an industry with a predominance of part- time growers, but undoubtedly a sub- stantial number of full-time farmers. Organic farming is likely to be a means of supplementing other income for small growers, while larger grow- ers have established sizable organic markets and operate on a commercial scale.
Farm profiles by region
Looking at all farms, the median or-
More than one-fourth of organic farms or growers (28%) were found in the South Coast region of the state (table 3). The North Coast was the re- gion with the second highest number
of growers (21%), followed by the Central Coast (14%). The three coun- ties recording the highest number of organic growers were: San Diego (253 or 22%), followed by Mendocino (96 or 8%) and Sonoma (87 or 8%). Alpine, Mariposa, Modoc, Mono, Plumas and Sierra counties did not have any farm- ers registered in the state organic pro- gram.
Half of the organic farms in the San Joaquin Valley had less than 29 acres. One-fourth were less than 5 acres and one-fourth were more than 75 acres, with only 10% of the farms more than 200 acres. The second-largest median farm size was in the Sacramento Val- ley, 13 acres. There, half of the farms were between 3 and 13 acres with 10% of the farms more than 100 acres. The median-size farms in the other regions were all smaller than 10 acres.
Due at least in part to the relatively large farms, the San Joaquin Valley had the highest median annual sales at $27,000.0ne-fourth of the farms grossed below $9,000 while the upper one-fourth grossed over $118,000 per year, reflecting the region’s tremen- dous range in scale. The median sales in the Sacramento Valley, the South- east Interior and Bay Area were all about $9,000 to $10,000 per year.
[image:4.594.213.563.52.314.2]The median sales per acre were be- tween $1,000 and $2,000, with the no-
table exception of the Bay Area, where half of the growers grossed just under $8,000 per acre
-
attributable to the concentration in high-value, intensive vegetable production and proximity to high-end markets. In comparison, only 10% of the growers in the Sacramento Valley, South Coast and San Joaquin Valley received over $6,000 per acre; and 10% of the North Coast and Cen- tral Coast growers grossed over $7,000 per acre.Concentration
Organic production in California is highly concentrated. The largest 2% of farms, those grossing more than $500,000 dollars, claimed half of the to- tal gross sales in 1992-93. Farms with gross sales between $165,000 and $500,000 (5% of all farms) received an- other 25% of the total gross sales. Smaller farms, with sales between $10,000 and $165,000 (30% of all farms) garnered 21 % of gross sales. The re- maining 4% of sales was divided among the growers (64%) who real- ized $10,000 or less in sales.
the most highly concentrated group with the largest 5% of farms account- ing for almost 70% of the acreage. In contrast, the largest 5% of farms com- prised 45% of the land for fruit and nut growers and 36% for field crop producers.
Organic certification
Organic certification is separate from, and does not act as a substitute for, state registration. While state reg- istration is required by law, certifica- tion is currently voluntary. However, the federal Organic Foods Production Act of 1990 (OFPA), which is expected to be implemented in late 1996 or early 1997, will require growers with gross sales over $5,000 per year to be certi- fied by a federally accredited certify- ing agent. During the 1992-93 report period, about 40% of California or- ganic growers reported less than $5,000 in sales.
Certification serves as additional assurance to handlers, processors and consumers that products marketed as organic meet the specific production standards required by law and a pri- vate certification organization, and enable organic products to be sold nationwide. The certification process varies across organizations, but typi- cally requires growers to keep records of production inputs and includes a field inspection.
Six private certification organiza- tions actively certified growers in Cali- fornia during 1992-93: California Cer- tified Organic Farmers (CCOF); Farm Verified Organic ( N O ) ; Organic Crop Improvement Association (OCIA); Or- ganic Growers and Buyers Association (OGBA); Quality Assurance Interna- tional (QAI); and Scientific Certifica- tion Systems/Nutriclean Organic Cer- tification Program (SCS).
More than half (55%) of the regis- tered organic growers were not certi- fied during 1992-93. Almost 90% of the certified growers were certified by CCOF, leaving only 10% certified by one of the other five organizations. A few growers were certified by more than one certification organization, presumably for marketing purposes.
Looking at certification by sales class, smaller growers tended to be
uncertified while larger growers tended to be certified. In fact, 83% of the uncertified growers grossed under $10,000 in organic sales. These grow- ers typically do direct marketing and have less incentive to be certified than larger growers who market through other channels. As a result, while only 45% of growers were certified, a greater percentage of the acreage, 64%, was certified. ’
Certification also varied by com- modity group. About half of the fruit and nut and vegetable growers were certified in contrast to 80% for field crops. This supports a conjecture that processed commodities are more likely to be certified than fresh market commodities. However, for marketing purposes and legal protection, both processors and produce handlers are increasingly requiring proof of certifi- cation from growers when purchasing organic commodities. This trend would indicate an increase in the rate of certification among growers selling products through these outlets. Fur- thermore, the rate of certification will undoubtedly increase upon implemen- tation of the OFPA.
Industry trends
No comprehensive statistical analy- ses for California’s organic agriculture exist for production prior to 1992. As such, the information contained here should be considered baseline statisti- cal information for the state; it follows that industry trends cannot be docu- mented.
Experts believe that between 1992 and 1996 the overall industry has at least doubled with respect to total gross sales. This growth can be ex- plained in part by the expansion of or- ganic cotton, salad mix and wine grape production in the state. As of June 1996, there were approximately 1,500 registered organic growers in California, according to CDFA. This represents a per year increase of roughly 15% in the number of state- registered organic growers. The fact that gross sales have probably
doubled since 1992, while the number of growers has only increased by ap- proximately 30% suggests that the number of large growers has in-
creased, and/or that the size of exist- ing operations has increased.
Continue statistical analyses Annual statistical analyses should continue so that California’s organic agriculture can be characterized in all subsequent years, and also so that overall industry trends can be identi- fied. This information would be valu- able to, among others, farmers, re- searchers, educators, agribusiness, policy makers, public-interest groups, bankers and venture capitalists. The commodity list developed by CDFA for reporting will increase the level of detail, and ultimately the value, of the information obtained through the reg- istration process.
~~
K . Klonsky is Extension Economist and L. Tourte is postgraduate researcher, De- partment of Agricultural and Resource Economics, UC Davis.