A STUDY OF ATTITUDE TOWARDS COMPUTER EDUCATION
AMONG SENIOR SECONDARY SCHOOL STUDENTS IN RELATION
TO GENDER, LOCALITY AND ACADEMIC STREAM
Hemant Lata Sharma
Faculty of Education, M.D. University, Rohtak
Jasbir Singh
Department of Education, M. D. University, Rohtak
The purpose of the present study is to investigate the Attitude towards Computer Education of senior secondary school students in relation to Gender, Locality and Academic stream .Descriptive survey method was used. The sample was comprised of 200 senior secondary school students from District Rohtak of Haryana. The investigator adapted the Attitude towards Computer Education scale by Jahanur Ali (2001) for data collection. This scale has 28 items and standardized on under graduate students. But the investigator selected 20 items from this scale and then conducted the pilot study to know the reliability of this scale. The Cronbach Alpha value of CAS in current study is 0.831.Findings of the study showed no significant difference in the Attitude towards computer education of senior secondary school students in relation to Gender, Locality and Academic stream.
Keywords-Attitude, Computer Education, Gender, Locality and Academic stream.
1.0 INTRODUCATION
1.1 Theoretical Framework
Computer, one of the most effective and powerful tool is advancing very fastly and
affecting the life of everyone, whether literate or illiterate. The powerful impact of
computers have occupied a powerful place in society and education (Maddux, et.al,
1997). It has increasedthe human interaction with in educational context. Therefore,
educational computing is an exciting new discipline whose effectiveness will depend on
how today’s teacher in training use computers in their own class room in future (Forcier,
1996).
1.2 Construct of Attitude towards Computer Education
In general, to use computers in educational setting depends a lot on the computer related
attitude of both teachers as well as students. According to Whitrow (1999), computer
related attitude influence students desire to use computers, their desire to enrolling
computer related subjects and courses and their choice of career path. Attitude towards
Computer Education act as a key that affects students seeing the computer as a learning
tool and that determines the possibility of computer being used in the future for learning
or study(Teo,2008).Studies conducted by Yencie (2003) and Cepni,Tas&Kose (2006)
have shown that working with computers develop positive attitude towards computers.
Reece and Gable (1982) in their study revealed that student’s attitude towards computer is
connected to their computer knowledge. Hamdi (1989) in his study found thatmany of the
student’s attitudeabout the use of computers in education change once students sit to
computer learning and start performing through them by getting computerized tutorial
1.3 Purpose of the study
The purpose of the study was to study the Attitude towards Computer Education of senior
secondary school students. It was also investigated to what extent certain demographic
variables i.e. Gender, Locality and Academic Stream effect Attitude towards Computer
Education.
1.4 Objective of the study
The study aims to achieve the following objectives.
1. To find out the difference on Gender basison Attitude towards Computer Education
among senior secondary school students.
2. To find out the difference on Locality basis on Attitude towards Computer Education
among senior secondary school students.
3. To find out the difference on Academic Stream basis on Attitude towards Computer
Education among senior secondary school students.
H1. There is no significant Gender difference on the Attitude towards Computer
Education among senior secondary school students.
H2. There is no significant Locality difference on the Attitude towards Computer
Education among senior secondary school students.
H3. There is no significant Academic stream difference on the Attitude towards
Computer Education among senior secondary school students.
2. Research Design and Methodology
2.1 Variables- Attitude towards Computer Education was taken as dependent and
Gender, Locality and Academic stream was taken as independent variable.
2.2 Method- Descriptive Survey Method was used.
2.3 Sample-In the present study; a random sample of 200 senior secondary school
students from District Rohtak of Haryana state was taken.
2.4 Research Instrument: In the present study, following tool was used for data
collection
2.4.1 Attitude towards Computer Education scale by Jahanur Ali (2001) - The scale
has 28 items which was standardized on undergraduate students. For the present study,
the scale was adapted and 20 items from this scale was selected. The total 20 items on a
five point Likert scale are positively worded and given a score of ‘1’,’2’,’3’,’4’, and ‘5’
for strongly Disagree, Disagree ,Undecided, Agree, and Strongly Agree respectively. The
total score range from 20 to 100 and higher score indicate more positive Attitude towards
Computer Education. The Cronbach Alpha for the entire scale was 0.831.
2.4.2 Statistical Techniques
Frequency, Percentage, Mean, S.D. and t-ratios were used to analyze the data.
3. Analysis and Interpretation
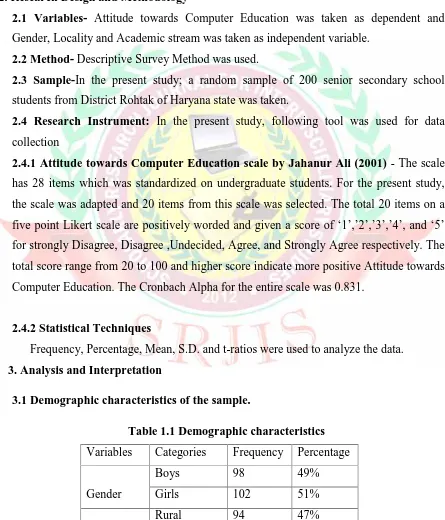
[image:3.595.78.523.206.726.2]3.1 Demographic characteristics of the sample.
Table 1.1 Demographic characteristics
Variables Categories Frequency Percentage
Gender
Boys 98 49%
Girls 102 51%
Locality Urban 106 53%
Academic
Stream
Arts 100 50%
Commerce 100 50%
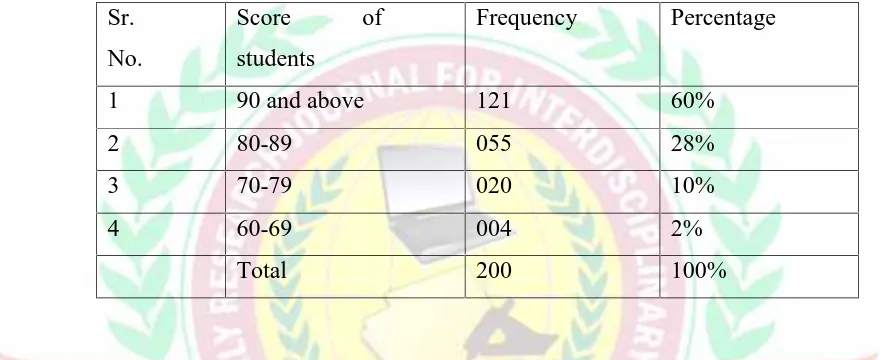
3.2 Distribution of Attitude towards computer education scores among senior
[image:4.595.158.440.71.157.2]secondary school student
Table 1.2 Attitudes towards Computer Education
Sr.
No.
Score of
students
Frequency Percentage
1 90 and above 121 60%
2 80-89 055 28%
3 70-79 020 10%
4 60-69 004 2%
Total 200 100%
From the Table 1.2 it is found that 60% of students scored 90 and above marks; 28% students
scored 80 to 89 marks, where as 10% students scored between 70 to 79 marks and 2%
students scored 60 to 69 marks. Thus most of the students i.e. 88%of the students scored
above 80marks.From this, it is clear that most of the students in the present study have
positive attitude towards computer education and it is evident from Figure 1.1 also.
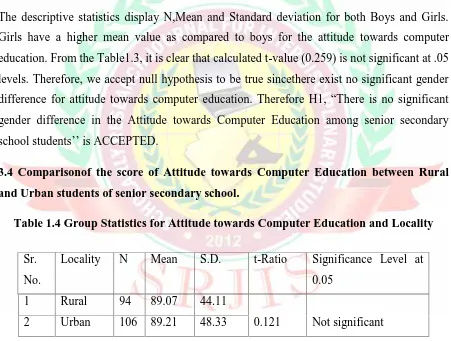
[image:4.595.78.520.248.428.2]3.3 Comparison of the score of Attitude towards Computer Education between
[image:5.595.81.520.157.270.2]Boys and Girls of senior secondary school.
Table 1.3 Group Statistics for Attitude towards Computer Education and Gender
The descriptive statistics display N,Mean and Standard deviation for both Boys and Girls.
Girls have a higher mean value as compared to boys for the attitude towards computer
education. From the Table1.3, it is clear that calculated t-value (0.259) is not significant at .05
levels. Therefore, we accept null hypothesis to be true sincethere exist no significant gender
difference for attitude towards computer education. Therefore H1, “There is no significant
gender difference in the Attitude towards Computer Education among senior secondary
school students’’ is ACCEPTED.
3.4 Comparisonof the score of Attitude towards Computer Education between Rural
and Urban students of senior secondary school.
Table 1.4 Group Statistics for Attitude towards Computer Education and Locality
The descriptive statistics display N, Mean and Standard deviation for both Rural and Urban.
Urban students have a higher mean value as compared to Rural students for the attitude
towards computer education. From the Table1.4, it is clear that calculated t-value (0.121) is
not significant at .05 levels. Therefore, we accept null hypothesis to be true since there exist
no significant locality difference for attitude towards computer education.Therefore H2, Sr.
No.
Gender N Mean S.D. t-Ratio Significance Level
at 0.05
1 Boys 98 88.27 37.18
0.259 Not significant
2 Girls 102 89.89 55.17
Sr.
No.
Locality N Mean S.D. t-Ratio Significance Level at
0.05
1 Rural 94 89.07 44.11
0.121 Not significant
[image:5.595.74.525.262.603.2]“There is no significant locality difference in the Attitude towards Computer Education
among senior secondary school students’’ is ACCEPTED.
3.5 Comparisonof the score of Attitude towards Computer Education between Arts and
[image:6.595.70.528.235.602.2]Commerce students of senior secondary school.
Table 1.5 Group Statistics for Attitude towards Computer Education and Academic
Stream
The descriptive statistics display N, Mean and Standard deviation for both Arts and
Commerce. Arts students have a higher mean value as compared to Commerce students for
the attitude towards computer education. From the Table1.5, it is clear that calculated t-value
(0.226) is not significant at .05 levels. Therefore, we accept null hypothesis to be true since
there exist no significant Academic stream difference for attitude towards computer
education.Therefore H3, “There is no significant Academic stream difference in the Attitude
towards Computer Education among senior secondary school students’’ is ACCEPTED.
Discussion of Results
1 From the above findings, it has been found that there is no significant gender
difference on the Attitude towards Computer Education among senior secondary school
students. This shows that boys and girls have same perception about the Computer
Education.This led credence to earlier findings of Rohner and Simonson (1981), Rosen ,Sears
and Weil (1987) Kotrlik, and Smith (1988), Todman and Lawrenson (1992),Nash and Moroz
(1997.
2. Another finding of this study revealed that there is no significant locality difference
on the Attitude towards Computer Education among senior secondary school students. It
shows that locality (Rural and Urban) does not have any effect on the Attitude towards Sr.
No.
Stream N Mean S.D. t-Ratio Significance
Level at 0.05
1 Arts 100 89.9 53.73
0.226 Not significant
Computer Education. Jomy Johnsoon (2009) also revealed no significance difference in the
use of Computer between rural and urban students of higher secondary school.
3. Another finding of this study indicates that there is no significant Academic Stream
difference on the Attitude towards Computer Education among senior secondary school
students. On other hand, Adebowale, Adediwura, Bada, (2009) in his study found that
Commercial students demonstrated better Attitude towards Computer than students of Arts,
which is contradictory to our finding. The difference in the result may be due to the time
factor. In present time, computer is taught as a subject even at the primary level which helps
in developing attitude towards Computer Education in all the students even at the early
stage.
References:
Adebowale, O.F, Adediwura, A.A., Bada, T. A. (2009), Correlates of Computer Attitude
among Secondary SchoolStudents in Lagos State, Nigeria. International Journal of
Computing and ICT Research, Vol. 3, No. 2, 20 - 30.
Çepni, S.Taş, E. and Köse, S. (2006). The effects of computer-assisted material on students’
cognitive levels, misconceptions and attitudes towards science. Computers & Education, 46
(2), 192-205.
Forcier, C. Richard. (1996). “The Computer as a Productivity Tool in Education”. Prentice
-Hall, Inc. A Simon & Schuster Company in United States of America
Hamdi, Nargis. (1989). the effect of learning use style via computer in postgraduate students
achievement and their attitudes towards computers in education. Studies, Vol.16, No.6, 81
-95.
Jomy Johnsoon(2009). A Study on Use of Computer among Higher Secondary Students as
Related with their Achievement in Computer Science, Malaysian Journal of Education
Technology.Vol 9, 27-31
Kotrllk, J.W. and Smith, M.N. (1988). Computer Anxiety Levels of Vocational Agriculture
Teachers. Journal of Agricultural Education.
Maddux, Cleborne, et. al. (1997). “Educational Computing Learning with Tomorrow’s
Technologies”. A Viacom Company in United States of America.
Nash, J. &Moroz, P., (1997), ‘An Examination of the Factor Structures of the Computer
Reece, M. and Gable, R. (1982). The Development and Validation of a Scale of General
Attitudes toward Computers. Educational and Psychological Scale. 42, 913- 916.
Rohner, D. J. & Simonson, M. R. (1981) Development of an index of computer anxiety. A
paper presented at the Annual Convention of the Association of Educational Communications
and Technology, Philadelphia, April (ERIC doc. no. 207 487)
Rosen, L. D., Sears, D. C. & Weil, M. M. (1987) Computer phobia, Behavior Research
Methods, Instruments, & Computers, 19, 167-179.
Todman, J. and Lawrenson, H. (1992) Computer Anxiety in Primary Schoolchildren and
University Students British Educational Research Journal, Vol. 18, No. 1, 63-72
Teo,T. (2008). Assessing the computer attitudes of students: An Asian perspective.
Computers in Human Behavior, 24 (4), 1634-1642
Whitrow, T.J. (1999). Integrating Computers Across the Curriculum: Students'
Computer-related Attitude Changes. Unpublished B.Ed Honours Thesis, School of Education, Flinders
University, Adelaide.
Yenice, N. (2003). Effects of computer-assisted science ınstruction on students attitudes
towards science and computers. The Turkish Online Journal of Educational