371
COMPUTATIONAL INTELLIGENCE TECHNIQUES FOR
EFFICIENT POWER DISTRIBUTION AND CONSUMPTION:
A SURVEY
1M.SHEEBA SANTHA KUMARI, 2A.P.SHANTHI, 3V.UMA MAHESWARI
1PhD candidate, Department of Computer Science and Engineering, Anna University, Chennai, India 2Assoc. Prof., Department of Computer Science and Engineering, Anna University, Chennai, India 3Assoc. Prof., Department of Information Science and Technology, Anna University, Chennai, India
E-mail: [email protected], [email protected], [email protected]
ABSTRACT
Affordable and reliable electricity plays a major role in shaping the world economy as a nation’s growth in the gross domestic product (GDP) can be tracked to its growth in electricity. The consumption of electricity has gained critical attention as it acts as a production factor for corporations and welfare factor for societies. Smart grid or intelligent electricity grids that use information and communication technologies are currently deployed to offset the increasing energy pressure. These smart grids are driven by the state of the art IT solutions like artificial intelligence, machine learning and data mining techniques. The techniques empower producers and suppliers of electricity for efficient power planning and distribution. It also enables consumers to save electricity and cut off costs through intelligent consumption. The main objective of this paper is to provide a contemporary look at the usage of these techniques intelligently, to monitor, control and forecast electricity usage.
Keywords: Computational Intelligence Techniques, Electricity Data Analysis, Intelligent Power Distribution and Consumption
1. INTRODUCTION
Electricity plays a vital role in maintaining a successful society. Existing electric grid can no longer support the twenty-first century demands and the growing population [1]. Increased complexity in administering the power grid and limitations in generating power necessitates for a smarter, efficient power grid. U.S. Department of Energy (2012) states that , “Smart grid is a modernized electrical grid that uses information and communications technology to gather and act on information about the behaviour of suppliers and consumers to improve the efficiency, reliability, economics and sustainability of the production and distribution of electricity”. Thus, developing a smart power grid ensures to meet all demands and provide a reliable and a secured power system [2].
Increase in digitization enables more smart electricity meters to be installed in distribution networks and buildings [3]. Cheap storage and development of “Internet of things” [4] that generates massive electricity data have fortified power firms to gather massive amounts of data. Advanced Metering Infra-structure [5], facilitates
storing high resolution minute-interval data. Thus the volume of data accessible is enormous which can be viewed as reservoirs of knowledge and valuable treasure for the power enterprises.
On the other hand, computational intelligent techniques are being developed [6, 7]. How to make good use of the techniques to apply and to transform the data into knowledge is a challenge for the enterprises and the researchers. A wide range of these techniques and models when applied appropriately can be used in intelligent power planning, monitoring and control of electricity [8]. This paper presents a recent review of how the researchers have applied combination of these techniques on this uncooked electricity data to acquire beneficial knowledge that assisted in various issues as described in each section.
2. TARIFF FORMULATION
372 power consumption data collected from load monitoring points form load curves [10]. The supplier periodically monitors the daily load curves of all customers, updates reference patterns and customer classes by automatic clustering, and adjusts the tariff applied to each customer class to maximize its foreseeable profits [14].
In the literature, clustering and classification techniques are used to design tariff policies [9-13]. Load curves are clustered with the objective of obtaining Representative Load Patterns (RLP) or Typical Load Profiles (TLP). The number of RLP representing specific customer classes should be small [14] and depends on the practical aspects [13].
In [10], a distribution company’s load data which constitutes industrial, residential and commercial customers are grouped. The company’s half hourly electricity load data forms a load curve with 48 values for a single day. Self-Organizing Map (SOM), K-means and Fuzzy C-means are the unsupervised learning algorithms used. A newly proposed stability and priority index is used to choose best algorithm and optimal cluster count. K-means was determined as best using which five TLP’s were obtained representing different customer classes. Similarly in [15], a distribution company’s half hourly electricity load data is clustered using Fuzzy C-Means Clustering (FCM) and Probability Neural Network (PNN). Minimal value of Davies-Bouldin Cluster Index decides the best cluster count. Three TLP’s obtained represent commercial, small scale industries and domestic consumers. The Q-Q probability plot showed that PNN has more accuracy compared to FCM method. Chicco et al. [9] has proposed ant colony clustering to categorize non-residential customers connected to a distribution company. Unlike [14,15], the author has taken company’s 15 minute electricity load data that forms a load curve with 96 values for a single day. Clusters are initialized from a centroids model. Load profiles of different customer classes that were used for tariff purposes earlier are used to form the initial centroids. Centroids are updated by maintaining them relatively similar to the initial ones, just embedding the variations in the customers’ electricity usage that emerged in the most recent period. Clustering performance is validated using Clustering Dispersion Indicator (CDI) and Scatter Index (SI). Fifteen clusters were obtained representing 15 TLP’s of customers. The TLP’s formed helps to assign tariff for different customer classes.
3. ELECTRICITY LOAD CONTROL
Monitoring and control of load can be performed by investigating the behaviour of consumption [16,17], usage of appliances [18], properties of buildings [19] and other factors influencing consumption like time and meteorological parameters [16, 18]. This helps to cut off costs during peak period for residential [17, 18], commercial and industrial sectors [16, 19, 20].
Authors of [16] have examined the load data of 30 buildings in a university using Dimensionality Reduction Algorithm (DRA) based visual analysis. Correlation of consumption with meteorological parameters and activity index which includes type of day, exam seasons, working day or holiday is analysed. Stochastic Neighbour Embedding (SNE) proves to work well from the study of nine DRA techniques based on good visualization and quantitative metrics of performance. For each building SNE projection of relation between load and the above factors are obtained and explored to find similar buildings. Magnitude (Low and high consumption) and dynamics or shape of consumption of each building group projected in 2D space. Both factors help us to know the behaviour of electricity usage and the demand of the building groups formed.
With electricity deregulation in place, DR or load response is being implemented in many places [21]. DR is end-use customers reducing their use of electricity in a given time period, or shift that usage to another time period, in response to a price signal, a financial incentive, an environmental condition or when power system reliability is jeopardized. Mathieu et al [19] have explored quarterly load data of commercial and industrial buildings to participate in DR programs. A linear regression model is used to quantify electric load considering time-of-week and outdoor air temperature. This help building managers to generate a list of informed questions and determine the equipment running during each hour of the day, during DR programs and in peak hours. A decision is taken whether they should be shifted or shed or limited, thus reducing electricity bills through building energy management.
373 CDI, SMI, DBI, Ball and Hall are used to assess the clusters. Those households, which show high variability in behaviour are the ones targeted for initiatives intended to change behaviour and households with high usage in peak hours are the ones targeted for general initiatives intended to reduce total electricity usage. A similar work [18] has focused to cluster household data but considers extra factors like temperature, season, weekdays and official holidays. Periods of recurrent behaviours which occur every day are identified using principal components analysis, eigenvector decomposition and varimax rotation. Hierarchical and K-means clustering are used to cluster the eigenvector components representing 80% of the variance in the dataset generating five clusters that represent different consumption patterns. Permanent daily routine patterns and baselines representing typical patterns of consumption are generated and evaluated with the interview data from the experiment participants.
Some researchers have also analysed household properties which is a first step towards the investigation of the potential of automatic classification of private house-holds. Indeed, this knowledge can enable electricity providers to offer new, better, or more customer-tailored energy services. In [22], Self-Organizing Maps are used to explore electricity consumption by selecting household properties. Identification of properties like size of a household and the income of its occupants are properties are highly useful to energy providers to perform automatic classification of private households.
4. ELECTRICITY FRAUDULENCE
IDENTIFICATION
Electricity fraudulence is the illegal use of electricity equipment or service to steal electric power or to avoid billing charge. As all electric utilities face this problem, detecting fraudulent electricity consumption has been an active research area in recent years. In literature many techniques have been used to detect this fraud. However, classification and clustering techniques have been used widely to find abnormalities in distribution companies [23, 24] as well as in separate sectors [25].
Abnormal consumption patterns can be found when there is illegal electricity connection, tampering of meters, intended wrong billing and non-payment [23, 24]. But this may also occur because of replaced meters, change of tenants, faulty meter wiring, installation problems, measurement errors and billing errors. So it is very
difficult to distinguish between honest and fraudulent customers. This results in overloading the power-supply system, deterioration in the power-supply quality, rising energy costs and commercial losses [26].
C-Means based fuzzy clustering method is proposed [23] to find abnormalities in power distribution systems comprising a total of 20126 consumers of all types. Variants of consumption data of consumer, Mean consumption data of consumer’s locality and Inspection remarks are considered. Inspection remarks give the abnormality degree varying from 0(low) to 1(high) which is previously recorded. The fuzzy classification uses a fuzzy membership matrix and the Euclidean distance to the cluster centres. Then, the distance measures are normalized and ordered that yields a unitary index score. Users with irregular patterns of consumption with high scores are determined as fraudsters.
Nagi et al. [24] aims to find fraudsters in Malaysian electricity supply industry using Support Vector Machine (SVM) based approach. Monthly Consumption data, meter reading type, date, and previous theft of electricity information were features used to build C-SVM classifier. Grid search method was used to obtain C-SVM parameters and tenfold Cross validation was used to test the accuracy. Applied to Kuala Lumpur Barat station's e-CIBS data with 265 870 customers, the fraud detection method performed well.
In [25] the author aims to find fraud activities in commercial and industrial data. Initially 20 power related attributes, mean and maximum electricity consumption are taken. Correlation based feature selection and data driven method are used to remove irrelevant attributes. With the selected features as input and ‘season’ as class label, 5 prediction models J48, IBK, Naïve Bayes, Decision Table and Logistic are built. Accuracy rate can be increased by running the classifier with other target attributes like ‘consumer type’ and ‘Meter No’.
Abnormal users found by these methods are inspected and the reason for abnormality can be found through meticulous investigation by the corresponding authorities. Thus inspecting of all customers is not required which otherwise might be too expensive for power utilities.
5. ELECTRICITY LOAD FORECASTING
374 weather conditions, calendar effect, demographic and economic factors. So accurate forecasting of load has always been a challenge for modern power industries. Load forecasting is classified into long, medium, short term load forecasting based on the interval of time to forecast.
5.1 Long and Medium Term Load Forecasting
Forecasting long term load is difficult due to the non-linearity of economic indicators [27]. More non-linear solutions or combination of linear and non-linear techniques are introduced by researchers to predict long term load. The future long term load is forecasted for an area (city, state or country) [28-31] or particularly for a sector [32] or for a distribution company. Forecasting load for one to several years helps for power system planning, operation and scheduling. It aids for the development of transmission and distribution system, transmission augmentation. Prediction of load for one to several months in the future helps in load switching and maintenance scheduling.
Annual load of a city is forecasted using a hybrid method, Differential Evolution (DE) and Support Vector Regression (SVR) [28]. A city’s 31 years’ annual load data has been used to build the model. DE, a population based optimization algorithm is used to optimize parameters for SVR. MAPE values show that DE-SVR outperforms SVR model with default parameters, BPNN and regression forecasting models.
Principle Component Analysis (PCA) and Artificial Neural Networks (ANN) combination, to predict monthly load of a country is presented in [29]. PCA selects the input parameters for ANN and a country’s monthly electricity consumption data is used to build the model. Different ANN and time series models were considered. DEA and Granger-Newbold test were used to select the best ANN and time series models. MAPE, DEA and ANOVA show that ANN performs better than time series model.
Residual bootstrapping and semi-parametric additive model in linear regression framework are introduced in [30] to forecast annual peak load of industries in a state. Semi- Parametric Additive Model is used to obtain relationship between load and driving factors like weather, time, demographic and economic factors. Annual load data of some mining companies, long-term GSP forecasts and pricing scenarios obtained from AEMO were used. Bootstrapping was used to forecast the annual peak electricity demand up to ten years.
Toly Chen [31] employs collaborative PCA and Fuzzy Feed-forward Neural Network
(FFNN) approach to forecast annual load of a state. PCA selects the input parameters for FFNN and the domain experts are asked to configure their own PCA-FFNNs based on their views. Partial-Consensus Fuzzy Intersection (PCFI) and Radial Basis Function network (RBF) approach is used to derive a single representative value from these forecasts. Partial-Consensus Fuzzy intersection (PCFI) is applied to aggregate the fuzzy load forecasts into a polygon-shaped fuzzy number. A Radial Basis Function (RBF) is used to defuzzify the polygon-shaped fuzzy number to arrive at a representative value. The proposed method is compared with Moving Average (MA), Auto-Regressive Integrated Moving Average (ARIMA), Exponential Smoothing (ES), and SVR using MAE, MAPE, and RMSE.
In [32], linear regression and ANN are used to forecast monthly peak load for months ahead for an electricity distribution company. The monthly peak load is modelled as a function of monthly data, month index, temperature, relative humidity and wind speed. Non-linear neural network outperforms classical multiple linear regression model as seen by Mean Squared Error (MSE) and Mean Absolute Error (MAE) values. Daily peak load of next month for a country’s power system is predicted using ANN which uses novel stochastic search method [33]. The positive characteristics of DE, Particle Swarm Optimization (PSO), GA and Simulated Annealing (SA) are combined to form a training mechanism called Improved DE (IDE). The IDE combined with Levenberg-Marquardt (LM) algorithm is used to train the neural network. In addition to monthly peak load, other features like time and seasonal factors are considered. The effectiveness of the hybrid method over single LM, GA and PSO is verified using Peak Absolute Percentage Error (PAPE) and MAPE values.
5.2 Short Term Load Forecasting
375 Forecasting of five minute load in industry [34] using polynomial fitting with interpolation is performed. The last 10 minute load data is used to forecast the next 5 minute demand. The system checks whether the demand and current tariff exceed the user defined level. If the forecasted demand exceeds the user defined demand level, the consumer is warned by sending alarm signals from smart meters. Domestic or industrial consumers whose load patterns are highly time dependent for 15 minutes cycle can use this method.
Fan and Hyndman [35] employs semi-parametric additive models to forecast half hourly load in electricity market or power system. The system aims to allow non-linear and non-parametric terms in the regression framework. The market’s 30 minute load data, calendar and weather factors are taken. Variations of demand and temperature with time are estimated. Nonlinear relationship between load and calendar variables, past load, historical temperature traces are obtained. Separate model for each 30-minute period is estimated based on these features. MAE and MAPE values show that this method provides accurate predictions. Wavelet Transform (WT) and ANN are used to forecast half-hourly load data [36] in a power market. Similar hour method is the concept employed and weather, temperature related factors are taken. WT extracts low and high frequency components (slow and fast changing load features) in the first step. In the second step, a WT, the similar-hour method and adaptive neural fuzzy inference system (ANFIS) are used to improve the forecast. Weather data and low frequency components are given as input to ANN. APE and MAPE are used to know the performance of the system.
Forecasting of hourly load in a power market using Ant Colony Optimization (ACO) and SVM method is introduced [37]. The 15 minute load data, weather related features like temperature, rainfall, wind speed, cloud cover and time related factors like month, week, season, holiday and weekend are considered. ACO eliminates redundant information by performing feature selection and SVM is used to forecast load. Comparing with single SVM and BP neural network, the ACO-SVM combination achieves greater accuracy. Daily and hourly load [38] is forecasted using SVR and Locally Weighted Regression (LWR). SVR’s risk function is modified with LWR. An electric power utility’s hourly load, temperature data and holiday information is used to forecast the hourly load. LWSVR is compared with LWR and Local SVR using APE, MAPE, Normalized Mean Square Error (NMSE), and Relative Error Percentage (REP).
In [39], forecasting of day load in power market using wavelet neural networks is presented. Similar day concept is used here as in [36] which employs similar hour method. Based on correlation analysis, wavelet decomposition and ANN, the similar day load is selected as input load. ANN is used to capture the features of load at low and high frequencies. A regional transmission organization’s daily load data, same week day index and weather related variables like cloud cover, precipitation, wind chill temperature, humidex are used to build the model. Load is divided into low and high frequency components and separate model is developed for both of them. Numerical testing validates the accuracy of the model as better.
6. PRICE FORECASTING
Price is a core element of the competitive electricity market. It helps power suppliers to devise optimal bidding strategy in order to maximize the profit and consumers to derive purchase schedules to obtain maximum power with minimum expenses. Accurate price forecasting leads to more benefits whereas inaccuracy results in greater losses [40]. It is significant for government's macroeconomic decision-making and related business behaviour. Electricity price is closely related to weather conditions, electricity demand, availability of generating units, etc., contains nonlinear and highly volatile data. Due to the high volatility of electricity prices, consumers may decide to modify their demand profile to reduce electricity costs. Therefore, how to develop an electricity price forecast framework which can provide fast and high-quality forecasting has attracted widespread concerns ever since the establishment of electricity markets.
376 Che and Wang [43] have used SVR and Auto-regressive integrated moving average (ARIMA) models to forecast next week prices of an electricity market. The SVR-ARIMA method keeps the linear patterns undamaged compared with NN method. Root Mean Square Error and MAPE values show that this model outperforms the existing neural-network approaches and the traditional ARIMA models.
7. SUMMARY
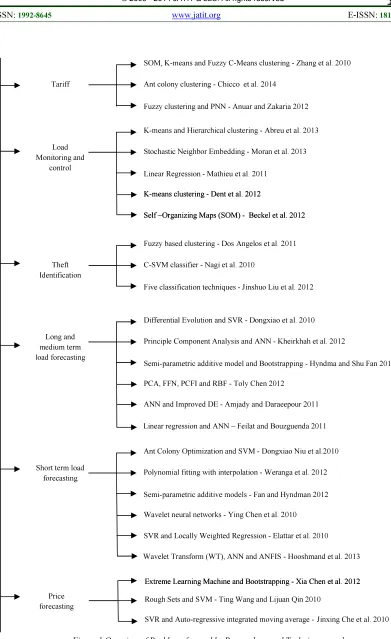
Figure 1 provides the overview of areas where computational intelligent techniques assist in exploration of the power meter data and benefits concerned people. SVM are getting widely used for both classification and regression. More clustering and classification techniques developed are used to cluster load curves that assist in formulating tariff policies, theft identification which are of great use to power distribution companies. Dimensionality reduction techniques, regression techniques, supervised and unsupervised techniques are used for load analysis and control. Peak load control aids customers to cut off costs, at the same time can eliminate blackout problems. Long and medium term forecasting assists power generators and maintainers whereas short term load forecasting and price forecasting helps market participants. Various classes of ANN are developed and SVM are modified to provide improvements. These techniques combined with methods like regression, DE, PCA, rough sets, ACO and bootstrapping are used for forecasting.
8. CONCLUSION
The prerequisite for an intelligent power distribution and consumption encourages for developing systems that use computational intelligence techniques. Since the consumption patterns are nonlinear and dynamic, the analysis of the load data is always a challenge for modern power industries. The direction of research has shifted, replacing old approaches with newer, faster methods that offer new hopes in this direction of research. There is a clear move towards hybrid methods, which combine two or more of these techniques. The new techniques offer a lot of promise for this developing and rapidly changing computational intelligence field.
REFRENCES:
[1] T. Massoud Amin S, Wollenberg BF. Toward a smart grid: power delivery for the 21st
century. IEEE Power and Energy Magazine 2005; 3: 34-41.
[2] Li, Fangxing, Wei Qiao, Hongbin Sun, Hui Wan, Jianhui Wang, Yan Xia, Zhao Xu, Pei Zhang. Smart transmission grid: Vision and framework. IEEE T Smart Grid. 2010 ; 2: 168-177.
[3] Friedrich R, Le Merle M, Peterson M, Koster A. The next wave of digitization: setting your direction, building your capabilities. Booz and Co 2012.
[4] Jianming Liu, Xiangzhen Li, Xi Chen, Yan Zhen, Lingkang Zeng. Applications of Internet of Things on smart grid in China. In: 13th International Conference on Advanced Communication Technology; 13-16 February 2011; Seoul, South Korea. New York, NY, USA: IEEE. pp. 13-17.
[5] Ye Yan, Yi Qian, Sharif H, Tipper D. A Survey on Smart Grid Communication Infrastructures: Motivations, Requirements and Challenges. IEEE Communications Surveys & Tutorials 2012; 15: 5-20.
[6] Venayagamoorthy GK. Potentials and promises of computational intelligence for smart grids. In: IEEE 2009 Power & Energy Society General Meeting; 26-30 July 2009; Calgary, Canada. New York, NY, USA: IEEE. pp. 1-6.
[7] Ramos C, Chen-Ching Liu. 2011. Intelligent Systems in Power Systems and Energy Markets. IEEE Intelligent Systems 26(2). [8] McDaniel P, McLaughlin S. Security and
privacy challenges in the smart grid. IEEE Secur Priv 2009; 7: 75-77.
[9] Chicco G, Ionel OM, Porumb R. Electrical Load Pattern Grouping Based on Centroid Model With Ant Colony Clustering. IEEE T Power Syst 2013; 28: 1706-1715.
[10] Tiefeng Zhang, Guangquan Zhang, Jie Lu, Xiaopu Feng, Wanchun Yang. A New Index and Classification Approach for Load Pattern Analysis of Large Electricity Customers. IEEE T Power Syst 2012; 27: 153-160. [11] Tsekouras GJ, Hatziargyriou ND, Dialynas
EN. Two-stage pattern recognition of load curves for classification of electricity customers. IEEE T Power Syst 2007; 22: 1120-1128.
377 PES 2009 Power Systems Conference and Exposition; 15-18 March 2009; Seattle, USA. New York, NY, USA: IEEE. pp. 1-5. [13] Chicco G, Napoli R, Piglione F. Comparison
among clustering techniques for electricity customer classification. IEEE T Power Syst 2006; 21: 933-940.Power Systems Conference and Exposition; 15-18 March 2009; Seattle, USA. New York, NY, USA: IEEE. pp. 1-5.
[14] Chicco G, Roberto Napoli, Postolache P, Scutariu M, Toader C. Customer characterization options for improving the tariff offer. IEEE T Power Syst 2003; 18: 381-387.
[15] Norhasnelly Anuar, Zuhaina Zakaria. Electricity Load Profile Determination by using Fuzzy CMeans and Probability Neural Network. Energy Procedia 2012; 14: 1861-1869.
[16] Moran A, Fuertes JJ, Prada MA, Alonso S, Barrientos P, Diaz I, Dominguez M. Analysis of electricity consumption profiles in public buildings with dimensionality reduction techniques. Eng Appl Artif Intel 2013; 26: 1872-1880.
[17] Dent I, Craig T, Aickelin U, Rodden T. An approach for assessing clustering of households by electricity usage. In: 12th Annual Workshop on Computational Intelligence; 5-7 September 2012; Edinburgh, Scotland.
[18] Abreu JM, Camara Pereira F, Ferrao P. Using pattern recognition to identify habitual behavior in residential electricity consumption. Energ Buildings 2013; 49:479-487.
[19] Mathieu JL, Price PN, Kiliccote S, Piette MA. Quantifying Changes in Building Electricity Use, With Application to Demand Response. IEEE T Smart Grid 2011; 2: 507-518.
[20] Reinhardt A, Baumann P, Burgstahler D, Hollick M, Chonov H, Werner M, Steinmetz R. On the accuracy of appliance identification based on distributed load metering data. In: 2012 Sustainable Internet and ICT for Sustainability; 4-5 October 2012; Pisa, Italy. New York, NY, USA: IEEE. pp. 1-9.
[21] Balijepalli VSKM, Pradhan V, Khaparde SA, Shereef RM. Review of Demand Response under Smart Grid Paradigm. In: IEEE PES 2011 Innovative Smart Grid Technologies;
1-3 December 2011; Kollam, Kerala, India. New York, NY, USA: IEEE. pp. 236-243. [22] Beckel C, Leyna Sadamori, and Silvia
Santini. Towards automatic classification of private households using electricity consumption data. In : Proceedings of the Fourth ACM Workshop on Embedded Sensing Systems for Energy-Efficiency in Buildings, 2012; New York, USA. ACM. pp. 169-176.
[23] Nagi J, Yap KS, Sieh Kiong Tiong, Ahmed SK. Nontechnical Loss Detection for Metered Customers in Power Utility Using Support Vector Machines. IEEE T Power Deliver 2010; 25: 1162-1171.
[24] Jinshuo Liu, Huiying Lan, Yizhen Fu, Hui Wu, Peng Li. Analyzing Electricity Consumption via Data Mining. Wuhan University J Nat Sci 2012; 17: 121-125.
[25] Dos Angelos EWS, Saavedra OR, Cortes OAS, De Souza AN. Detection and Identification of Abnormalities in Customer Consumptions in Power Distribution Systems. IEEE T Power Deliver 2011; 26: 2436-2442.
[26] Depuru SSSR, Lingfeng Wang, Devabhaktuni V. Support vector machine based data classification for detection of electricity theft. In: IEEE PES 2011 Power Systems Conference and Exposition; 20-23 March 2011; Phoenix, AZ, USA. New York, NY, USA: IEEE. pp. 1-8.
[27] Azadeh A, Ghaderi SF, Tarverdian S, Saberi M. Integration of artificial neural networks and genetic algorithm to predict electrical energy consumption. Appl Math Comput 2007; 186: 1731-1741.
[28] Jianjun Wang, Li Li, Dongxiao Niu, Zhongfu Tan. An annual load forecasting model based on support vector regression with differential evolution algorithm. Appl Energ 2012; 94: 65-70.
[29] Kheirkhah A, Azadeh A, Saberi M, Azaron A, Shakouri H. Improved estimation of electricity demand function by using of artificial neural network, principal component analysis and data envelopment analysis. Comput Ind Eng 2013; 64: 425-441. [30] Hyndman RJ, Shu Fan. Density Forecasting
378 [31] Toly Chen. A collaborative fuzzy-neural
approach for long-term load forecasting in Taiwan. Comput Ind Eng 2012; 63: 663-670. [32] Feilat EA, Bouzguenda M. Medium-term load
forecasting using neural network approach. In: IEEE 2011 PES Conference on Innovative Smart Grid Technologies; 17-20 December 2011; Jeddah, Saudi Arabia. New York, NY, USA: IEEE. pp. 1-5.
[33] Amjady N, Daraeepour A. Midterm Demand Prediction of Electrical Power Systems Using a New Hybrid Forecast Technique. IEEE T Power Syst 2011; 26: 755-765.
[34] Weranga KSK, Chandima DP, Munasinghe SR, Kumarawadu SP, Harsha AM. Short-term electricity demand forecasting method for smart meters. In: IEEE 2012 6th International Conference on Information and Automation for Sustainability; 27-29 September 2012; Beijing, China. New York, NY, USA: IEEE. pp. 266-272.
[35] Fan S, Hyndman RJ. Short-Term Load Forecasting Based on a Semi-Parametric Additive Model. IEEE T Power Syst 2012; 27: 134-141.
[36] Hooshmand R, Amooshahi H, Parastegari M. A hybrid intelligent algorithm based short-term load forecasting approach. Int J Elec Power 2013; 45: 313-324.
[37] Dongxiao Niu, Yongli Wang, Desheng Dash. Power load forecasting using support vector machine and ant colony optimization. Expert Syst Appl 2010; 37: 2531-2539.
[38] Elattar EE, Goulermas J, Wu QH. Electric Load Forecasting Based on Locally Weighted Support Vector Regression. IEEE T SYST MAN CY C 2010; 40: 438-447.
[39] Ying Chen, Peter B. Luh, Che Guan, Yige Zhao, Laurent D. Michel, Matthew A. Coolbeth, Peter B. Friedland, Stephen J. Rourke. Short-Term Load Forecasting: Similar Day-Based Wavelet Neural Networks. IEEE T Power Syst 2010; 25: 322-330.
[40] Zareipour H, Canizares CA and Bhattacharya K. Economic impact of electricity market price forecasting errors: a demand-side analysis. IEEE T Power Syst 2010; 25: 254-262.
[41] Xia Chen, Zhao Yang Dong, Ke Meng, Yan Xu, Kit Po Wong, H. W. Ngan. Electricity Price Forecasting With Extreme Learning
Machine and Bootstrapping. IEEE T Power Syst 2012; 27: 2055-2062.
[42] Ting Wang, Lijuan Qin. Application of SVM based on rough set in electricity prices forecasting. In: Proceedings of the 2010 international conference on environmental science and information application technology; 2010. pp. 317–320.
379
Figure 1 Overview of Problems focused by Researchers and Techniques used
K-means clustering - Dent et al. 2012
Self –Organizing Maps (SOM) - Beckel et al. 2012
Wavelet Transform (WT), ANN and ANFIS - Hooshmand et al. 2013 Wavelet neural networks - Ying Chen et al. 2010
SVR and Locally Weighted Regression - Elattar et al. 2010
Extreme Learning Machine and Bootstrapping - Xia Chen et al. 2012
Rough Sets and SVM - Ting Wang and Lijuan Qin 2010 Fuzzy based clustering - Dos Angelos et al. 2011
C-SVM classifier - Nagi et al. 2010
Five classification techniques - Jinshuo Liu et al. 2012 Theft
Identification Tariff Formulation
SOM, K-means and Fuzzy C-Means clustering - Zhang et al. 2010
Ant colony clustering - Chicco et al. 2014
Fuzzy clustering and PNN - Anuar and Zakaria 2012
Linear regression and ANN – Feilat and Bouzguenda 2011 PCA, FFN, PCFI and RBF - Toly Chen 2012
ANN and Improved DE - Amjady and Daraeepour 2011 Long and
medium term load forecasting
Differential Evolution and SVR - Dongxiao et al. 2010
Principle Component Analysis and ANN - Kheirkhah et al. 2012
Semi-parametric additive model and Bootstrapping - Hyndma and Shu Fan 2010
Short term load forecasting
Ant Colony Optimization and SVM - Dongxiao Niu et al.2010
Polynomial fitting with interpolation - Weranga et al. 2012
Semi-parametric additive models - Fan and Hyndman 2012 Load
Monitoring and control
K-means and Hierarchical clustering - Abreu et al. 2013
Stochastic Neighbor Embedding - Moran et al. 2013
Linear Regression - Mathieu et al. 2011
K-means clustering - Dent et al. 2012
Self –Organizing Maps (SOM) - Beckel et al. 2012
Price forecasting