QUANTUM SEGMENTATION APPROACH FOR VERY HIGH
SPATIAL RESOLUTION SATELLITE IMAGE: APPLICATION
TO QUICKBIRD IMAGE
1
SALAH EDDINE MECHKOURI, 2RACHID ZENNOUHI, 3SALEH EL JOUMANI, 4
LHOUSSAINE MASMOUDI, 5JAVIER GONZALEZ JIMINEZ 1, 2, 3
PhD. Std., LETS/Géomat Laboratory, Physics Dept. Faculty of Science of Rabat, Mohammed V– Agdal University, Morocco
4
Prof., LETS/Géomat Laboratory, Physics Dept. Faculty of Science of Rabat, Mohammed V–Agdal University, Morocco
5
Prof., E.T.S.I. Informática, Dept. of System Engineering and Automation, University of Málaga, Spain 1
[email protected], 2 [email protected], [email protected], 4
[email protected], 5 [email protected]
ABSTRACT
Through previous studies on the extraction of information for the land use and land cover, and the segmentation for the Very High Spatial Resolution Satellite Images –VHSRSI– have shown satisfaction, such as the unsupervised classification (ISODATA and KMEANS) and the hierarchical analysis of the 2D-histograms. However, in various situations, closed areas are classified as homogeneous. We believe that the quantum mechanics theory which is connected with information theory in communication and digital image processing, could take into account more information about pixels classification process and permits to distinguish between closed distinct areas. Based on this theory, we develop a new image segmentation algorithm for Very High Spatial Resolution Satellite Images. Pixels classification is performed by unsupervised classification method via the hierarchical analysis of the 2D-histograms which is constructed using the wavefunction. The proposed approach has been tested on synthetic image, and applied to urban environment classification for Quickbird data of a selected urban zone of the region of Rabat-Sale-Zemour-Zayer, prefecture of Skhirat-Temara, Morocco.
Keywords: Classification, 2D-histogram, Wavefunction, Quickbird image, Segmentation
1. INTRODUCTION
Land cover refers to the physical characteristics of earth’s surface, captured in the distribution of vegetation, water, soil and other physical features of the land. Land use refers to the way in which land has been used by humans and their habitat [1]. Identification of land cover and land use in urban environment can be achieved by pixels multispectral image classification using a segmentation method. For that, new generation of very high spatial resolution imaging sensors like Ikonos and Quickbird creates strong expectations for the remote sensing of urban areas, such as urban land cover and land use [2].
Segmentation is the technique and procedure used to divide the image into non-overlapping different regions according to their characteristics. Pixel values in the same region have similar attributes, while pixel values between different regions have dissimilar attributes. Various methods have been developed and used relatively with success, which can be roughly classified into
several categories according to the dominant features they employ, such as, edge-based methods [3], region growing methods [4], neural networks methods, physics based methods [5],[6],[7] and histogram thresholding methods [8].
In this occurrence, the classification algorithms based on 2D-dimensional histogram analysis, which is obtained by the projection of the multi-dimensional histogram on two color planes, have been developed and used with success [9],[10].
So to overcome this problem a new generation of segmentation method is needed. So, based on the quantum theory information, we develop a quantum segmentation method. This method is related to a practical evaluation of the algorithm applied to land cover and land use classification for Quickbird image of a selected urban zone in Skhirat-Temara, (NW of Morocco).
This study is divided into two parts. The first one consists of a theoretical analysis of the new digital color segmentation method, based on the hierarchical analysis of 2D-histograms [9],[11],[12], which is constructed using the wavefunction for a particle in a 2-D box. The segmentation algorithm is performed by reclassification of the pixels that are not classified in the determined classes according to Euclidian distance. The second is related to a practical evaluation of the algorithm applied to land cover and land use classification for Quickbird image of a selected urban zone
2. QUANTUM APPROACH
In this study, we assimilate a satellite image as an RGB image, where each component can represents any image band.
2.1 Model Of The Particle
[image:2.595.305.505.473.620.2]In the model of the particle in a two-dimensional box (Figure 1), we consider a particle that is confined to a rectangular plane, of length Lx in the X direction and Ly in the Y direction.
Figure 1
The potential energy is zero everywhere in this plane, and infinite at its walls and beyond (Equation 1). ∞ < < < < = , 0 0 , 0 ) , ( otherwise y L y and x L x y x V (1)
The wavefunction is now a function of both
x
andy
, and the Schrödinger equation forthe system is thus:
ψ ψ ψ E y x m = ∂ ∂ + ∂ ∂ − 2 2 2 2 2 2 h (2) Where:
h
is the reduced Planck’s constant, 2π h = hm is the particle mass, and E is the energy eigenvalue.
This equation is solved by the technique of separation of variables Ψ(x,y) = Ψ(x)Ψ(y) . Each of these two variables is the same as the particle in a one-dimensional box, so we may immediately write down the solutions:
) sin( 2 ) ( x L x x n x L x x n π ψ = (3) ) sin( 2 ) ( y L y y n y L y y n π ψ = (4)
The property of a particle in a box that needs to be examined is the probability density, which according to the born interpretation is given by: |Ψ|²
2.2 Model Of The Satellite Image
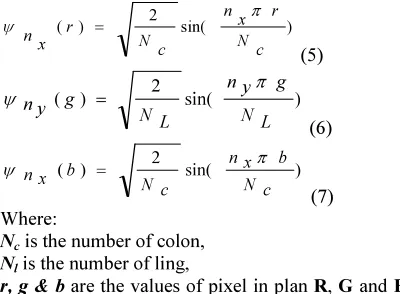
According to the quantum approach, we associate to each pixel of the image component a three wave function according the different plan of image (R, G and B) (Figure 2). This wavefunction evolving according to the stationary Schrödinger equation: ) sin( 2 ) ( c N r x n c N r x n π ψ = (5) ) sin( 2 ) ( L N g y n L N g y n π ψ = (6) ) sin( 2 ) ( c N b x n c N b x n π ψ = (7) Where:
Nc is the number of colon, Nl is the number of ling,
r, g & b are the values of pixel in plan R, G and B respectively of the image.
We apply this technique on the grayscale and color image in RGB space. In this way, we construct the histogram 2D using (wavefunction) Ψ and (probability density) |Ψ|².
Figure 2
A 2D-histogram of a color image I maps P(Ψx,Ψy), the number of pixels in I presenting the wavefunction (Ψx,Ψy). Since each wavefunction axis of I is quantified on 256 levels, the 2D-histogram can be represented by an image J whose spatial resolution is equal to 256x256. The value P(Ψ,Ψ) of the pixel of coordinates (Ψx,Ψy) in J is obtained by a linear dynamic contraction of the histogram between 1 and M=min(Pmax,255):
− + − − = min max max min ) 2 , 1 ( ) 1 ( ) 2 , 1 ( p p p Mp x x p M round x x n p (8) Where: Pmin and Pmax are respectively the minimum and maximum values of P.
3. CLASSIFICATION METHOD
In the second step, we use the classification algorithm proposed by Clément [7] for detecting the peaks which represent classes. This procedure is a version of the classical water-filling algorithm proposed by Vincent [8]. A peak is labeled as significant if it represents a population greater than or equal to a threshold d0 (expressed in per cent of the total population in image). Finally, we perform the segmentation algorithm by reclassification of the pixels not classified in the determined classes, according to Euclidian distance.
4. EVALUATION FUNCTION Q(I)
In order to evaluate the segmentation results, we have used the Q function proposed by Borsotti [14].
) 2
2 ) (
11 log
2 ( 000 10 1 ) ( i N i N R R
i Ni
i e R
N I
Q ∑ +
= +
× × =
(9)
Where: I is the segmented image, N is the image size, R is the number of regions of the segmented image, Ni is the area of the ith region, R(Ni) is the number of regions having an area equal to Ni, and ℮i is the average color error of the ith region, which is defined as the sum of the Euclidean distances between the RGB color vectors of the pixels of the ith region and the color vector attributed to the ith region in the segmented image. The smaller the Q
value, the better the image segmentation method.
5. QUICKBIRD IMAGE DATA
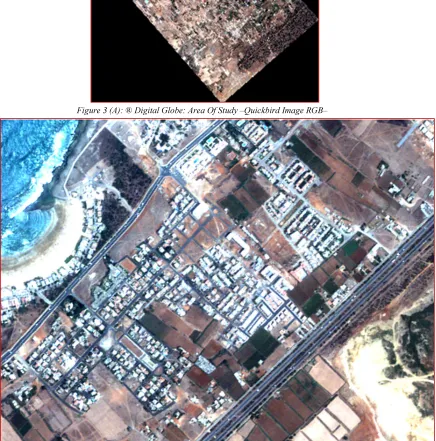
The Quickbird image (Figure : 3) retained for this work is a selected urban zone of the region of Rabat-Sale-Zemour-Zayer, prefecture of Skhirat-Temara, Morocco, delimited between longitude φ=7°0’55.08”W and latitude λ=33°56’34.57”N, and covers about 90 Km². In Figure 3, a RGB321 color composition of the image is shown. It is apparent that the variety of land cover and land use units existing in the zone. This image was captured on June 15, 2006. It is presented in two forms: The first one is panchromatic image with resolution 0.6 meters, and the second one is multispectral with resolution 2.4 meters by the channels Red, Green and Blue as well as the Near Infra-Red channel. More specifically, our region of interest is delimited between longitude φ=6°57’58.87”W and latitude λ=33°55’35.99”N
Table 1: Quickbird Image Characteristic:
Band Wavelength
(n m)
Spatial Resolution
(m)
Blue 450-520 (485)
2.4
Green 520-600 (560)
Red 630-690 (660)
Near Infra-Red 760-900 (830)
6. RESULTS
The experiments presented here concern the pixels classification of both synthetic image, and the classification of our Quickbird image in the different land cover and land use classes.
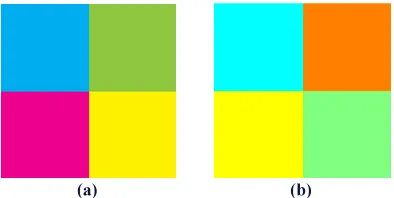
Firstly, to evaluate the proposed technique, the color image is selected: the 465x386 synthetic Squares, which comprises of four colors, from the results, it can be seen that its performance is acceptable for synthetic image (Figure: 4).
(a) (b)
[image:3.595.309.506.616.715.2]6.1 Grayscale Image
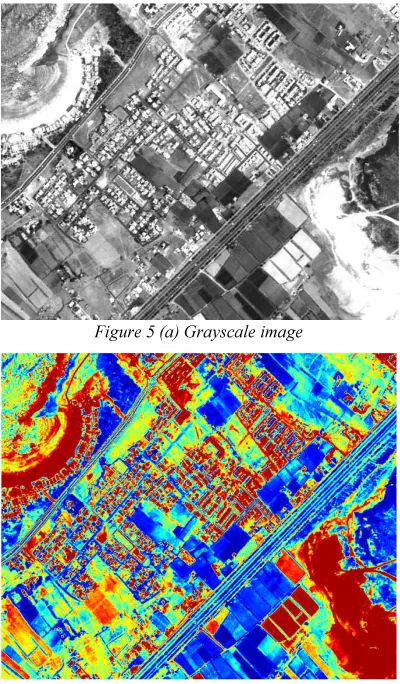
Secondly, we have applied the proposed algorithm to urban land cover classification. The results obtained by the ψ 2
method for grayscale image are presented in the following figure (Fig 5). Finally, to evaluate the proposed technique, we have used the Q evaluation function Q (Equation 9). From Table 1, it can be seen that the proposed method performs better than the hierarchical analysis of 2D color histograms using RGB space.
Figure 5 (a) Grayscale image
Figure 5 (b) Segmentation image using proposed method
6.2 Color Image
The figure 6 presents the result for color image. Figure 6(b) present the result of segmentation using the RG-histogram. The table -2- shows that this is the best result obtained using a two-dimensional histogram in RGB space, the value of evaluation function Q is the smallest and equals 434.6381.
While the best result obtained using 2D histogram constructed by ψ is present in Figure 6(c), the value of Q is 637.0482. Concerning the
method using
2
ψ
is the best among all other
techniques and for all plans (table -2- ).
Figure 6 (a) Original image RGB
Figure 6 (b) Segmented image using RB-histogram
[image:4.595.309.513.95.653.2] [image:4.595.90.290.242.584.2]Figure 6 (D) Segmented Image Using RB-Histogram Constructed By |Ψ|²
7. CONCLUSIONS
A new segmentation algorithm has been developed based on the principal of quantum mechanics. The algorithm was applied to a Quickbird image. The obtained pixels classification is satisfactory. The developing method is very promising. A future research effort need to be directed towards high spectral resolution satellite image for the use of hyperspectrales data nevertheless raises many problems, such as Hughes phenomenon or "curse of dimensionality" problem that is causing the reduction research information in hyperspectrales imaging.
ACKNOWLEDGEMENTS
The author acknowledges the financial support received from AECI “Agencia Española de Cooperación Internacional” for the PCI-Mediterranean program Project / Morocco-Spain that provided the image data.
REFRENCES:
[1] Lizarazo l., “Urban land cover and land use classification using high spatial resolution images and spatial metrics” In Proceedings of the 2nd workshop of the EARSEL SIG on land use and land cover, Bonn, Germany, September 2006; pp. 292-298
[2] Cheng H.D.; Jiang X.H.; Sun Y. and Wang J.,
“
Color image segmentation: advances and prospects”, Pattern Recognition, 2001, 34, pp. 2259-2281.[3] Maxwell B. A. and Shafer S.A.,
“
Physics-based segmentation: looking beyond color”,
Proceedings of Image Understanding Workshop, 1996
[4] Bouda B.; Masmoudi Lh.; and Aboutajdine D.,
“
CVVEFM: Cubical voxels and virtual electric field model for detection in color images”,
Signal Processing, Elsevier, 2008, 88, pp. 905-915.[5] Ortega M.; Rui Y.; Chakrabarti K.; Warshavsky A.; Mehrotra S. and Huang T. S.,
“
Supporting Ranked Boolean Similarity Queries in MARS. IEEE Trans, on Knowledge and Data Engineering, 1998, 10(6), pp. 905-925.[6] Clément A. and Vigouroux B.,
“
Unsupervised segmentation of scenes containing vegetation (Forsythia) and soil by hierarchical analysis of bi-dimensional histograms”,
Pattern Recognition, Letters, 2003, 24, pp. 1951– 1957.[7] Vincent L. and Soille P.; (1991);
“
Watersheds in digital spaces: An efficient algorithm based on immersion simulation”,
IEEE Trans; Pattern Anal; Mach Intell, 1991, 13 (6), pp. 583–598.[8] Onyango C.M. and Marchant J.A.; (2001);
“
Physics based color image segmentation for scenes containing vegetation and soil; Image Vision Compute, 19, pp. 523-538.[9] Zennouhi R. and Masmoudi Lh.,
“
A new 2D-Histogram scheme for colour image segmentation”
, The Imaging Science Journal, 2009, 57, pp. 260-365.[10] Lezoray O. and Cardot H,
“
Hybrid color image segmentation using 2D histogram clustering and region merging”
, In ICISP; 2003, 1, pp. 22–29.[11] Zennouhi R.; Masmoudi Lh. and El Ansari M.,
“
RGB Image Segmentation Using Hierarchical Analysis of 2D-Histograms: Application to Menthe Plant”
. International Conference: Sciences of Electronic; Technologies of Information and Telecommunications; 2009 – TUNISITable -2- Values of evaluation function Q for various methods
Color image
Grayscale image Plan (R, G) Plan (R, B) Plan (G, B)
Histogram 2D using Ψ 637.0482 696.3135 1192.9 522.9024
Histogram 2D using |Ψ|² 305.5231 249.0161 505.8211 271.1887
Figure 3 (A): ® Digital Globe: Area Of Study –Quickbird Image RGB–
[image:7.595.95.518.88.434.2] [image:7.595.96.532.259.700.2]