RESEARCH ON SPATIAL INDEX OF ELECTRIC GIS
1WANG XIAOHUI, 2WU KEHE AND 3CHEN FEI
1 Postdoctoral Mobile Research Station of Management Science and Engineering, North China Electric
Power University,Beijing, 102206, P. R. China
2 School of Control and Computer Engineering, North China Electric Power University
Beijing, 102206, P. R. China
3 School of Control and Computer Engineering, North China Electric Power University
Beijing, 102206, P. R. China
E-mail:[email protected] , [email protected] , [email protected]
ABSTRACT
In the electric GIS, facilities in different voltage levels show a different proportion, and topological relations exist in line and point. According to the limitations in multi-scale representation and topological connection of traditional spatial index, an extended R-Tree model based on multi-scale clustering(MCER Tree) is proposed, which removed the restrictions of the same height of all leaf nodes, but increased pointer to line list of spatial object. This paper focused on the structure, generation algorithms and insertion algorithms of MCER Tree, and finally proposed the future research.
Keywords: Electric GIS, Spatial Index, MCER Tree, Cluster Analysis.
1. INTRODUCTION
The characteristics of modern grid contain large amount of data, complex electrical wiring, frequent dynamic change, and real-time demands. In order to meet the requirements of the grid "safe, reliable, high-quality, efficient and economic operation", it needs to use information and management tools for planning and designing, enhancing equipment asset management, operating and monitoring, improving supply reliability and power quality, realizing the digital and informationalized grid, finally providing customers with high-quality, efficient and safe service. According to the status of power grid, we supposed to build Electric GIS platform, which integrated business applications, shared business data, and supplied with integration interface, to achieve the goal of grid integration and sharing of information. The management, query and analysis of spatial data is the core of Electric GIS. This paper designs spatial index method, in order to improve the efficient of spatial search and analysis.
Experts and scholars have researched spatial data management of Electric GIS in many ways. The author designed Spatial Data Model of Electric GIS[1], which is the basis of the index. Literal 2 designed and realized distribution network database based on geodatabase and case tools, optimized the data structure, and made sure the efficient of
Electric GIS[2]. Chen realized data sharing between electric application programs using multi-source data communication technology on the basis of Electric GIS platform[3]. Literal 4 presented a new TDLRtree index structure for spatio-temporal database to describe the topology of power system, the algorithm traversed original tree changed instead of tree restructure, and improved the calculation efficiency[4].
Power facilities managed by Electric GIS had the following characteristics: topology and semantic correlation between facilities; point and line, not planar; a uniform distribution of facilities; topological connection between lines facilities and point-like facilities such as substations, towers.
In this paper, the author first analyzed the limitations of power facilities spatial index with traditional R-tree, and then supposed Electric GIS spatial index model- Multi-scale Cluster Expanded R-tree (MCER-tree), finally, designed the generating and inserting algorithm of MCER-tree.
2. ELECTRIC GIS SPATIAL INDEX WITH
R-TREE
The goal of R-tree is to improve the efficiency of spatial data queries, which contains range query(search for spatial objects within a given range), point location query(a special case of range query), nearest neighbor query(search for the nearest spatial objects of a given object), and so on. Traditional R-tree index improved the response speed by the minimum bounding rectangle (MBR) of the spatial elements, so the node splitting algorithm directly affected the performance of R-tree and query efficiency in the generation, insertion and query of R-tree.
Spatial data management of Electric GIS, not only manage the data of equipment attribute in equipment space, and the geographical distribution data in geographic space, but also manage the network topology data in logical space and the device performance data in electric physics space, in addition, also need to integrate power rules and electric operation parameters. According to the complex features of electric spatial data, using the traditional R-tree in the Electric GIS had many limitations, mainly in the following aspects:
(1) Traditional R-tree requires to put the space adjacent objects in the same node, while there are topology and semantic correlation between power facilities, such as it needs to retrieval facilities repeatedly within a range in the power calculation; query the in and out line of substation when checking the substation working conditions; and check all the towers of a line when power outage analysis. Therefore, the design of spatial index tree of Electric GIS needs to consider the clustering features of facilities, at the same time, calculate the semantic distance between facilities in the node splitting.
(2) The traditional R-tree was for all types of spatial object, including point, line, surface, body,
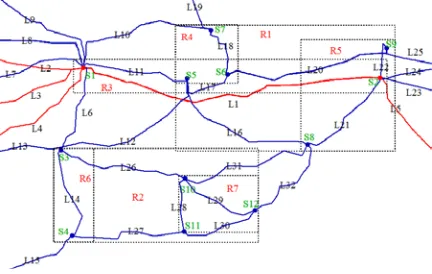
[image:2.612.314.530.251.388.2]and it needs to consider all the types when generating, inserting, and deleting of the R-tree. However, the objects in Electric GIS are almost point, such as substations, towers, switches, monitoring equipment, etc., at the same time, lines are to join the point like equipment, as figure 1(red expresses 500kV, blue expresses 220kV, and point represents the substation, line represents the transmission lines, dashed box represents the minimum bounding rectangle). So Electric GIS has obvious characteristics of the rules, the index of which needs to be extended from the traditional R-tree, to achieve efficient indexing for point and line.
Figure. 1 Relationship Of Point And Line
(3) Leaf node of traditional R-tree keeps only minimum bounding rectangle of spatial object and a pointer to the spatial object, while for the power topology analysis, it needs to record the topological connection between equipment, for example, the outlet and into line of the substation. So expanding the leaf node structure of point to generate line index, can avoid the overlap and coverage of minimum bounding rectangle of line, and ensure the validity of spatial index.
(4) All leaf nodes of traditional R-tree are in the same level of the tree, because all the objects have the same display level and the access frequency, while the electric facilities have the characteristics of loading in different grades and resolutions, such as, substation and line are divided in accordance with the voltage level, the higher the voltage level, the less the number of spatial object, the display resolution is smaller. So the spatial index of Electric GIS needs to be implemented with the level of the spatial object.
inserting, deleting, searching algorithm, finally analyze the efficiency of MCER-tree.
3. STRUCTURE OF MCER-TREE
MCER-tree is an extension of the R-tree in the Electric GIS scenarios, the basic idea of which is: (1) expanding the data structure of leaf node based on the semantics associated characteristics of the power facilities; (2) generating the line index using the R-tree of point-like equipment, to avoid multi-channel query because of too large overlapping and covering area caused by the minimum bounding rectangle; (3) designing multi-level leaf node on the basis of characteristics that electric equipment load in different grades and resolutions, to achieve high-grade facilities efficient query analysis; (4) in the generation and operation algorithm of tree, considering the topology and semantic association of the spatial object, to make the leaf node according with power topology.
For M order MCER-tree, M is the maximum number of one node, assuming m (2≤m≤M/2) is a manipulated variable, to set m the minimum number of a node in any level. So MCER-tree node can be defined as four tuples: (Identifier, I Object_ID Pointers), described as follows:
(1) Each node includes the index entries between m and M, unless it is the root node at the same time;
(2) The root node has at least two children, unless it is a leaf node;
(3) Non-leaf node is as the index directory and not store spatial objects, so it is simplified as triples (Identifier, I, Pointers), Identifier is identification, I is minimum bounding rectangle of all child nodes, and Pointer is a pointer to the child node;
(4) It allows the leaf nodes at different levels in the tree, the high-grade space depth, m value is relatively small, the depth of the low level of space objects in the tree, m value is relatively large object in the tree;
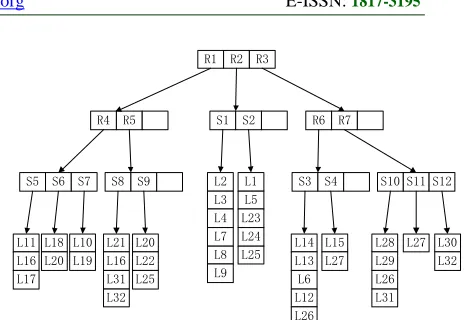
[image:3.612.311.543.81.241.2](5) The leaf node stores spatial objects, and every node is represented as four tuples (Identifier I ObjectID Pointers), Identifier is identification, I is position coordinates of spatial object, ObjectID is the identification of spatial object, and Pointers is described as two cases: point-like facility records the semantics associated point of current spatial object, while line facility records the identity of the starting point (or end) of the line to the current spatial object;
Figure. 2 Structure Of MCER Tree
(6) Leaf node points to all of the lines associated with the node, each line connecting two nodes, so the two cases: if two nodes are the children of the same parent node, the corresponding line stores in the list of pointers of the closer point from the center; if two nodes belong to different parent nodes, the corresponding line is respectively stored into the two-node pointer linked list.
According to the above definition, the difference between MCER-tree with traditional R-tree is mainly in the last two points, which are also the limitations of traditional R-tree applied to Electric GIS. The MCER-tree in Figure 1 can be represented as Figure 2.
4. KEY ALGORITHMS OF MCER-TREE
4.1 Generating Algorithm of MCER-tree
This section discusses the generating algorithm of static MCER-tree. The process used cluster analysis algorithm, and the cluster process considered semantic distance and different grades and resolutions between spatial objects. The semantic distance factor could improve the semantic correlation between the R-tree node, while the factor of spatial objects in different grades and resolutions respectively clustering could improve efficiency of spatial connection and nearest neighbor queries. The following is an example of a transmission line index, which detailed spatial index generating. The transmission lines are connection between substations, so MCER-tree of transmission line could be generated by the substations, and it needed to consider the different voltage levels of 500kV, 220kV, 110kV. GenerateTree algorithm is as follows:
GT1 Cluster the substation respectively in accordance with the voltage level, assuming N is the number of 500kV substation, m and M represent the minimum and maximum number of MCER-tree
R1 R2 R3
R4 R5 S1 S2 R6 R7
S5 S6 S7 S8 S9 L2 S3 S4 S10 S11 S12
L3 L4
L1 L5
L11 L16 L17
L18 L20
L10 L19
L21 L16 L31 L32
L20 L22 L25
L7 L8 L9
L23 L24
L25 L14L13
L6 L12 L26
L15 L27
L28 L29 L26 L31
node, k is the number of cluster, the range of k is [N/M N/m], and the initial value is [N/M].
1.1 Introducing a distance threshold, select k cluster centers with k-means method, and sign as node1, node2 ... nodek;
1.2 Based on the following Formula (1) of calculating semantic distance, assign the rest substations to the most appropriate clustering, and sign as C1, C2, ... Ck, where SemD(node, nodei) expresses the semantic distance between current substation and the ith cluster center, EuD(node, nodei) expresses the Euclidean distance between current substation and the ith cluster center, T(node, Ci) expresses the number of topological connection between current substation and the ith cluster center. Update each cluster center after the process.
( , i) ( , i) ( , i)
SemD node node =EuD node node −T node C
(1) 1.3 Repeat 1.2 until cluster center unchanged. If the number of any cluster is greater than M, continue to cluster the corresponding spatial objects, and then calculate the value of the evaluation function P according to the unit area number of disk accesses of the R-tree the region query performance model. If the number of spatial objects of any cluster is less than m, sign P as ∞;
1.4 k++, if k < [N/m], repeat the above steps;
1.5 Finally select the smallest value k of evaluation function as the cluster number, and record cluster results;
1.6 Cluster the substations of all voltage levels with the same clustering methods.
GT2 Generate R-tree of 500kV substation with the minimum display resolution.
2.1 According to the cluster of 500kV substation generated in GT1, build R-tree with the bottom-to-up method, and make sure all leaf nodes are in the same depth, and have the same fan-out factor as [m, M];
2.2 According to the description of MCER-tree structure (6), generate lines linked list for each leaf node, and point all the leaf nodes to the list.
GT3 Expand the existing 500kV substation R-tree according the cluster of 220kV substation.
3.1 Take the 220kV substation MBR generated in GT1, and continue to cluster. First select k initial cluster centers, sign as MBR1, MBR2, ……MBRk;
3.2 Select non-cluster mbr, calculate the semantic correlation between mbr with each cluster centers,
which condition is topology connected relationship between the substations in the mbr;
3.3 Recalculate the cluster centers, and repeat 3.2, until clustering results unchanged, record clustering results;
3.4 Merge the clustering results with 500kV substation R-tree generated in Step 2 with the condition of minimum coverage, and ensure the leaf node of same voltage level in the same level of the tree, at the same time the leaf node of different voltage level in different level of the tree;
3.5 According to the description of MCER-tree structure (6), generate lines linked list for each leaf node, and point all the leaf nodes to the list.
GT4 Repeat GT3, until equipment of all voltage levels are integrated to the MCER-tree.
4.2 Inserting Algorithm of MCER-tree
Insertion of MCER-tree is similar to the R-tree, the difference is due to different grades and distinct manifestations of leaf nodes. This section introduced the optimized insertion algorithm of MCER-tree, because the node overflow caused by inserting had a great influence on the performance of R-tree. The algorithm made the nodes often simultaneously accessed in the same node, while nodes few simultaneous accessed in a different node. InsertRecord(MCER, Line, S1, S2, Grade) was described as follows:
The parameters introduction: MCER is the exist tree, line is the line to be inserted, S1 and S2 are the initiation and termination substation, Grade is object grade.
IR1 Judge S1 and S2 exist in the MCER-tree or not, if so, turn IR4, otherwise turn IR2;
IR2 Select the level values of Grade in the MCER-tree, and calculate the semantic distance between S1 (and/or S2) and each leaf node. Select the minimum distance as the inserted leaf node, sign as InsertedLeaf;
IR3 Insert to the InsertedLeaf, if the number of nodes in the InsertedLeaf is greater than M, then call the OverFlow algorithm, otherwise, insert the node into InsertedLeaf;
When the node fan-out coefficient is greater than M caused by node inserting, it needs to call the overflow process, whose algorithm is as follows, OverFlow(MCER, InsertedLeaf, S, Grade):
The parameter introduction: MCER is the exist tree, InsertedLeaf is the node of overflow process, S is the index entry to be inserted, Grade is object grade.
OF1 Take all the spatial objects in the InsertedLeaf, sign as S1, S2... SM, and make k=2 cluster with S;
OF2 Calculate the semantic distance between any two spatial objects, and select the largest as the initial cluster centers. According to the semantic distance, if the number is equal to m when the rest of the spatial objects are added to one cluster, then stop, the cluster process ends;
OF3 Add the two new leaf nodes to the parent node of InsertedLeaf according to the clustering results, if overflow occurs, then turn OF4, otherwise turn OF6;
OF4 If grade is the maximum, that is, the leaf node level is equal to the height of the tree, then call the overflow recursively in accordance with the R-tree growing algorithm, and turn OF6;
OF5 If the overflow occurs in the intermediate level leaf node, re-allocate the spatial object to the sibling of the parent node, which is not full, and adjust the tree of the Grade layer, and otherwise call the overflow recursively in accordance with the R-tree growing algorithm;
OF6 Adjust the MCER tree structure, change the minimum bounding rectangle with the bottom-to-up method, and complete overflow algorithm.
The deleting algorithm of MCER-tree is adverse to the inserting algorithm, for example, the underflow process of deleting algorithm is adverse to the overflow process of inserting algorithm. The deleting algorithm will delete the linked line list before the corresponding node (if the node does not have the incidence relation). The underflow will happen when the child of leaf node is less than m.
5. CONCLUSIONS
This paper analyzed the limitations of power facilities spatial index with traditional R-tree, and then supposed the MCER-tree as Electric GIS spatial index model, which built the line index tree with point index, and reduced the area of coverage and overlap among nodes. At the same time, using the cluster method to inserting and deleting
algorithm of MCER-tree. For Electric GIS, the MCER-tree was more efficient than the traditional spatial index algorithm, but there was still imperfect aspect of the research subject, and the following is the future direction for the research:
(1) The minimum bounding rectangle of point-like facilities may not cover all of the lines range. Querying the line out of the mbr may result in the loss of the line;
(2) It is difficult to decide the depth of different grade, and it is possible to cause the depth of the tree too large because of the grade of the leaf node;
(3) The prerequisite of building the tree structure of line with point-like facilities is integrating data and complete topological relationships, so how to improve the quality of data is a major research direction in the future.
6. ACKNOWLEDGMENTS
The authors are grateful to the anonymous referee for a careful checking of the details and for helpful comments that improved this paper. At the same time, Wang Xiaohui author thanks for Chinese Society of Electrical Engineering “power youth technological innovation projects” and the Fundamental Research Funds for the Central Universities.
REFERENCES
[1] Wang Xiaohui, Wu Kehe, Xu Yuhan. The Data Model and structure of Power GIS. Grc 2011, Kaohsiung, Taiwan, 2011
[2] FENG Xiao-liang,XU Xuequn,HU Se, et al. Design and realization of distribution network databased based on geodatabase and Case tool[J]. Power System Protection and Control,2007,35(10):59-63
[3] CHEN Yong-hua, CHEN Gen-yong, ZHANG Cheng-shun, et al. Research of multi-source data communication based on electric GIS[J]. Power System Protection and Control,2011,39(7):115-119
[4] XIE Da,YU Jiang-yan,TANG Yin-chu, et al. Application of TDLRtree index structure and implementation algorithm for spatio—temporal database in substation simulation system[J]. Power System Protection and Control, 2008, 36(22):44-49
[6] Guttman. A. R-trees: a dynamic index structure for spatial searching. In Proceedings of the ACM SIGMOD Conference on Management of Data, pages 47–57, 1984
[7] ZHANG Ming-Bo,LU Feng,SHEN Pai-Wei,et al. The Evolvement and Progress of R-Tree Family[J]. CHINESE JOURNAL OF COMPUTERS, 2005,28(3): 289-300
[8] Sellis T.K., Roussopoulos N., Faloutsos C.. The R+-tree: A dynamic index for multi-dimensional objects. In: Proceedings of the 13th VLDB, Brighton, England, 1987, 507~518 [9] Kamel I., Faloutsos C.. Hilbert R-tree: An
improved R-tree using fractals. In: Proceedings of the 20th VLDB, Santiago, Chile, 1994, 500~509