291
SPECTRUM SENSING SCHEMES FOR STATIC PRIMARY
USER SIGNAL UNDER AWGN AND RAYLEIGH FADING
CHANNELS
1WASAN KADHIM SAAD, 2MAHAMOD ISMAIL, 3ROSDIADEE NORDIN, AND 4AYMAN A.
EL-SALEH 1,2,3
Department of Electronics, Electrical & System Engineering, Faculty of Engineering and Build
Environment, University Kebangsaan Malaysia, 43600 Bangi, Selangor, Malaysia. 1
Department of Communications Engineering, Engineering Technical College-Najaf, Foundation of Technical Education, Baghdad, Iraq.
4
Faculty of Engineering, Multimedia University, 63100 Cyberjaya, Selangor, Malaysia. E-mail: [email protected], [email protected], [email protected],
4
ABSTRACT
This paper taught the performance of the proposed sensing models, namely, constant false alarm rate-dynamic waveform detector (CFAR-DWD) are categorized as rate-dynamic threshold (DT), two-stage (TS), and adaptive two-stage (ATS) detection for accurately detecting of the static-primary user (PU) signals, where the state of the PU signal not change during the sensing duration. Whereby it is carried out by deriving a closed-form expressions for the average detection probability for the proposed models over AWGN and Rayleigh fading channels under low signal-to-noise ratio (SNR) environments. In addition, complete mathematical analysis for the normalized throughput and average channel capacity of the secondary network are developed over AWGN and Rayleigh fading channels to demonstrate the impact of the opportunistic spectrum access. Comparison based on simulation was performed of the detection performance and the normalized throughput among the proposed CFAR-DWD, CFAR-DED and conventional schemes. The simulation results demonstrate that the proposed CFAR-DWD can achieve a precise detection performance significantly outperformed that of the CFAR-DED and conventional schemes. Furthermore, there is a significant impact on the detection performance of the CFAR-DWD and CFAR-DED models by Rayleigh fading, and the impact of Rayleigh fading gets clearer when reduces to (0.01) and reaches up to (0.9), which will lead to poor spectrum usage.
Keywords: Dynamic waveform detection (DWD), Dynamic energy detection (DED), Constant false alarm rate (CFAR), AWGN channel, Rayleigh fading channel, Hard decision combining (HDC) rules.
1. INTRODUCTION
The need for radio spectrum is critically increasing with the significant increase in the number of users using wireless services. Thus, the increased demand for the spectrum is expected to continue in coming years with the continuous appearance of the new wireless devices and applications. A key technology that can help mitigate the scarcity of spectrum is cognitive radio [1]. To improve spectrum use effectiveness, cognitive radio (CR) technology has been suggested by getting the CR user acting as SUs that opportunistically access frequency bands which are under-utilized by licensed users or primary users (PUs). These under-utilized spectrum bands are
292 select any SS technique to meet the requirements specified for the SS. As well as, the SS techniques should be able enough to detect the PU signal with the false alarm probability is
(
≤
0
.
1
)
, detection probability is(
≥
0
.
9
)
, and with very low receiver sensitivity being -116 dBm (SNR = −22 dB) [4-5], thus, the low-SNR assumption is fairly reasonable.The most common major local sensing techniques for SS in CRN is energy detection (ED) which does not require prior knowledge of PU signal [6]. Also, ED is classified as a simple as detection technique with a short sensing time requirement. However, it performs poorly in low signal-to-noise ratio (SNR) environment. Thus, ED owns fast processing capability, low computational complexity and high flexibility [7]. Other common spectrum sensing techniques are based on the determination of existence of signal transmissions of the PUs during the observation process made by local CR users. Examples of these schemes are matched filter [5], cyclostationarity feature detection [8], and waveform based sensing or coherent sensing [9].
A. Related Work
To achieve higher sensing performance, collaborative SS is required to improve the detection probability, to shorten the detection time and to attain improved data fusion results, thereby improving the sensitivity of the cognitive receiver. However, collaboration among SUs has been introduced through a number of authors [10], [11] in order to alleviate the effects of uncertainties from multipath fading and shadowing. The problem of combining multiple sensing decisions from collaborated SUs, which is commonly known as the data fusion problem, has also been considered in [12-13]. In [12], a logic OR combining rule based HDC is presented for CSS to combine decisions from several SUs. In [13], the authors compared two simple schemes of hard decision combining (HDC), namely AND rule and OR rule detectors and they claimed that OR rule is better than AND rule.
In [14], the authors proposes energy detection algorithm based on dynamic threshold to overcome to the drops quickly in the detection performance and detection sensitivity with the increase of average noise power fluctuation. The effect of noise uncertainty factor and dynamic threshold on the detection performance is considered in [15], where spectrum sensing is used with energy detection of the PU signal. Furthermore, the authors solve the
achievable detection performance through derived the empirical relationship between the sampling number and SNR for all-SNR environments.
A longer sensing period provides the best performance of detection with the shorter transmission duration. While, a shorter sensing period provides a higher throughput of the SU with the longer transmission duration. Therefore, a trade-off results means that the SU must balance the speed of sensing versus the quality of sensing. In addition, choosing a certain sensing parameters (i.e. single channel sensing time, transmission time, and sequential channel sensing time) based on the PU traffic pattern can achieves optimal throughput while meet different constraints (i.e. average sensing time and interference to PU) [16-17].
In [18], the problem of sensing throughput trade-off was mathematically formulated by using ED as a SS scheme over AWGN and the simulation results showed that there is only one optimal sensing time at which the highest throughput for the secondary network is achieved. In addition, in [19], the authors consider the secondary throughput as a performance metric in order to measure the detection error probabilities. Whereby the detection error probabilities can be reduced through increasing the sensing time, this works to reduce the transmission time, and thus the throughput of the SU. Furthermore, in [20], the authors developed a general framework for deriving the transmission capacity and spatial throughput of spatially Poisson distributed ad hoc networks for fading channels.
B. Contributions
Since the IEEE802.22 WRAN standard is interested in the SS in very lowSNR region (< -20dB), thus the main objective from this paper is investigate the various proposed CFAR-DWD spectrum sensing models to detect about the static -PU signals under low-SNR environments over AWGN and Rayleigh fading channels. However, the idea of the proposed models are motivated by the lack of evaluation on the impact of noise power fluctuation which significantly affects the detection performance in multipath fading environment. Under our proposed models, each SU dephases its transmitted signal and HDC rules of the sensors’ decisions is implemented at the fusion centre (FC). More specifically, and based on above observations for the previous works, the contributions of this paper are as follows:
293 for the average probability of detection over AWGN and Rayleigh fading channels for variety of the proposed SS scenarios which include; DT, TS, and ATS models under certain transmission conditions, precisely when SNR is sufficiently low.
b) Benchmarking is carried out by comparing the detection performance of the proposed models with that of the constant false alarm rate-dynamic energy detection (CFAR-DED) schemes and conventional scheme under low-SNR environments. These proposal models aims to enhance detection performance for the
static-PU signals compared with the CFAR-DED models and conventional (i.e. WD scheme based on average noise power without uncertainty).
c) Analytical performance evaluation for the selected DWD based on ATS model as a SS scheme in terms of normalized throughput and average channel capacity in CRN over AWGN and Rayleigh fading channels is performed for different HDC rules.
d) Consider the optimal sensing time for the single channel sensing to maximize the normalized throughput under AWCN and Rayleigh fading channels through used the counting rule based CSS as the fusion rule at the FC.
The rest of this paper is organized as follows: Section 2 introduces the concept of traditional detection assumption of static-PU signal. Section 3 explains a general description of the waveform detector scheme. Section 4 presents the derivations of detection probability for the proposed CFAR-DWD models over AWGN and Rayleigh fading channels. Section 5 presents analysis of the normalized throughput and average capacity of the secondary network for the CFAR-DWD based on ATS model over AWGN and Rayleigh fading channels. Section 6 conveys a discussion on the obtained results. Finally, brief concluding remarks of the study is drawn in Section 7.
2. STATIC PRIMARY USER SIGNAL
SCENARIO
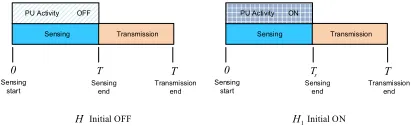
All the traditional detectors is formulated on the assumption a static-PU signal model, which mean that the PU signal remains in the same state (ON, when PU is fully present, or OFF, when PU is completely absent) during the sensing period as illustrated in Figure 1 which represent example of no PU state change. This figure explain that the sensing cycle typically consisting of sensing duration and transmission duration. However, the assumption of static-PU can be satisfied if the
sensing period is short, and thus the probability of observing the changes of the PU through this duration is almost negligible. In other words, for the
static-PU signal, no change in the PU state (i.e. L = 1), where L is the positive integer represented the number of noticed PU states through Ts. Thus, the
probability of no PU state change is P(L=1). Figure 1 shows the activity pattern of static-PU scenario for two initial state, where H1 announced
when PU ends in ON state, while H0 announced
when PU ends in OFF state. This figure denote the probability that the licensed channel is either busy or idle through the whole sensing duration. However, PU activity pattern can be defined as the traffic statistics of the PU networks as an independent and identically distributed (i.i.d.) ON/OFF random process. Therefore, we can conclude that the traditional detection model supposedly PU activity to be static within the sensing duration, that is mean that only one PU state is noticed through sensing duration [21], [22].
H H1Initial ON
T 0 Ts
Sensing start
Sensing end
Transmission end Sensing Transmission PU Activity ON
Sensing Transmission PU Activity OFF
Initial OFF
T
0 T
Sensing start
Sensing end
Transmission end
Figure 1: Activity Pattern of static-PU scenario.
Moreover, for the conventional detection model assumption of static-PU, the maximum sensing duration of noticing one PU state is
T
s,max. Wheremax , s
T
must be short enough to guarantee that no change in the PU state within sensing duration. In the same time, the short sensing durations work to decrease the sample size of the detection and thus reduces the performance of detection. Thus, static -PU can be approximated through constrainings
s
T
T
,max≥
. However, the better detection performance happen when the sensing period be long with taking into consideration the restrictions of no change in the PU state, and this occurs when the Ts is equal to theT
s,max. Thus, if the meanprobability of noticing one PU state is greater than or equal to the sample size of noticed PU signal
(i.e.,
P
N1≥
M
) , then we can conclude that thereis no change in the PU state (i.e., static-PU) within the sensing duration. As a consequence,
P
N1 as a function of maximum sensing duration of noticing [image:3.612.315.522.346.409.2]294 one, while the probability of noticing more than one state of the PU can be considered unimportant.
In addition, the minimum SNR of noticing one PU state
(
η
1min)
that can be successfully detected with the availability two of the operational conditions in the sensing period, such as,T
s,maxandmaximum sample size of noticing one PU state
)
(
M
1max=
T
s,maxB
, where B is the bandwidth ofthe PU channel. Therefore,
η
1min necessary to investigation a given detection requirements enjoined by the PU (i.e., maximum and minimum required probability of detection and probability of false alarm, respectively) with the restriction of no change in the PU state can be given as follows,[
1 1]
2max 1 min
1 (2 ) (2 )
2
d f Erfc P P
Erfc M
−
− −
=
η
(1)where Pd and Pf is the probability of detection and
probability of false alarm for the conventional DWD scheme. Therefore, the operational conditions necessary to investigate detection requirements for application of CR include of maximum sensing period and minimum SNR of the PU signal. As a consequence, the proposed CFAR-DWD models of the static-PU are formulated in this chapter to reflect the PU behaviour as either fully present or completely absent during the sensing duration.
3. CONVENTIONAL WAVEFORM
DETECTION SCHEME
Many well-known types of communication control signals are being used in wireless systems such as cyclic prefixes, pilot styles, spreading sequences, etc. These control signals are employed for the sake of signal detection as well as to assist synchronization and other purposes. Waveform-based sensing or coherent sensing takes advantages of the availability of these specific control signals and it is only used in the systems that has perfect knowledge about PU signal styles. In addition, the SU signal has to be synchronized with the PU signal. Thus, in the presence of a known PU signal, the waveform sensing detector works based on associate the known sequences or patterns of PU signal of itself with the received signal in a coherent detection process.
The SU senses a PU channel and observed a signal Yi(k) through the sensing duration. The
traditional signal model assumes static-PU signal,
and therefore the signal observed under hypothesis
H0 contains noise n(k) only, while PU signal x(k) to
be detected corrupted by noise for the observed signal under H1, respectively. Thus, the SS process
is a binary hypothesis testing problem. The received complex baseband-equivalent signal composition at the SU under this binary hypothesis is defined for
kth sample, 1 ≤ k ≤ M, and ith CR user, 1 ≤ i ≤ N, as follows:
+
=
0 1
)
(
)
(
)
(
)
(
)
(
H
k
n
H
k
n
k
h
k
x
k
Y
i
i i
i
(2)
where
x
i(
k
)
is the pilot signal, which is transmittedby the PU and is presumed to be real, synchronized and exactly known to the SU. M is the sampling interval.
n
i(
k
)
is a zero-mean additive white Gaussian noise (AWGN) and the correlation between this noise and any signal is zero, but it is Gaussian distributed for the limited sample sizeused in sensing, i.e.
n
i(
k
)
~
N
(
0
,
σ
n2)
.h
i(
k
)
is the amplitude gain of the channel between the PU and SU that which presumed to be 0 under hypothesis H0 and 1 under hypothesis H1,respectively.
Y
i(
k
)
is the output of the WD by the ith SU.
The AWGN channel represents a simple wireless channel model that does not consider the impacts of inevitable fading, such that the waveform detector decides on the presence of the signal
x
(
k
)
in (2) according to the decision variable in light of noise uncertainty. Therefore, the output of the WD which services as decision test statisticT
(
Y
i)
for a static -PU signal at each SU is the correlation between thepilot signal and the received signal
Y
i(
k
)
is given as follows:∑
−=
=
10
)
(
)
(
)
(
M
k i i
Y
k
x
k
Y
T
(3)When PU is static, the received signal of the SUs contain two different hypotheses. Thus, the test statistic of the waveform detector for hypothesis H0
(i.e. PU does not exist) and for hypothesis H1 (i.e.
PU does exist) is given in as follows [23-25],
( ) ( )
∑
−=
=
10 0
0
:
(
)
M
k
i
n
k
x
k
Y
T
295
( ) ( )
∑
∑
−= −
=
+
=
10 1
0 2 1
1
:
(
)
(
)
M
k M
k
i
x
k
n
k
x
k
Y
T
H
Thus, the normal distribution for limited sample size of
T
0(
Y
i)
andT
1(
Y
i)
when the energy of thepilot signal is
∑
[
]
=
σ
η
M
n
M
k
x
(
)
2 2 given asfollows:
H
0:
T
0(
Y
i)
~
ℵ
(
0
,
M
σ
n4η
)
(5)(
σ
2η
σ
4η
)
1
1
:
T
(
Y
i)
~
M
n,
M
nH
ℵ
The DWD calculates the decision threshold
γ
and compares it with the test statistic generated from thestatic-PU signal that remains in the same state during the sensing period. This threshold is optimized with respect to the test statistic under the null hypothesis H0 and alternate hypothesis H1 to achieve the desired detection performance, as measured by the probability of false alarm and probability of detection. Thus, CFAR method was applied in this chapter to address the threshold selection for DWD. This method is a common approach for determining the decision threshold to satisfy a certain probability of false alarm. Moreover, we restrict the decision threshold limits
as
(
σ
n2≤
γ
≤
σ
s2)
. Thus, many samples of the noise would be detected as PU signal if the decisionthreshold is smaller than the noise power
σ
n2, because of which the probability of false alarm PFwould be very high. Numerous samples of the PU signal would miss detected if the decision threshold
is larger than the signal power
σ
s2, because of which the probability of detection PD would be verylow [26].
We assume that all users utilize waveform detector as well as the same decision rule (i.e. same threshold,
γ
). According to the Nyquist sampling theorem, the number of sampling M can be represented as2
BT
s, where the minimum sampling rate equal to2
B
. These assumptions make our scheme easy to analyze and represent a practical implementation. Since the distribution of the waveform detector has the same variance, thatis (
σ
x2≈
σ
n2), the signalx
(
k
)
has less effect on the variance of the decision statisticT
(
Y
i)
underH
1with the assumption of low-SNR, and the optimal threshold is
(
0
.
5
M
σ
n2η
)
.Therefore, the analysis process are illustrated in three steps as follows: Firstly, derive the test statistic
T
(
Y
i)
of the waveform detector from thereceived signal
Y
i(
k
)
for the static-PU. Secondly, the decision threshold (γ
) is calculated by using three proposed different DWD models based on the test statistic produced, assuming static-PU. Finally, comparison the test statistic (3) with the predetermined decision threshold, which was computed in (6) for case of DT, in (13) for case of TS detector, and in (22) for case of ATS detector, respectively, to generate a new performance of detection which different from the conventional detection performance. Thus, the PU is said to be presence ifT
(
Y
i)
>
γ
and make a local decision1
H
, or the lack of PU signalT
(
Y
i)
<
γ
and makea local decision
H
0. This procedure is carried outseveral times in order to produce an average detection performance to be calculated in closed form. The detection performance for the proposed CFAR-DWD models calculated based on theoretical expressions derived in next section.
4. PROPOSED DYNAMIC WAVEFORM
DETECTION (DWD) UNDER CONSTANT FALSE ALARM RATE (CFAR)
296 of detection for the CFAR-DED models under
low-SNR environments over AWGN and Rayleigh fading channels which used to comparison with the proposed CFAR-DWD models have been included at Appendix A.
4.1 Mathematical Formulation for Dynamic
Threshold based CFAR-DWD Model
Noise uncertainty (NU) decreases sensing sensitivity, which causes a sharp decline in the detection accuracy of cognitive radio. In such a case, introducing cognitive users will cause harmful interference with the PUs. Conventional WD algorithm is based on a fixed threshold and it is very sensitive to NU, thus it produced decreased the detection performance under NU environments. However, since the fixed threshold is no longer valid under NU, thus it is important to propose an active threshold algorithm based on pilot detection as an approach to address NU and enhance detection sensitivity, with the selection of a suitable threshold being an important factor to the pilot detector. We assume the active threshold factor
1
>
ϕ
, and set the active threshold value range as[
γ
ϕ
,
ϕγ
]
. Thus, for a targeted false alarm probability, the probability of detection performanceP
D*of the CFAR-DWD based on DT can be computed in closed form in terms of the error function for low-SNR and given as follows:( )
−
=
− −
η
η
η
ϕ
M
M
P
Erfc
M
Erfc
P
FD
2
2
2
2
1
2 1 ** (8)
where
P
D*is the approximation expression for the detection probability in closed form of the DWD scheme based on dynamic threshold over AWGN channel. Therefore, the SNR(
η
)
can be obtained by solving (8) as follows,( )
( )
[
]
M
P
Erfc
P
Erfc
1 F* 1 D* 22
2
2
2
− −−
−=
ϕ
η
(9)The results show that this probability relies on the SNR, as well as the number of samples (M), whereas, M= 2BTs, where B is the sensed
bandwidth that is assumed to be fixed. Thus, the number of samples needed for PU detection increase when the sensing time become longer. However, a longer sensing time will decrease the amount of data transfer time in a frame, thus resulting in a lower achievable throughput for SU.
But in accordance with IEEE 802.22 WRAN [4], the allowable limitation of the sensing time is (Ts ≤
2). Limited works has focused on analyzing the CFAR-DWD based spectrum sensing performance in low-SNR environments when the DWD simultaneously suffers from channel fading and DT effects. Therefore, through combining the impacts of multipath fading and dynamic threshold fluctuations in this work, precise predictions of detection performance are rendered with a modified version of classic CFAR-DWD model.
To study the performance characteristics of radio channels, the knowledge of probability density function (PDF) of the fading/shading influences is very necessary. Practically, fading happens due to multipath propagation and shadowing in the wireless communication applications. Given the presence of channel fading, the wireless channel imperfection is not perfectly Gaussian distributed, thus causing difficulty for the SU to obtain full information on PU presence through sensing duration. Consequently, the assumption is that the static-PU signal is subject to flat Rayleigh fading channel. Correspondingly, the approximate value of the average probability of detection over flat Rayleigh fading channel PD can
now be evaluated by statistically averaging
P
D* in (8) over the PDF of SNR under some algebraic processors [29], and it is given as follows,( )
− +
≈ − − −
η
ϕ
η
ϕ
M P Erfc
M P
P F
F D
* 1 2 2 2 *
2
* 2
4 1 exp
)
(11)
Mathematically, the approximation in the above equation is obtained with the assumption
)
1
<<
(
P
F and(
M
η
>>
1
)
. In practice, Pf isusually set very low (e.g. below 10% as required by IEEE 802.22 WRAN) [4], to guarantee the high
utilization of unused licensed spectrum. Even
η
is relatively small, the practically required large M for a lowη
can boost(
M
η
)
to a relatively high value to satisfy (19). By solving the quadraticequation in (11) for
η
givesthe required average297
(
*( )
2 *)
* 1 2
2
F D
F
P
P
Ln
M
P
Erfc
− − −
−
−
≈
ϕ
ϕ
η
)
(12)
4.2 Mathematical Formulation for Two-Stage
based CFAR-DWD Model
The performance of the pilot detector is susceptible to the uncertainty of noise power in the procedure of the threshold setting as long as the threshold used in the pilot detector depends on the noise variance, with the errors in noise variance known as noise uncertainty. Detection performance can be enhanced by a novel algorithm that considers the effects of both noise uncertainty and dynamic threshold. Thus, assuming that the actual noise power changes randomly from one detection slot to another with the uniform distribution
represented as
σ
2∈
[
σ
n2ϖ
,
ϖσ
n2]
and is unvarying throughout the duration of the detection .ϖ
denotes the coefficient of the noise power uncertainty in dB, equal to(
1
+
κ
2/
1
−
κ
1)
, where)
1
<
0
(
≤
κ
1 and(
κ
2≥
0
)
, such that(
ϖ
≥
1
)
.Therefore, for a targeted false alarm probability, the closed form probability of the detection for the CFAR-DWD based on TS model is given in terms of the error function for low-SNR as follows:
( )
−
=
− −
−
η
η ϖ η
ϖ ϕ
M
M P
Erfc M Erfc
P F
D
2 2 2
2
1 2 1 ** 1
* *
(15)
where
P
D**is the approximation expression for the probability of detection in closed form of the DWD based on two-stage scenario. As well, the SNR(
η
)
can be obtained by solving (15) as follows,
( )
( )
[
]
M
P
Erfc
P
Erfc
F D2
2 * * 1 *
* 1 2
2
2
2
−
− −
−
−
=
ϖ
ϖ
ϕ
η
(16)
In addition, if the static-PU signalis subject to flat Rayleigh fading channel, the closed-form expression for the average probability of detection
* * D
P
)
of the CFAR detector based on two-stage scenario similar to (11), becomes as follows,( )
− +
≈
− − − −
−
η ϖ ϕ η ϖ ϖ
ϕ
M P Erfc
M P
P F
F
D 2
* * 1 2 2 2 2 *
* 2 *
* 2
4 1 exp
)
(18)
Solving the quadratic equation in (18)for
η
yieldsthe required average SNR, and for
(
M
>>
1
)
, we can derive the approximate value of the averageSNR for the desired performance
P
)
D**andP
F**as follows:2
(
**( )
2 **)
* * 1 2
2
F D
F
P
P
Ln
M
P
Erfc
ϖ
ϕ
ϖ
ϕ
η
− − − −−
−
≈
)
(19)
4.3 Mathematical Formulation for Adaptive
Two-Stage based CFAR-DWD Model
We can improve the detection performance of the waveform detector by proposing a new spectrum sensing scheme, which depends on the working adaptive two-stage CFAR-DWD based on noise uncertainty and dynamic threshold. This scheme assumes that the SU would estimate the SNR of the channel and depending on the SNR, the SU would select one of the spectrum sensing techniques mentioned above. The CFAR-DWD based on noise uncertainty showed poor performance under the low-SNR, thus indicating that this method is incapable of detecting channels accurately for SNR
values below the threshold. Therefore, CFAR-DWD based on dynamic threshold detection was used to sense the channels. Similar results were obtained, which revealed the incapability of CFAR-DWD based on dynamic threshold in detect channels accurately because SNR was greater than or equal to the threshold. Consequently, CFAR-DWD based on noise uncertainty detection was used for sense such channels.
Assuming that the probability of the channel would be detected by CFAR-DWD based on noise uncertainty is
P
N, and therefore, the probability that a channel would be detected by CFAR-DWD based on dynamic threshold will be(
1
−
P
N)
,where
P
N depends on the SNR of the channels to be sensed and takes on the values(
0
≤
P
N≤
1
)
.298
)
1
5
.
0
(
≤
P
N≤
, with the majority of the channelshave a very good SNR because the performance of the CFAR-DWD based on noise uncertainty is excellent under good SNR. Thus, the expression of the overall false alarm probability for this proposed scheme that directly depends on
P
Nis given as follows:(
(
)
(
)
)
(
)
)
(
)
1
(
)
(
* , * , ^ , * , ^ , ^ ^γ
γ
γ
γ
γ
i F i F i F N i F N i F N FP
P
P
P
P
P
P
P
P
+
−
=
−
+
=
(20)where,
P
F^,i andP
F*,i are the probabilities of falsealarm for the CFAR-DWD based on noise uncertainty and that based on dynamic threshold, respectively. Thus, the expression of the overall false alarm probability for the ATS become as follows: + − = 2 2 2 ^ ^ 2 2 1 2 2 1 2 2 1 n n n N F M Erfc M Erfc M Erfc P P σ η ϕγ σ η γ ϕ σ ϖ η γ (22)
In addition, the expression of the overall detection probability for this scheme that directly depends on
N
P
is given as follows:(
)
(
1
)
*,(
)
^ , ^
^
γ
γ
i D N i D N
D
P
P
P
P
P
=
+
−
(23)
where
P
D^,i andP
D*,i are the probabilities ofdetection for CFAR-DWD based on noise uncertainty and based on dynamic threshold, respectively. Thus, the expression of the overall detection probability for the CFAR-DWD based on the ATS model over AWGN channel become as follows:
( )
( )
( )
− + − − − = − − − − − − − η η η ϕ η η η ϕ η ϖ η ϖ η ϖ M M P Erfc M Erfc M M P Erfc M Erfc M M P Erfc M Erfc P P F F F N D 2 2 2 2 1 2 2 2 2 1 2 2 2 2 1 * 1 2 * 1 2 1 1 * 1 ^ ^ (24)While, if the static-PU signal is subject to flat Rayleigh fading channel, the expression of the detection probability for the CFAR-DWD based on the ATS model over Rayleigh fading channel become as follows:
( )
( )
( )
− + + − + − − + = − − − − − − − η ϕ η ϕ η ϕ η ϕ η ϖ η ϖ M P Erfc M P M P Erfc M P M P Erfc M P P P f f f f f f N D 2 4 1 exp 2 4 1 exp 2 4 1 exp 1 2 2 2 2 1 2 2 2 2 1 2 2 2 2 ^ ^ ) (25)The average detection time of the proposed CFAR-DWD based onadaptive two-stage model is given by,
(
)
−
+
=
B
M
M
M
B
P
N
T
DT DT NU N average2
2
(26)where N is the number of channels to be detected, B
is the channel bandwidth,
M
NU andM
DT are the number of samples during the observation period for each DED based on noise uncertainty and DED based on dynamic threshold detection methods, respectively. Thus, for the worst case scenario when(
P
N≈
0
)
, the probability of detection andthe total average detection time become:
* ) ( ^ ^ )
(DW
P
DWP
≈
&299 While, for the best case scenario when
(
P
N≈
1
)
,the probability of detection and the total average detection time become:
^ ) ( ^ ^
)
(DW
P
DWP
≈
&B
NM
T
NUaverage
2
≈
(28)
5. ANALYSIS OF NORMALIZED
THROUGHPUT AND TRANSMISSION
CAPACITY OF SECONDARY NETWORK
The PU activity state may change through a relatively short period, which makes it necessary for the SU to make a reliable fast decision to get a transmission opportunity. This condition produces a sensing reliability-throughput trade off which represents the characteristic of SU operation [19]. Many Given that each frame in the WRAN system with time duration, T , consists of one sensing period, Ts, and one data transmission period, T-Ts ,
thus the aim is to achieve a short sensing period, which result in long data transmission periods with higher average throughput. Thus, the normalized throughput for the secondary network during each frame with the appropriately protection of the primary network in AWGN channel can be given by,
(
)
(
)
[
01
β
0 11
β
1]
ζ
Q
FQ
DR
=
×
ℜ
×
−
+
ℜ
×
−
(26)
where R is the throughput achieved in the target sub-band,
ζ
=
(
T
−
t
s−
Nt
s)
T
is the sensing efficiency which can be defined as the ratio of the transmission period to the full sensing cycle. The probabilities of the PU when it is active and inactive in the frequency band which be sensed to clarify whether the PU is really utilizing the channel are P(H1) and P(H0), respectively, in the transmission time period, where P(H1) = 1- P(H0), thus,β
1=
P(H1),β
0=
P(H0). Also,ℜ
0andℜ
1represent the capacities of the WRAN system of the secondary network in the case of an absence the PU but the SUs declare a lack of PU (sensor decision is correct), and in the case of a presence the PU but the SUs fail to detect it (sensor decision is incorrect), respectively, under AWGN channel. These factors are given by [30]:
ℜ
0=
log
2(
1
+
η
s)
(27)
+
+
=
ℜ
p s
η
η
1
1
log
21
(28)
where
η
srepresents the SNR for the AWGN channel between the secondary transmitter and secondary receiver of the CR network (SNRs), whereasη
pis the SNR of the primary signal for AWGN channel between the primary transmitter and secondary receiver at the CRN receiver (SNRp). The SUs will share the bandwidth (BW) usage with the PUs in opportunistic systems, such that any capacity of the secondary network can be considered as addition capacity for the non-opportunistic system in the following analysis. Thus, the average capacity of the SUs is given as follows:(
)
0 1(
)
10
1
Fβ
1
Dβ
avg
=
ℜ
×
−
Q
+
ℜ
×
−
Q
ℜ
(29)
where
ℜ
avgthe average channel capacity for the AWGN channel that can be defined as the amount of data that can be transmitted reliably per second through a specific channel and depends on the degrees of freedom per second and the received power. In addition,Q
DandQ
Fare the overall probabilities of detection and false alarm for the CRN. All the above results for local SS shown that because of the uncertainty resulting from fading, the processing of the local signal alone may be insufficient to satisfy the sensing performance requirements. Thus, to address this issue and in order to mitigate the implications of multipath fading and shadowing in the wireless channels, collaborative SS is often used.The counting rule needs less data transmissions between the SUs and the FC and thus it send only the local decisions of the SUs to the FC which makes the final decision based on the number of SUs claiming the existence of the PU. Thus, the decision strategy for the CSS based on counting rule can be given as follows:
0 1
,
,
>
H
decide
K
H
decide
K
≤
∀
∀
(30)
300 threshold at FC. Therefore, hard decision combining (HDC) rules which include; AND, OR, and Majority rules are special cases of the counting rule, where choose the K at FC is optimal. Thus, for OR-rule, K= N-1, AND-rule, K= 0, Majority-rule,
K= N/2. However, obtaining the optimal value of K
is still an unsolved problem in the literature, especially for fading channel. Therefore, in this paper, we assume that K may be take any value of 0, 1, …, N-1 which represent of counter rule case. However, from our results, we can see that the DWD-based on ATS scenario significantly outperformed on the other models proposed. Thus, in this section we focused only to this model to derive the overall probability of detection under different HDC rules for N of the cooperative users gives the better possible performance for the average capacity and the normalized throughput of the secondary network over AWGN and Rayleigh fading channels. These parameters are given as follows:
- Under OR-rule
( )
( )
( )
∏
= − − − − − − − − + − − − − − = N k k F k F k F N D M M P Erfc M Erfc M M P Erfc M Erfc M M P Erfc M Erfc P Q 1 * , 1 2 * , 1 2 1 1 * , 1 2 2 2 2 1 2 2 2 2 1 2 2 2 2 1 1 1 η η η ϕ η η η ϕ η ϖ η ϖ η ϖ (31)- Under AND-rule
( )
( )
( )
∏
= − − − − − − − − + − − − = N k F F F N D M M P Erfc M Erfc M M P Erfc M Erfc M M P Erfc M Erfc P Q 1 * 1 2 * 1 2 1 1 * 1 2 2 2 2 1 2 2 2 2 1 2 2 2 2 1 η η η ϕ η η η ϕ η ϖ η ϖ η ϖ (32)- Under Majority-rule
∑
= − = N n k k k N k N D C A B Q 2 (33) where,( )
( )
( )
− + − − − = − − − − − − − η η η ϕ η η η ϕ η ϖ η ϖ η ϖ M M P Erfc M Erfc M M P Erfc M Erfc M M P Erfc M Erfc P A F F F N 2 2 2 2 1 2 2 2 2 1 2 2 2 2 1 * 1 2 * 1 2 1 1 * 1( )
( )
( )
− + − − − = − − − − − − − η η η ϕ η η η ϕ η ϖ η ϖ η ϖ M M P Erfc M Erfc M M P Erfc M Erfc M M P Erfc M Erfc P B F F F N 2 2 2 2 1 2 2 2 2 1 2 2 2 2 1 * 1 2 * 1 2 1 1 * 1where
C
Nk=
N
!
(
N
−
k
)!
k
!
. The average capacity in the Rayleigh fading channel model between the secondary transmitter and secondary receiver for (27) can be obtained in this paper by taking the PDF of the SNR(
η
s)
, i.e.[
f
ηs( )
η
s]
, asfollows,
(
)
ss s
s s SR
ST
d
η
η
η
η
η
−
+
=
ℜ
∫
∞exp
1
1
log
0 2_ (34)
By using [31], thus (27) becomes as follows,
−
−
−
=
ℜ
s i s SR STE
η
η
1
1
exp
_ (35)where
E
i(
x
)
is the exponential integral functionrelated to the function
E
1(
x
)
bydy
y
y
x
E
x
E
xi
(
)
exp(
)
)
(
11
=
−
−
=
∫
−
∞ −
. Thus,
301
∫
∞
−
−
=
ℜ
1_
exp
.
ln
.
1
exp
1
dt
t
t
s SR STη
η
η
(36)In the same manner, the average capacity in the Rayleigh fading channel between the primary transmitter and secondary receiver for (28) can be obtained through taking the average of the capacity in AWGN over the statistics of the Rayleigh fading channel as follows,
+ + + + = ℜ + ∞
∫
p s p s p s SRPT f d
p s η η η η η η η η 1 1 1 1 log 1 0 2 _ (37)
where
η
pis the SNR of the primary transmitter and secondary receiver channel, and the PDF of the(
s p)
(
s p)
f
η 1+ηη
1
+
η
can be obtained throughusing [32] as follows,
(
p)
(
s(
p)
) (
p)
p s d f f p
s η η η η η
η
η
η = + + +
+
∫
∞ + 1 1 , 1 1 0 1 (38)By assumption that
η
sandη
pare independent, thus (38) becomes as follows,(
)
( )
(
) (
)
(
)
(
p)
p p s s p p s p p s p p s d d f f f p s η η η η η η η η η η η η η η η η + + − − + = + + + = +
∫
∫
∞ ∞ + 1 1 exp 1 1 1 1 1 1 0 0 1 (39)After doing some mathematical simplifications by using [31], (39) becomes as follows,
(
)
(
)
(
)
+ + Γ + + + = + + p s s p p s p s p s p p p s p s p s f η η η η η η η η η η η η η η η η η η η 1 1 , 2 1 1 ... 1 exp 1 1 2 1 (40)where
η
, is the SNR in the fading channel, and)
.
,
(.
Γ
is the incomplete gamma function. Assuming thatη
SINR is the signal-to-interference-noise ratio of the primary transmitter and secondary receiver link that is equal to[
η
SINR=
η
s(
η
p+
1
)
]
, (38) becomes as follows,
+ Γ + = + − + s SINR p p s SINR p s p p s p s p s f
η
η
η
η
η
η
η
η
η
η
η
η
η
η
η η 1 , 2 ... 1 exp 1 1 2 1 (41)Thus, we can obtain the average capacity,
ℜ
PT_SR, by substituting (41) into (37) as follows,(
)
(
)
(
)
+ + + Γ + + + + + = ℜ∫
∞ p s p s s p p s p s p s p p p s p s SR PT d η η η η η η η η η η η η η η η η η η η 1 1 1 , 2 1 1 1 exp 1 1 log 1 2 0 2 _ (42)Therefore, after the evaluation of both the average capacities
ℜ
ST_SRandℜ
PT_SR in (36) and (42), respectively, they are substituted in (26) and (29) by using numerical methods to derive the normalized throughput and average capacity of the secondary network for the case of Rayleigh fading channel.5. SIMULATION RESULTS AND
DISCUSSIONS
302 opportunistic are presented in this section. We assume that for the proposed adaptive two-stage scheme, the simulation is performed for (PN = 0.5),
where the SU would perform the detection based on DT to sense the majority of the channels, where most of which are very noisy. The probabilities of the PU when it is active and inactive in the frequency band are P(H1)= 0.2 and P(H0)= 0.8,
respectively. In this section, we verify the theoretical detection probability expressions of the CFAR-DWD schemes by using computer simulations and then compared the results with the CFAR-DED schemes based detector. To this end, we set that the probability of false alarm (0.1). In any case, the best representation detection for all figures below was for the proposed CFAR-DWD schemes in both AWGN and Rayleigh fading channels.
Figure 2 shows a detection performance comparison between the DWD and CFAR-DED as a function of SNR under different proposed scenarios for the AWGN and Rayleigh fading channels. The current proposed algorithms for the DWD achieved improve in the detection performance compared with the DED schemes for both AWGN and Rayleigh fading channels. Moreover, we can conclude that the proposed ATS scheme significantly outperformed on the other schemes proposed for both of DWD and DED based detectors. In addition, we note that the simulation detection probabilities for all DWD schemes for both AWGN and Rayleigh fading channels will be close to one another when compared with those of the DED schemes based detector because of DED more sensitive to noise uncertainty in low-SNR.
(a) AWGN channel
[image:12.612.98.279.528.681.2](b) Rayleigh fading channel
Figure 2: Comparison of the proposed CFAR-DWD and CFAR-DED schemes for AWGN and Rayleigh fading
channels.
Figure 3 shows the evaluation of the detection performance of the CRN under different scenarios as a function of sensing time for the proposed CFAR-DWD schemes. Comparison the results with the CFAR-DED schemes for AWGN and Rayleigh fading channels at an SNR of (-20dB) is shown. The detection probability is dependent on sensing time
Ts for constant probability of false alarm because
the transmission period needs the detector to determine the detection performance and probability of false alarm. The detection performance for the CFAR-DWD schemes was better than that for the CFAR-DED schemes throughout the different sensing time values for both the AWGN and Rayleigh fading channels. Especially ATS which improves the detection performance of PU significantly and give the largest detection performance by increasing sensing time as long as the PU remains static in the case of constant bandwidth compared with other methods. Furthermore, the impact of Rayleigh fading becomes clearer, which results in poor spectrum usage. In addition, all sensing detectors can meet arbitrary detection requirements by increasing number of samples (M), where increased sensing time will increase the number of sampling for the
303 (a) AWGN channel
[image:13.612.92.290.73.436.2](b) Rayleigh fading channel
Figure 3: Comparison probabity of detection versus sensing time of the proposed DWD and DED models for
AWGN and Rayleigh fading channels.
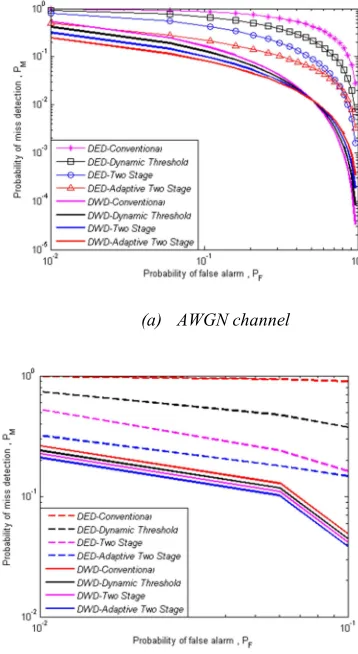
In SS, the goal is to meet a given complementary ROC constraint at very low SNR. Classical detection theory suggests that degradation in the ROC because of the lower SNR can be addressed through increasing the sensing time. Figure 4 shows a comparison of the complementary ROCs of the proposed SS scenarios based on CFAR-DWD and CFAR-DED between AWGN channel and Rayleigh fading channels. Given that the distribution of the CFAR-DWD has the same variance, that is (
σ
x2≈
σ
n2), the signal x(k) has lesseffect on the variance of the
T
1(
Y
i)
under H1 with the assumption of low-SNR, (see the normal distribution under each hypothesis for DWD in Eq. 4). Thus, the CFAR-DWD schemes work to improve detection sensitivity at low-SNR values. Also, in this study, we conduct comparisons with CFAR-DED schemes at low-SNR, unlike [15] that considered all SNR values. In this figure, it is assumed that the average SNR used is -22dB (e.g.the SNR level suggested by 802.22 working group). Generally, we can conclude that the PM versus PF
curves have a low slope for (PF < 0.1) and that
Rayleigh fading significantly impacts the detection performance of the DWD and DED schemes. Furthermore, the influence of Rayleigh fading becomes clearer when PM decreases to (0.01) and PF reaches up (0.9), which will result in poor
spectrum usage. Moreover, the results show that the proposed DWD schemes outperform the DED schemes in both AWGN and Rayleigh fading channels. Thus, for the performance of the acceptable system, we should employ good sensing schemes with sensible probability of false alarm and minimum probability of misdetection to guarantee increased channel usage without degradation the quality of service QoS of the PU.
(a) AWGN channel
[image:13.612.319.498.302.629.2](b) Rayleigh fading channel
Figure 4: Comparison the complementary ROCs of the CFAR-DWD and CFAR-DED schemes for (a) AWGN
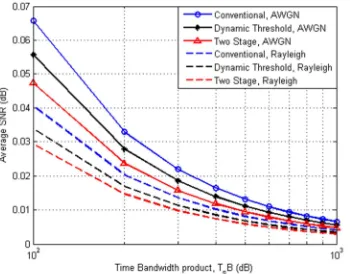
304 The required average SNR versus time BW product in the AWGN and Rayleigh fading channels with different CFAR-DWD schemes are given in Figure 5. CFAR-DWD schemes draw limitations on the minimum SNR for required detection performance. The trade-off between the required average SNR and time bandwidth product is entirely corrupted. The average SNRs necessary to achieve the desired detection performance in the CFAR-DWD based on conventional scheme are larger than those required by CFAR-DWD based on ATS scheme in both the AWGN and Rayleigh fading channels. In addition, the average SNRs necessary to investigation the desired detection performance in the Rayleigh fading channel are significantly lower than those required by the AWGN channel.
A comparison of the average capacity versus SNRs of the DWD-based on ATS scheme for both the AWGN and Rayleigh channels at different SNR values of the primary signal (SNRp) is shown in Figure 6. Thus, with limited bandwidth between SUs and the FC, the OR rule has better sensing performance than other HDC rules, and will hence achieves higher system capacity based on the TS scenario. In addition, we note that from this figure the average capacity for the DWD scheme increased with the increasing (SNRp), but the
[image:14.612.318.528.53.240.2]amount of increase in the case of the AWGN channel was significantly larger than that in the Rayleigh channel because of the influence of fading.
Figure 5: Average SNR versus time-bandwidth product of the CFAR-DWD schemes in AWGN and Rayleigh
fading channels.
Figure 6: Comparison average capacity versus SNRs of the DWD based on the ATS scheme in AWGN and
Rayleigh channels.
Figuer 7 indicates the normalized throughput comparison of the proposed cooperative CFAR-DWD sensing algorithms for OR fusion rule, and comparison these results with the traditional single-user ED. For this simulation, we suppose that the total number of the cooperative users is 20, frame duration (T=1500 ms), the sampling frequency is (6 MHz), and upper limit of probability of detection is (0.95). The simulation results show that the significant improvement on the throughput of the SU can be achieved through using the proposed DWD algorithms. Also, the proposed DWD algorithms outperforms the traditional single-user ED because the proposed algorithms produces higher transmission time (T-Ts) and lower
[image:14.612.105.280.481.618.2][image:15.612.91.292.72.239.2]
305 Figure 7: Normalized throughput versus SNR
comparison for different CFAR-DWD algorithms.
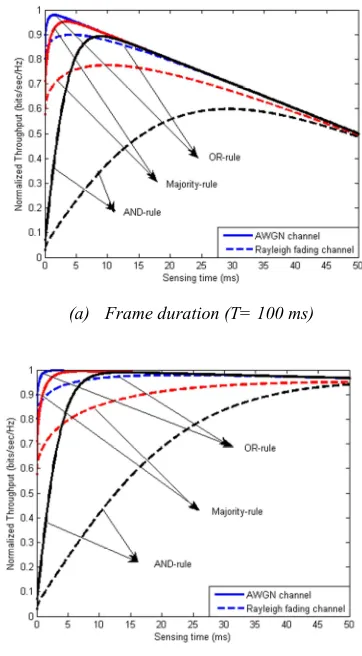
[image:15.612.331.512.336.664.2]The numerical results for the analysis of the normalized throughput of the secondary network with access of the spectrum opportunistic using the proposed CFAR-DWD based on ATS sensing method with different K (i.e. K=0, N/2, N-1) for different HDC rules (i.e. AND, Majority, OR), respectively, and different frame durations under various channels are presented in Figure 8. This figure examines the impact of static-PU on the SU throughput for different HDC rules and secondary frame durations under AWGN channel. In our simulation study, we assume that the targeted probability of detection is (0.9), the received SNR
from PU signal is (-22 dB), number of cooperative users are 20 for sensing, and the probabilities of the PU when it is active and inactive in the frequency band are P(H1)= 0.2 and P(H0)= 0.8, respectively.
Our simulation is performed at two different values from frame duration, such as, (100 ms) and (1500
ms). This figure show that the effect of sensing time on the normalized throughput of SUs for a fixed number from SUs that using to sense the channel. It is observed that there is an optimal sensing time whereby the normalized throughput of the SUs will be maximized. However, this figure indicates out that increasing the sensing time doesn't leads to an increase of the throughput of the SUs networks, but the achievable throughput of the SUs is increases with the increase the frame duration for all schemes. Furthermore, it is seen that the OR rule of the proposed sensing scheme exhibits the shortest sensing time with the highest value of normalized throughput comparison with the other combining rules. For example, for OR-rule, the maximum throughput for the AWGN channel is 0.98 at the optimal sensing time (1.1ms), while maximum throughput for the Rayleigh fading channel is 0.95 at the optimal sensing time (2.8ms) for (T= 100 ms). On the other hand, for (T= 1500
ms), the maximum throughput for the AWGN channel is 0.99 at the optimal sensing time (1.5ms), while maximum throughput for the Rayleigh fading channel is 0.98 at the optimal sensing time (2.95ms), respectively. Therefore, the AWGN channel outperforms the Rayleigh fading channel for all HDC rules in terms of the maximum normalized throughput of the SUs. In addition, it can be shown from Figure 8 that the AND rule and Majority rule are not always optimal, while the OR rule is optimal for the AWGN channel. Another phenomenon that we observe, there are bigger differences between throughput in an AWGN channel and throughput in fading channels for AND-rule (i.e. large K). However, the optimal sensing time is also increased with the increased the frame duration, but this increment is not linear for different HDC rules. Therefore, it is better to choose the maximum possible frame duration for practical application.
(a) Frame duration (T= 100 ms)
(b) Frame duration (T= 1500 ms)
Figure 8: Normalized throughput versus sensing time for static-PU with different HDC-rules and frame durations under different channels using the proposed DWD bases