MicroRNA-10b inhibition reduces E2F1-mediated transcription
and miR-15/16 activity in glioblastoma
Nadiya M. Teplyuk1, Erik J. Uhlmann1, Andus Hon-Kit Wong1, Priya Karmali2, Meenakshi Basu1, Galina Gabriely1, Anant Jain1, Yang Wang1, E. Antonio Chiocca3, Robert Stephens4, Eric Marcusson2, Ming Yi4, Anna M. Krichevsky1
1Department of Neurology, Brigham and Women’s Hospital, Harvard Medical School, Boston, MA, USA
2Regulus Therapeutics, Inc., San Diego, CA, USA
3Department of Neurosurgery, Brigham and Women’s Hospital, Harvard Medical School, Boston, MA, USA
4 Cancer Research and Technology Program, Frederick National Laboratory for Cancer Research, Leidos Biomedical Research, Inc., Frederick, MD, USA
Correspondence to:
Anna M. Krichevsky, e-mail: akrichevsky@rics.bwh.harvard.edu
Keywords: miR-10b, E2F1 transcription, p21, glioblastoma, cell cycle
Received: December 10, 2014 Accepted: December 21, 2014 Published: February 06, 2015
ABSTRACT
MicroRNA-10b (miR-10b) is commonly elevated in glioblastoma (GBM), while not expressed in normal brain tissues. Targeted inhibition of miR-10b has pleiotropic effects on GBM derived cell lines, it reduces GBM growth in animal models, but does not affect normal neurons and astrocytes. This data raises the possibility of developing miR-10b-targeting GBM therapy. However, the mechanisms contributing to miR-10b-mediated glioma cell survival and proliferation are unexplored. We found that inhibition of miR-10b has distinct effects on specific glioma cell lines. In cells expressing high levels of tumor suppressor p21WAF1/Cip1, it represses E2F1-mediated transcription, leading to down-regulation of multiple E2F1 target genes encoding for S-phase specific proteins, epigenetic modulators, and miRNAs (e.g. miR-15/16), and thereby stalling progression through the S-phase of cell cycle. Subsequently, miR-15/16 activities are reduced and many of their direct targets are de-repressed, including ubiquitin ligase FBXW7 that destabilizes Cyclin E. Conversely, GBM cells expressing low p21 level, or after p21 knock-down, exhibit weaker or no E2F1 response to miR-10b inhibition. Comparative analysis of The Cancer Genome Atlas revealed a strong correlation between miR-10b and multiple E2F target genes in GBM and low-grade glioma. Taken together, these findings indicate that miR-10b regulates E2F1-mediated transcription in GBM, in a p21-dependent fashion.
INTRODUCTION
MicroRNA-10b (miR-10b) is the most strongly up-regulated microRNA in glioblastoma (GBM) [1–4], and is a potential therapeutic target. It is overexpressed in 90% of GBM tumors across all four subtypes, while it is undetectable in normal brain tissues. Inhibition of miR-10b is deleterious for glioma cells [2]. Importantly, both modified antisense oligonucleotides (ASO) and viral “sponge” inhibitors of miR-10b cause cell death of glioma cells but not of normal brain cells [2, 5, 6], and this may present a basis for targeted therapies.
and the detailed mechanism of miR-10b regulation of cell death and proliferation remains to be investigated.
Here we demonstrate that treatment of GBM cells with miR-10b sequence-specific inhibitors delays their progression through S-phase by down-regulation of E2F1 mediated transcription. Numerous regulated transcripts include those encoding replication factors and regulators of cell cycle, as well as miRNAs of the miR-15/16 family and their downstream post-transcriptional targets. This regulation is p21-dependent: it is observed only in GBM cells expressing high levels of the p21 protein, and can be reversed by p21 knock-down. Furthermore, analysis of GBM tumors using The Cancer Genome Atlas (TCGA) indicates a strong correlation between the levels of miR-10b and numerous E2F1 target genes. These results suggest that miR-10b is a key regulator of the E2F1 transcriptional machinery controlling cell cycle progression in GBM, and is a potential therapeutic target.
RESULTS
Differential cell cycle response to miRNA-10b inhibition in GBM cells
Previous work has implicated miR-10b in regulation of the GBM cell cycle. To better understand the effect of miR-10b on the cell cycle, we studied TCGA miRNA and
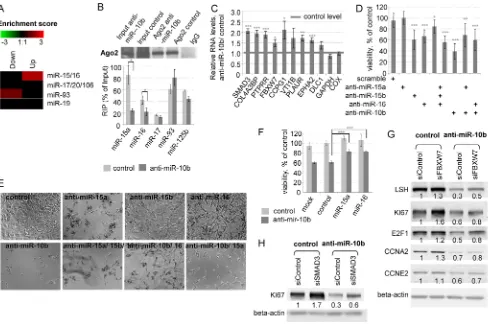
mRNA datasets (as in [2] and analyzed the correlations between the miR-10b levels and specific cell cycle related bioterms in GBM and low-grade gliomas (LGG). Strong positive correlations have been observed between the expression of miR-10b and numerous S-phase genes, and particularly, mRNA targets of E2F transcription factors (Figure 1A, Table 1, and Supplementary Figure 1). E2F transcription plays a major role during the transition through the G1/S phase of cell cycle. Among the E2F target genes exhibiting significant correlations with miR-10b levels ( p-value from 10–6 to 10–16) were subunits of
[image:2.612.96.524.392.627.2]the DNA replication complex (DNA polymerase, PCNA, DNA helicases, and ligases), regulators of nucleotide synthesis, cell cycle regulators (e.g. cyclins A2, B1, E2 and CDKs), components of chromatin assembly, PRC2 polycomb complex (EZH2, SUZ12, EED), and others. In addition, several miRNAs previously characterized as E2F transcriptional targets, also exhibited significant positive correlations with the levels of miR-10b (Table 1). This association raised the possibility of miR-10b – mediated regulation of E2F transcription. Strong correlations have been also detected between miR-10b and the genes down-regulated by p21/CDKN1A, a validated miR-10b target, suggesting that E2F- p21- targeted pathways may overlap downstream of miR-10b. In contrast, the breast cancer TCGA datasets identified no positive correlation between the miR-10b levels and cell cycle bioterms or E2F
transcriptional targets (Figure 1B). Rather, in agreement with the established function of miR-10b in breast cancer in regulating invasion and metastasis [8], the expression levels of miR-10b showed correlation with cell motility, migration, and invasion, supporting a tissue-specific mechanism of miR-10b – mediated regulation [7].
To better understand the effect of miR-10b on cell cycle progression of glioma cells, miR-10b activity was selectively inhibited with 2′-O-methoxyethyl (2′-O-MOE) antisense oligonucleotides in various GBM cell lines. The efficiency of this approach has been described previously [2]. Inhibition of miR-10b resulted in two distinct cell cycle responses in glioma cells. A172 and U87 cell lines exhibited reduction of cells in S-phase of the cell cycle, and accumulation of cells in G2/M, while LN215 and U251 cells showed no down-regulation of S-phase, with arrest in the tetraploid state (Figure 2A, 2B). Furthermore, a two-fold decrease in bromodeoxyuridine (BrDU) incorporation was
observed in A172 cells, but not in LN215 cells (Figure 2C). In order to determine the cause of the differential response of the cell lines to miR-10b inhibition, we tested these lines for expression of the tumor suppressor p21 (CDKN1A), the potent regulator of G1/S transition [9], and one of the key direct miR-10b targets [2]. We determined that glioma cells expressing high p21 level (e.g. A172 and U87) exhibited strong S-phase response to miR-10b inhibition, whereas cells with low p21 (e.g. LN215 and U251) have not (Figure 2D). Therefore, p21 may be an important mediator of the effect of miR-10b on S-phase progression.
MiR-10b inhibitor down-regulates
E2F1-mediated transcription in GBM cells with high p21 level
[image:3.612.59.556.75.486.2]To investigate whether the effect of miR-10b inhibition on S-phase progression is mediated by E2F
Table 1: miR-10b positively correlates with known E2F target genes expression in glioblastoma
tumors based on The Cancer Genomic Atlas (TCGA)
r p val. r p val. r p val. r p val.
Nucleotide synthesis Replication complex Cell cycle regulators Mitosis
DHFR 0.47 10–16 PCNA 0.39 10–11 FBXO5 0.45 10–14 PLK1 0.36 10–9
TYMS 0.38 10–10 RFC4 0.39 10–11 MYBL2 0.42 10–13 NCAPH 0.36 10–10
RRM1 0.35 10–9 LSH 0.36 10–9 CCNA2 0.40 10–11 Other
DUT 0.34 10–9 LIG1 0.36 10–8 CDC25A 0.40 10–12 EZH2 0.48 10–17
RRM2 0.33 10–8 RMI1 0.35 10–9 MYCN 0.39 10–9 MKI67 0.34 10–9
TK1 0.33 10–8 PRIM1 0.35 10–9 CDK2 0.37 10–3 SUZ12 0.32 10–8
BRCA complex POLE2 0.29 10–9 CDC2 0.37 10–3 SFRS2 0.31 10–7
BARD1 0.29 10–8 POLD3 0.33 10–8 MELK 0.36 10–9 EED 0.21 10–4
HMMR 0.27 10–6 RFC3 0.33 10–8 ATAD2 0.35 10–8 miRNA E2F1 targets:
Replication origin POLA1 0.32 10–8 CDC25C 0.33 10–8 hsa-miR-20b 0.65 10–17
MCM7 0.47 10–16 RFC2 0.29 10–6 CCNB1 0.32 10–7 hsa-miR-106a 0.63 10–17
TOP2A 0.46 10–15 FEN1 0.29 10–6 CDC6 0.30 10–7 hsa-miR-17 0.62 10–17
MCM2 0.41 10–12 BLM 0.23 10–5 E2F8 0.28 10–6 hsa-miR-20a 0.61 10–17
MCM4 0.38 10–10 Chromatin assembly BTG3 0.27 10–6 hsa-miR-93 0.60 10–17
MCM10 0.35 10–9 HMGB2 0.43 10–14 SKP2 0.27 10–5 hsa-miR-25 0.53 10–13
MCM3 0.34 10–9 DEK 0.35 10–9 CCNE2 0.22 10–4 hsa-miR-106b 0.53 10–12
MCM5 0.34 10–8 H2AFZ 0.31 10–7 E2F3 0.22 10–4 hsa-miR-19b 0.49 10–10
MCM6 0.33 10–8 ASF1B 0.28 10–6 E2F1 0.20 10–4 hsa-miR-15b 0.49 10–10
ORC1L 0.31 10–7 CHAF1A 0.28 10–4 CCND2 0.20 10–4 hsa-miR-16 0.48 10–10
Lamina assembly Repair/checkpoint
TMPO 0.36 10–9 FANCL 0.32 10–8
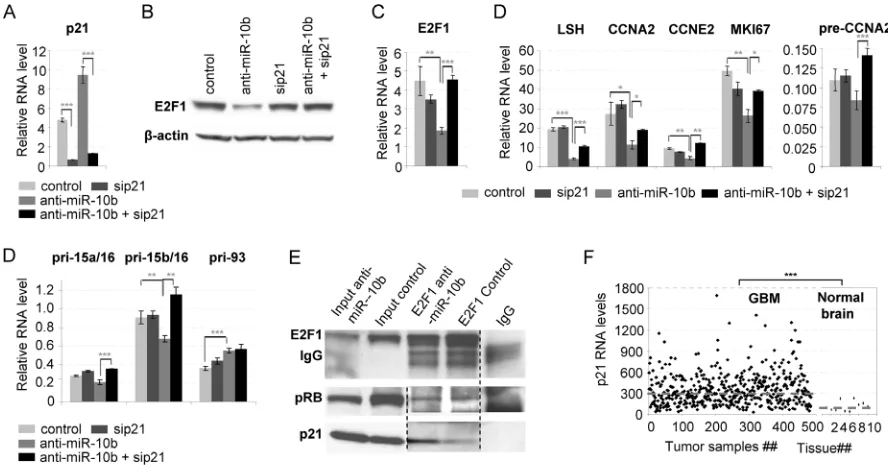
transcription factors, we first studied the expression of major E2F family members in GBM cells. In A172 and U87 cells, miR-10b inhibition strongly reduced the amount of E2F1 mRNA and protein, but not that of E2F2 or E2F3, whereas none of them was reduced in LN215 or U251 cells (Figure 2E, 2F, 2G). Furthermore, multiple key E2F transcriptional targets involved in S-phase progression, as well as E2F-regulated miRNAs miR-15a/16, miR-17, and miR-93, have been down-regulated in A172 and U87 cells (Figure 2E), while few were affected in LN215 or U251 cells (Figure 2F). Most significantly, mRNA microarray analysis of A172 cells transfected with miR-10b inhibitor exhibited enrichment of E2F1 transcripts among the down-regulated genes (Figure 3A). Investigation of additional glioma cell lines and GBM-derived neurospheres provided further
evidence of variable target genes’ response to miR-10b depletion, which correlated with the p21 levels. More prominent down-regulation of S-phase genes occurred in LN229 and LN382 cells (expressing moderate p21 level), than in GBM4, GBM8 and BT74 cells with barely detectable p21 (Supplementary Figure 2A, 2B).
[image:4.612.100.510.48.400.2]Pulse-labeling with ethinyl-uridine indicated that transcriptional rates of S-phase specific E2F targets were reduced at 18 hours after transfection with the miR-10b inhibitor (Figure 3B). Consistent with this finding, binding of E2F1 to the promoters of its target cell cycle and miRNA genes decreased dramatically upon miR-10b inhibition in A172 cells, but not in LN215 cells, as determined by chromatin immuno-precipitation (CHIP) (Figure 3C). Among others, inhibition of miR-10b reduced E2F1 binding to its own promoter, supporting
the auto-regulatory mechanism of E2F1 expression. However, E2F1 binding to the promoters of several pro-apoptotic E2F1 target genes has not changed after miR-10b inhibition in A172 cells (Supplementary Figure 3). Such difference might be due to the distinct epigenetic status of target genes, and indicate that the observed effect is restricted to the regulation of cell cycle machinery. Therefore, miR-10b inhibition repressed E2F1 expression, its activity, and E2F1-driven transcription of cell cycle-related mRNAs and miRNAs in GBM cells with high levels of p21 expression, blocking progression of these cells through the S-phase of cell cycle.
Repression of E2F1 and E2F1 target genes by miR-10b inhibition is mediated by p21
[image:5.612.82.530.49.473.2]To determine the role of p21 in the control of E2F1-mediated transcription by miR-10b, p21 expression was knocked down with small interfering RNA (siRNA) prior to miR-10b inhibition. P21 knock-down led to the rescue of E2F1 RNA and protein levels, as well as partial or near-complete rescue of many E2F1 target genes in A172 and U87 cells (Figure 4A–4D and Supplementary Figure 4A–4C). Regulation of some E2F1 target genes was completely rescued by p21 knock-down at the level
of pre-mRNA, but not of mature mRNA, suggesting an additional, post-transcriptional mechanism of regulation. Consistently, p21 knock-down rescued the effect of miR-10b inhibition on S-phase progression, but not on the progression of cells through G2 phase and mitosis (Supplementary Figure 5), indicating that miR-10b regulation of G2/M is p21-independent.
The two commonly accepted effects of p21 on E2F1 transcriptional activity are inhibition of Retinoblastoma Protein (Rb) phosphorylation [9] and inhibition of E2F1 by direct binding [10]. To test these possibilities, and validate direct interaction between p21 and E2F1, we immuno-precipitated E2F1 complexes from cells transfected with anti-miR-10b or control and determined the amount of Rb1 and p21 in the E2F1 co-immunoprecipitate. The levels of p21, but not Rb1, coimmunoprecipitated with E2F1 increased upon miR-10b inhibition, likely as the result of elevated p21 expression (Figure 4E). Interestingly, total levels of Rb1 dropped upon miR-10b inhibition, suggesting a feedback mechanism developed by cancer cells to maintain the levels of E2F activity. Therefore, miR-10b appears to regulate transcription via increased p21-E2F1 binding, rather than through Rb1.
Of note, although the proposed p21-dependent control of E2F1 activity by miR-10b was observed only in a subset
of cultured glioma cell lines, specifically those expressing high levels of p21, this mechanism may be widely applicable, as the majority of GBM tumor samples express high levels of p21 (Figure 4F, [11–13]). Furthermore, there is a highly significant correlation between levels of miR-10b and E2F1 transcripts across the TCGA GBM dataset (Figure 1 and Table 1), regardless of p21 expression.
miR-10b regulates the levels and activities of the miR-15/16 cluster
[image:6.612.83.527.48.282.2]Among the transcripts most affected by the inhibition of 10b in A172 and U87 cells, we identified miR-15/16. This miRNA family is one of the most abundant in gliomas [14], and a validated transcriptional target of E2F1 [15]. MiR-10b inhibition led to 3–5-fold reduction of E2F binding to the promoters of miR-15a/16 and miR-15b/16 (Figure 3C) and reduced the levels of their nascent precursor transcripts and mature miRNAs (Figure 2E and 3B). These data indicate that miR-10b regulates miR-15/16 expression through E2F1 transcriptional regulation. Furthermore, there was a significant correlation between the expression levels of miR-10b and miR-15/16 in the TCGA GBM set (Table 1 and Supplementary Figure 1). Moreover, many of
the predicted targets of miR-15/16 correlated inversely with miR-10b in the TCGA GBM dataset (Table 2, [16–22]). Consistently, miR-15/16 targets were also enriched among the genes de-repressed upon miR-10b inhibition in A172 cells, shown by whole genome expression microarray profiling (Figure 5A). This suggests that miR-10b controls the levels and activities of miR-15/16 in GBM.
To investigate whether inhibition of miR-10b modulates the activity of miR-15/16, the miRNA bound to Argonaut 2 was analyzed by cross-linking immunoprecipitation (CLIP) in A172 cells. The amount of miR-15a and miR-16 associated with Ago2 complex decreased upon anti-miR-10b treatment (Figure 5B), indicating that 10b modulates the activity of miR-15/16 family. Accordingly, a number of previously validated direct miR-15/16 targets have been de-repressed by miR-10b inhibition (Figure 5C); a short functional annotation of these genes is provided in Table 2. Some of these genes are known as cell cycle or tumor suppressors and therefore might be functionally involved in the cell cycle arrest caused by miR-10b inhibition.
Although the miR-15/16 family is generally considered as a tumor suppressor, and was reported to be down-regulated in many malignancies [23, 24], its expression is moderately elevated in GBM and associated with glioma progression [3, 25, 26]. To investigate the
possible role of these miRNAs in GBM, we transfected A172 cells with specific inhibitors of miR-15a, miR-15b, or miR-16, alone or in combination with the miR-10b inhibitor. MiR-15a, -15b and -16 inhibitors moderately decreased the viability of glioma cells (Figure 5D, 5E), suggesting an unusual tumor-promoting role of miR-15/16 family in GBM. There was no additive effect for miR-15/16 and miR-10b inhibitors on cell viability, implying a common pathway that includes both 10b and miR-15/16. Conversely, miR-15a and miR-16 mimics protected glioma cells against the anti-miR-10b and improved cellular viability (Figure 5F).
[image:7.612.57.564.79.398.2]To further investigate the functional contribution of miR-15/miR-16 target genes to the miR-10b-mediated cell cycle phenotype, we focused on three genes implicated in the regulation of cell cycle: FBXW7/ AGO, SMAD3, and CCPG1 (Table 2). These selected miR-15/16 targets have been knocked-down by cognate siRNAs prior to the miR-10b inhibition, and the efficiency of RNAi is presented in Supplementary Figure 6. We found that FBXW7 knock down partially rescued the miR-10b mediated down-regulation of many critical S-phase proteins, such as E2F1, LSH, Ki67, Cyclin A2, and Cyclin E2 (Figure 5G). Consistent with the function of FBXW7 as ubiquitin ligase, this rescue occurs at the protein but not mRNA expression level (Supplementary Figure 7). In
Table 2
:Functional annotation of miR-15/16 target genes de-repressed upon miR-10b inhibition in
A172 cells
Gene miR-15/16
target Ref miR-10b in TCGACorrelation with Function/relation to cancer
r p-value
SMAD3 Predicted 13 –0.20 0.0007 Regulator of cell proliferation through transduction of TGF beta and BMP signals.
COL4A3BP Predicted 14 –0.17 0.0054 Ceramide flux regulator
PTPRR Predicted 15 –0.32 0.0000
Silenced in some cancers, potential tumor suppressor. Down-regulation activates MAP kinases. Regulates cell cycle and differentiation.
FBXW7 Validated 16, 17 –0.19 0.0023 Suppressed in GBM. Potential cell cycle suppressor. Targets Cyclin E and other cell cycle proteins to proteasome comlpex.
CCPG1 Validated 18 –0.11 0.0650 Cell Cycle Progression 1. Regulates cell cycle through interaction with Rho family factors, including CDC42.
VTI1B Validated 18,19 –0.30 0.0000 Vesicles transport
PLAUR Validated 18 –0.17 0.0047 Regulates migration, invasion and angiogenesis.
EPHA2 Validated 16 –0.19 0.0020 Up-regulated in cancers, including GBM, promotes GBM invasion.
addition, knock-down of SMAD3 led to the partial rescue of anti-miR-10b-mediated down-regulation of proliferative marker Ki67, but not other tested cell cycle genes (Figure 5H). We have not detected any significant effects of the CCPG1 knock-down on the expression of tested cell cycle genes (Supplementary Figure 8). These data confirm the functional contribution of miR-15 and miR-16 targets to the miR-10b/E2F1 signaling and highlight a multifactorial regulation of cell cycle progression in GBM cells, that includes miRNA, transcriptional, and protein stability regulatory layers. These results also suggest a complex relationship between principal miRNA regulators and indicate an unanticipated tumor-promoting role for the established tumor-suppressor family of miRNAs.
DISCUSSION
MicroRNA regulate a wide range of biological processes, including development, differentiation, and phenotype maintenance. Targeting a specific set of genes to execute a developmental program, some miRNAs may act either as oncogenes or tumor suppressors, and thus represent useful targets in cancer therapy. Numerous pre-clinical, and several clinical studies have suggested the efficacy of miRNA inhibitors in disease [27], recently reviewed in [28].
[image:8.612.64.552.48.375.2]It has been previously reported that miR-10b, a miRNA most robustly up-regulated in GBM, affects both cell cycle and survival of GBM cells [2]. Initially found
to be an oncogene in metastatic breast cancer [8, 29], miR-10b appeared to play a growth-promoting role in the broad range of different cancers, including GBM, lung, ovarian, pancreatic, hepatic, thyroid, gastric, colorectal, and nasopharyngeal [5, 6, 30–39]. In tumor cells, miR-10b can act through pleiotropic mechanisms, including stimulation of cell proliferation, survival, migration, and invasion. Importantly, inhibition of miR-10b reduces the growth of cultured glioma cells and prolongs survival in mouse xenograft models of GBM [2, 5, 6]. The low or absent expression in the normal brain, in contrast with high level expression in GBM and low-grade glioma makes miR-10b an attractive therapeutic target. Better understanding of the mechanism of action of miR-10b is crucial in the development of new GBM treatments.
In this work we have further dissected the effects of miR-10b inhibition in glioma. We provide evidence that miR-10b regulates a major transcription factor, E2F1, driving cell cycle progression through the S-phase, and thus promoting proliferation. Alterations along the E2F-signaling axis, such as deactivation and mutations of Rb1 and p16/ CDKN1A, and Cdk4/6 amplification, are frequently found in GBM [40]. Our work has identified miR-10b as additional critical regulator of the E2F signaling. The association between miR-10b and E2F1 transcription, observed in TCGA not only in GBM but also in LGG, implies that miR-10b-E2F1-regulated gene expression is important at early stages of cellular transformation toward malignant glioma. miR-10b regulation of E2F1 is largely mediated via single direct target and key tumor suppressor gene CDKN1A/p21, which directly binds to and represses E2F1. The downstream cascade involves numerous E2F1 transcriptional targets critical for the chromatin remodeling, regulation of cell cycle machinery, and DNA replication. Among them are KI67 and proliferating cell nuclear antigen (PCNA), commonly accepted proliferation markers associated with course of various cancers, including malignant gliomas [41–44]. Strongly regulated by miR-10b is DNA helicase LSH, one of the key factors defining genome-wide DNA methylation pattern, expressed in undifferentiated cells. LSH promotes proliferation and prevents senescence in multiple malignancies, while its disruption causes a premature aging phenotype [45]. An additional E2F1 target regulated by miR-10b, EZH2, is the catalytic subunit of Polycomb Repressor complex 2, overexpressed in various malignancies, including GBM, that inhibits differentiation, activates cell cycle, increases cell motility, and enhances self-renewal and tumor initiating capacity [46–49]. Therefore, by restraining E2F1 transcription, miR-10b inhibition coordinately reduces the levels of many critical tumorigenic factors in glioma, some of which represent promising candidates for targeted molecular therapies. Although miR-10b regulation of E2F1 transcription occurs only in a subset of cultured glioma cell lines, the generally high levels of p21 expression in the majority of human GBM tumors [11–13], and significant
positive correlations between the levels of numerous E2F-regulated genes and miR-10b in TCGA, suggest that this mechanism is widespread in GBM. Nevertheless, additional mechanisms involved in G2/M arrest and cell death upon miR-10b inhibition, especially those common for p21-low cells, should be further investigated.
Our data also indicate that a miRNA may amplify its function by recruiting or regulating other – secondary miRNAs. We demonstrate that the miR-15/16, and to a lesser extent the miR-17/93 cluster is upregulated by miR-10b. MiR-17/93 is a family of oncogenic miRNAs, induced by E2F1, and, in turn, repressing E2F1 in a feedback loop [50, 51]. MiR-15/16 are frequently lost or reduced in malignancies, and are considered to be tumor suppressors [23, 52, 53]. In GBM, however, they are up-regulated and their expression is associated with glioma progression [3, 25]. miR-10b inhibition strongly reduces expression of miR-15a, -15b, and -16 members of the same family from two E2F1-driven promoters mapped at chromosomes 13q14.2 and 3q25.3. This leads to the significantly reduced association of miR-15/16 with Ago2 effecter complexes and de-repression of many miR-15/16 mRNA targets. Given the abundance of miR-15 and -16 in GBM, this pathway may have profound effects on the glioma transcriptome.
A consequent question is whether the activation of miR-15/16 by miR-10b serves as a negative feedback on proliferation, or miR-15/16 paradoxically promote GBM growth, in a tissue-specific manner. The suppression of glioma cell growth observed in miR-15/16 inhibition experiments, as well as the partial rescue of glioma viability provided by miR-15/16 mimics from anti-miR-10b, support the tumor-promoting role for these miRNAs in GBM, and suggest them as mediators of the miR-10b function.
of delaying S-phase progression, by targeting Germinin, DBF4 and other critical cell cycle substrates [57].
In conclusion, our data indicate that activation of miR-15/16 family through miR-10b/p21/E2F1 regulatory axis results in attenuation of FBXW7 and SMAD3, and therefore, increased levels of S-phase specific cell cycle proteins, providing support for cell cycle progression, in addition to the transcriptional up-regulation of these genes by E2F1 (Figure 6).
An important question is whether miR-10b also regulates cell cycle and E2F1 transcription in other extracranial cancers. MiR-10b has been studied intensively in breast carcinoma, where it is known to regulate invasion and metastasis, rather than cell proliferation [8]. Consistently, TCGA analysis showed no correlation between miR-10b and cell cycle bioterms, and rather negative correlation between miR-10b and E2F transcription in breast carcinoma (probably reflecting silencing of the S-phase genes and cell cycle exit, required for the cancer cell migration and invasion), and reiterating high tissue and context dependence of miR-10b regulation. Therefore, our data provide further support for the idea that miR-10b has very distinct functions in glioma and other cancers such as breast carcinomas [7].
The coordinated regulation of numerous E2F1 transcription targets, both mRNAs and miRNAs, by miR-10b in glioma, suggests this miRNA as a powerful regulator of glioma growth and, particularly, E2F1– driven oncogenesis. Of note, our results rely largely on the sequence-specific chemically modified miR-10b oligonucleotide inhibitors. This is a convenient and highly reproducible approach that has the potential as an experimental therapy. However, toxic effects arising
from the chemical modifications and off-target effects cannot be ruled out and should be carefully controlled. Complementary methods including miRNA gene knock-out, overexpression, as well as genetic epistasis should be used in further studies.
MATERIALS AND METHODS
Analysis of GBM, LGG, and breast cancer
in vivo data from TCGA
[image:10.612.165.449.461.692.2]The TCGA miRNA and mRNA expression data (either RNAseq or microarray) and metadata for various cancer patients were downloaded from the following NCI TCGA data portal:https://tcga-data.nci.nih.gov/tcga/, or Firehose data download website at Broad Institute:http:// gdac.broadinstitute.org/. In general, normalized and processed level-3 of miRNAseq and mRNAseq or level-2 data of microarray were downloaded, combined, and processed with customized R scripts (http://www.r-project.org). Specifically, for breast cancer (BRCA), Illumina GA or HiSeq platform mRNA RNAseq and miRNAseq level-3 data were downloaded and used for analysis; for Brain Lower Grade Glioma (LGG), Illumina HiSeq platform mRNA RNAseq and miRNAseq level 3 data were downloaded and used for analysis; for Glioblastoma multiforme (GBM), most recent TCGA microarray level-2 data for mRNA and miRNA were downloaded and used for analysis. The lists of mRNAs correlated with selected miRNAs (i.e, miR-10b, miR-10a, miR-21) were further analyzed for pathway enrichment patterns for multiple cancer types (GBM, LGG, BRCA) using in-house tool PPEP analysis pipeline [58] using
KEGG (http://www.genome.jp/kegg/), Biocarta (http:// www.biocarta.com/) and Gene Ontology database (GO, http://www.geneontology.org), MSigDB (http://www. broadinstitute.org/gsea/msigdb/index.jsp) as previously described [2].
Cell culture and transfections
Human GBM cell lines were obtained from American Type Culture Collection (ATCC), cultured in DMEM supplemented with 10% FBS (Gibco), and passaged by trypsinization.
MiRNA inhibitors used in this study were developed and provided by Regulus Therapeutics, Inc., San Diego, CA. The following full-length antisense 2′-O-MOE-modified oligonucleotides with phosphate backbone were used for miRNA inhibition: mR-10b
5′-CACAAATTCGGTTCTACAGGGTA-3′,
15b 5′-TGTAAACCATGATGTGCTGCTA-3′, miR-16 5′-CGCCAATATTTACGTGCTGCTA-3′, miR-15a 5′-CACAAACCATTATGTGCTGCTA-3′, and the oligonucleotide 5′-ACATACTCCTTTCTCAGAGTCCA-3′ was used as the chemistry-matched control. siRNAs for p21 knock-down were described previously [2]. The cells were transfected with miRNA inhibitors (using Lipofectamine 2000, Invitrogen) or siRNAs (using Oligofectamine) at 50 nM final concentration, according to manufacturer’s instructions. For rescue experiments, sequential transfec-tions were performed, first by transfecting the siRNA, followed by the miRNA inhibitors 24 h later.
Cell cycle analysis by propidium iodide staining and flow-cytometry
Cells were trypsinized to single cells suspension, washed with PBS, and fixed in 75% ethanol in −20°C for 24 hours. Cells were further washed with PBS-0.1% Triton X-100 and stained in 1 ml of 50 μg/ml propidium iodide (Sigma-Aldrich) and 100 μg/ml RNAse A (Sigma-Aldrich) in PBS-0.1% Triton X-100 at room temperature for 30 minutes. Aggregated cells were removed by a cell strainer (BD Falcon). Flow cytometry was performed on an LCRII (BD Biosciences), and data analyzed using FlowJo software. Typically, 20,000 cells per sample were acquired.
S-phase quantification by bromo-2′- deoxyuridine (BrDU) incorporation
A172 and LN215 cells were plated on coverslips and transfected with 50 nM anti-miR-10b or control oligonucleotides. Cells were pulse-labeled with 10 μM BrdU 30 hours after transfection for 2 hours. Immediately after the labeling, the cells were washed, fixed, and stained for BrdU using a BrdU labeling and detection kit (Roche), according to the manufacturer’s instructions.
4′,6′-diamino-2-phenylindole (DAPI) staining was used to determine the total number of cells. The images were taken with a Zeiss LSM710 confocal microscope on low magnification (10X). The average percentage of BrdU positive cells was quantified in four different microscope fields using ImageJ software.
Western blot analysis
Western blot analysis was performed by standard procedure (see Supplementary Methods). The following primary antibodies were used: anti-p21, 2947 (12D1), anti-E2F1 3742, anti-Rb1, 9313, anti-Cyclin A2, 4656, anti-Cyclin E2, 4132 (Cell Signaling), anti-E2F2 sc-633 (C-20), anti-E2F3 sc-878 (C-18), anti-LSH sc-28202 (H-240) (Santa Cruz Biotechnology), anti-KI67 ab16667, anti-beta-Actin ab3280 (Abcam), anti-alpha-Tubulin (Sigma, T9026, DM1A).
Analysis of gene expression by quantitative real time reverse transcriptase-polymerase chain reaction (qRT-PCR)
For gene expression analysis, total RNA was isolated from cells or tissues using commercial reagents (Trizol and MirVana, Invitrogen). For primary transcripts and mRNA expression analysis, 5 μg of total RNA was subjected to DNAse I digestion and purification using a commercial RNA purification kit (Zymo Research). Aliquots of RNA (1 μg) were used in 20 μl of reverse transcription (RT) reaction using a cDNA synthesis kit with random hexamers primers (SuperScript VILO, Invitrogen). The cDNA was diluted 40 times, and 4 μl was used in 20 μl of qPCR reaction using Real-Time PCR (ViiA™ 7 with SYBR Green Master Mix, Applied Biosystems), with 0.5 pmol/μl primers. Sequences of pre-mRNA, mRNA and pri-miRNA primers used are listed in the Supplementary Table 1.
Analysis of genes transcription by 5-ethynyl uridine pulse-labeling
The cells were transfected with the miR-10b inhibitor or control oligonucleotide, and pulse-labeled 18 hours later with 0.5 mM 5-ethynyl uridine for 30 minutes. For the analysis of transcriptional activity, a nascent RNA capture kit (Click-iT, Invitrogen) was used according to the manufacturer’s instructions.
Whole genome expression profiling by microarray
using a commercial array (U133, Affymetrix). Data processing and sample comparisons were performed using an open source library for statistical analysis (Bio-Conductor library for R environment). The multiarray average expression measure from the software supplied by the manufacturer of the array was applied to calculate the average value of signal. Following multiarray average background correction, array values were subjected to quantile normalization assuming identical signal distributions in each of the arrays. Statistically significant differences between probe sets were evaluated using Student’s t test ( p < 0.05).
Chromatin immuno-precipitation, Ago-CLIP and co-immuno-precipitation
Immuno-precipitation was conducted for proteins, RNA and DNA interaction analysis simultaneously according to the standard procedure (see detailed description in Supplementary Methods). Briefly, the cells were transfected with miR-10b inhibitor or control oligonucleotide. 24 hours later, the cells were washed, cross-linked with 0.4% formaldehyde, and lysed in RIPA buffer by sonication.
The following antibodies (4 ug) were used for immuno-precipitation: E2F1 (Upstate, KH20 and KH95), Ago2 (Wako Biologicals, 4G8), or non-specific mouse IgG control antibodies (Upstate). Immuno-precipitation was performed with 50 μl of antibody-coated Protein G Dynabeads (Invitrogen) in 1 ml of cell lysates containing 1 mg total protein, in the presence of protease and RNAse inhibitors, at 4°C overnight. After immuno-precipitation, the beads were washed, cross-linking was reversed and DNA, RNA and proteins isolated.
The relative binding of E2F1 to the promoters was calculated as Locus Immunoprecipitation Percentage (LIP) using the following formula: LIP (%) = (2(Ct Input – Ct pull down)
– 2(Ct Input – Ct IgG)) * 100%.
Sequences of CHIP primers are listed in the Supplementary Table 2.
ACkNOWLEDGMENTS
We thank Regulus Therapeutics, Inc. for providing us with specific microRNA inhibitors. We also thank the members of Krichevsky laboratory and Regulus Therapeutics for helpful discussions.
FUNDING SUPPORT
This work was supported by NIH/NCI grant RO1CA138734, Sontag Foundation Distinguished Scientist Award, grants from National Brain Tumor Society (to AMK), and Brain Science Foundation (to AMK, NMT, and EJU).
CONFLICTS OF INTEREST
Authors have no potential conflicts of interest to disclose.
REFERENCES
1. Sasayama T, Nishihara M, Kondoh T, Hosoda K, Kohmura E. MicroRNA-10b is overexpressed in malignant glioma and associated with tumor invasive factors, uPAR and RhoC. International journal of cancer Journal interna-tional du cancer. 2009; 125:1407–1413.
2. Gabriely G, Yi M, Narayan RS, Niers JM, Wurdinger T, Imitola J, Ligon KL, Kesari S, Esau C, Stephens RM, Tannous BA, Krichevsky AM. Human glioma growth is controlled by microRNA-10b. Cancer research. 2011; 71:3563–3572.
3. Teplyuk NM, Mollenhauer B, Gabriely G, Giese A, Kim E, Smolsky M, Kim RY, Saria MG, Pastorino S, Kesari S, Krichevsky AM. MicroRNAs in cerebrospinal fluid identify glioblastoma and metastatic brain cancers and reflect disease activity. Neuro-oncology. 2012; 14:689–700. 4. Lang MF, Yang S, Zhao C, Sun G, Murai K, Wu X, Wang J,
Gao H, Brown CE, Liu X, Zhou J, Peng L, Rossi JJ, et al. Genome-wide profiling identified a set of miRNAs that are differentially expressed in glioblastoma stem cells and normal neural stem cells. PloS one. 2012; 7:e36248. 5. Lin J, Teo S, Lam DH, Jeyaseelan K, Wang S.
MicroRNA-10b pleiotropically regulates invasion, angiogenicity and apoptosis of tumor cells resembling mesenchymal subtype of glioblastoma multiforme. Cell death & disease. 2012; 3:e398.
6. Guessous F, Alvarado-Velez M, Marcinkiewicz L, Zhang Y, Kim J, Heister S, Kefas B, Godlewski J, Schiff D, Purow B, Abounader R. Oncogenic effects of miR-10b in glioblastoma stem cells. Journal of neuro-oncology. 2013; 112:153–163.
7. Gabriely G, Teplyuk NM, Krichevsky AM. Context effect: microRNA-10b in cancer cell proliferation, spread and death. Autophagy. 2011; 7:1384–1386.
8. Ma L, Teruya-Feldstein J, Weinberg RA. Tumour invasion and metastasis initiated by microRNA-10b in breast cancer. Nature. 2007; 449:682–688.
9. Harper JW, Adami GR, Wei N, Keyomarsi K, Elledge SJ. The p21 Cdk-interacting protein Cip1 is a potent inhibitor of G1 cyclin-dependent kinases. Cell. 1993; 75:805–816. 10. Delavaine L, La Thangue NB. Control of E2F activity by
p21Waf1/Cip1. Oncogene. 1999; 18:5381–5392.
11. Abbas T, Dutta A. p21 in cancer: intricate networks and multiple activities. Nature reviews Cancer. 2009; 9:400–414.
p21WAF1/Cip1 in human brain tumors. Oncogene. 1995; 11:2021–2028.
13. Korkolopoulou P, Kouzelis K, Christodoulou P, Papanikolaou A, Thomas-Tsagli E. Expression of retino-blastoma gene product and p21 (WAF1/Cip 1) protein in gliomas: correlations with proliferation markers, p53 expres-sion and survival. Acta neuropathologica. 1998; 95:617–624. 14. Skalsky RL, Cullen BR. Reduced expression of brain-enriched microRNAs in glioblastomas permits targeted regulation of a cell death gene. PloS one. 2011; 6:e24248. 15. Ofir M, Hacohen D, Ginsberg D. MiR-15 and miR-16 are
direct transcriptional targets of E2F1 that limit E2F-induced proliferation by targeting cyclin E. Molecular cancer research: MCR. 2011; 9:440–447.
16. Grimson A, Farh KK, Johnston WK, Garrett-Engele P, Lim LP, Bartel DP. MicroRNA targeting specificity in mammals: determinants beyond seed pairing. Molecular cell. 2007; 27:91–105.
17. Garcia DM, Baek D, Shin C, Bell GW, Grimson A, Bartel DP. Weak seed-pairing stability and high target-site abundance decrease the proficiency of lsy-6 and other microRNAs. Nature structural & molecular biology. 2011; 18:1139–1146.
18. Friedman RC, Farh KK, Burge CB, Bartel DP. Most mam-malian mRNAs are conserved targets of microRNAs. Genome research. 2009; 19:92–105.
19. Hafner M, Landthaler M, Burger L, Khorshid M, Hausser J, Berninger P, Rothballer A, Ascano M Jr, Jungkamp AC, Munschauer M, Ulrich A, Wardle GS, Dewell S, et al. Transcriptome-wide identification of RNA-binding protein and microRNA target sites by PAR-CLIP. Cell. 2010; 141:129–141. 20. Calin GA, Cimmino A, Fabbri M, Ferracin M, Wojcik SE,
Shimizu M, Taccioli C, Zanesi N, Garzon R, Aqeilan RI, Alder H, Volinia S, Rassenti L, et al. MiR-15a and miR-16–1 cluster functions in human leukemia. Proceedings of the National Academy of Sciences of the United States of America. 2008; 105:5166–5171.
21. Selbach M, Schwanhausser B, Thierfelder N, Fang Z, Khanin R, Rajewsky N. Widespread changes in protein syn-thesis induced by microRNAs. Nature. 2008; 455:58–63. 22. Wang K, Li P, Dong Y, Cai X, Hou D, Guo J, Yin Y,
Zhang Y, Li J, Liang H, Yu B, Chen J, Zen K, et al. A microarray-based approach identifies ADP ribosylation fac-tor-like protein 2 as a target of microRNA-16. The Journal of biological chemistry. 2011; 286:9468–9476.
23. Cimmino A, Calin GA, Fabbri M, Iorio MV, Ferracin M, Shimizu M, Wojcik SE, Aqeilan RI, Zupo S, Dono M, Rassenti L, Alder H, Volinia S, et al. 15 and miR-16 induce apoptosis by targeting BCL2. Proceedings of the National Academy of Sciences of the United States of America. 2005; 102:13944–13949.
24. Aqeilan RI, Calin GA, Croce CM. miR-15a and miR-16–1 in cancer: discovery, function and future perspectives. Cell death and differentiation. 2010; 17:215–220.
25. Malzkorn B, Wolter M, Liesenberg F, Grzendowski M, Stuhler K, Meyer HE, Reifenberger G. Identification and func-tional characterization of microRNAs involved in the malignant progression of gliomas. Brain pathology. 2010; 20:539–550. 26. Rao SA, Santosh V, Somasundaram K. Genome-wide
expression profiling identifies deregulated miRNAs in malignant astrocytoma. Modern pathology: an official journal of the United States and Canadian Academy of Pathology, Inc. 2010; 23:1404–1417.
27. Janssen HL, Reesink HW, Lawitz EJ, Zeuzem S, Rodriguez-Torres M, Patel K, van der Meer AJ, Patick AK, Chen A, Zhou Y, Persson R, King BD, Kauppinen S, et al. Treatment of HCV infection by targeting microRNA. The New England journal of medicine. 2013; 368:1685–1694. 28. Ling H, Fabbri M, Calin GA. MicroRNAs and other
non-coding RNAs as targets for anticancer drug development. Nature reviews Drug discovery. 2013; 12:847–865. 29. Ma L, Reinhardt F, Pan E, Soutschek J, Bhat B,
Marcusson EG, Teruya-Feldstein J, Bell GW, Weinberg RA. Therapeutic silencing of miR-10b inhib-its metastasis in a mouse mammary tumor model. Nat Biotechnol. 2010; 28:341–347.
30. Dong CG, Wu WK, Feng SY, Wang XJ, Shao JF, Qiao J. Co-inhibition of microRNA-10b and microRNA-21 exerts synergistic inhibition on the proliferation and invasion of human glioma cells. International journal of oncology. 2012; 41:1005–1012.
31. Liu Y, Li M, Zhang G, Pang Z. MicroRNA-10b overexpression promotes non-small cell lung cancer cell proliferation and invasion. European journal of medical research. 2013; 18:41.
32. Nakayama I, Shibazaki M, Yashima-Abo A, Miura F, Sugiyama T, Masuda T, Maesawa C. Loss of HOXD10 expression induced by upregulation of miR-10b accelerates the migration and invasion activities of ovarian cancer cells. International journal of oncology. 2013; 43:63–71. 33. Nakata K, Ohuchida K, Mizumoto K, Kayashima T,
Ikenaga N, Sakai H, Lin C, Fujita H, Otsuka T, Aishima S, Nagai E, Oda Y, Tanaka M. MicroRNA-10b is overexpressed in pancreatic cancer, promotes its invasive-ness, and correlates with a poor prognosis. Surgery. 2011; 150:916–922.
34. Ouyang H, Gore J, Deitz S, Korc M. microRNA-10b enhances pancreatic cancer cell invasion by suppress-ing TIP30 expression and promotsuppress-ing EGF and TGF-beta actions. Oncogene. 2014; 33:4664–4674.
35. Li QJ, Zhou L, Yang F, Wang GX, Zheng H, Wang DS, He Y, Dou KF. MicroRNA-10b promotes migration and invasion through CADM1 in human hepatocellular carci-noma cells. Tumour biology: the journal of the International Society for Oncodevelopmental Biology and Medicine. 2012; 33:1455–1465.
cell transformation by regulating miR-603 and miR-10b expression. Molecular oncology. 2013; 7:531–542. 37. Wang YY, Ye ZY, Zhao ZS, Li L, Wang YX, Tao HQ,
Wang HJ, He XJ. Clinicopathologic significance of miR-10b expression in gastric carcinoma. Human pathology. 2013; 44:1278–1285.
38. Nishida N, Yamashita S, Mimori K, Sudo T, Tanaka F, Shibata K, Yamamoto H, Ishii H, Doki Y, Mori M. MicroRNA-10b is a prognostic indicator in colorectal can-cer and confers resistance to the chemotherapeutic agent 5-fluorouracil in colorectal cancer cells. Annals of surgical oncology. 2012; 19:3065–3071.
39. Sun XJ, Liu H, Zhang P, Zhang XD, Jiang ZW, Jiang CC. miR-10b promotes migration and invasion in nasopharyn-geal carcinoma cells. Asian Pacific journal of cancer pre-vention: APJCP. 2013; 14:5533–5537.
40. Cancer Genome Atlas Research N: Comprehensive genomic characterization defines human glioblastoma genes and core pathways. Nature. 2008; 455:1061–1068.
41. Inwald EC, Klinkhammer-Schalke M, Hofstadter F, Zeman F, Koller M, Gerstenhauer M, Ortmann O. Ki-67 is a prognostic parameter in breast cancer patients: results of a large population-based cohort of a cancer registry. Breast cancer research and treatment. 2013; 139:539–552. 42. McCall CM, Shi C, Cornish TC, Klimstra DS, Tang LH,
Basturk O, Mun LJ, Ellison TA, Wolfgang CL, Choti MA, Schulick RD, Edil BH, Hruban RH. Grading of well- differentiated pancreatic neuroendocrine tumors is improved by the inclusion of both Ki67 proliferative index and mitotic rate. The American journal of surgical pathol-ogy. 2013; 37:1671–1677.
43. Jin Q, Zhang W, Qiu XG, Yan W, You G, Liu YW, Jiang T, Wang L. Gene expression profiling reveals Ki-67 associated proliferation signature in human glioblastoma. Chinese medical journal. 2011; 124:2584–2588.
44. Kayaselcuk F, Zorludemir S, Gumurduhu D, Zeren H, Erman T. PCNA and Ki-67 in central nervous system tumors: correlation with the histological type and grade. Journal of neuro-oncology. 2002; 57:115–121.
45. Sun LQ, Lee DW, Zhang Q, Xiao W, Raabe EH, Meeker A, Miao D, Huso DL, Arceci RJ. Growth retarda-tion and premature aging phenotypes in mice with disrup-tion of the SNF2-like gene, PASG. Genes & development. 2004; 18:1035–1046.
46. Crea F, Hurt EM, Farrar WL. Clinical significance of Polycomb gene expression in brain tumors. Molecular can-cer. 2010; 9:265.
47. Suva ML, Riggi N, Janiszewska M, Radovanovic I, Provero P, Stehle JC, Baumer K, Le Bitoux MA, Marino D, Cironi L, Marquez VE, Clément V, Stamenkovic I. EZH2 is essential for glioblastoma cancer stem cell maintenance. Cancer research. 2009; 69:9211–9218.
48. Kim E, Kim M, Woo DH, Shin Y, Shin J, Chang N, Baumer K, Le Bitoux MA, Marino D, Cironi L, Marquez VE, Clément V, Stamenkovic I, et al. Phosphorylation of EZH2 activates STAT3 signaling via STAT3 methylation and promotes tumorigenicity of glio-blastoma stem-like cells. Cancer cell. 2013; 23:839–852. 49. Lee J, Son MJ, Woolard K, Donin NM, Li A, Cheng CH,
Kotliarova S, Kotliarov Y, Walling J, Ahn S, Kim M, Totonchy M, Cusack T, et al. Epigenetic-mediated dysfunc-tion of the bone morphogenetic protein pathway inhibits differentiation of glioblastoma-initiating cells. Cancer cell. 2008; 13:69–80.
50. Woods K, Thomson JM, Hammond SM. Direct regula-tion of an oncogenic micro-RNA cluster by E2F transcrip-tion factors. The Journal of biological chemistry. 2007; 282:2130–2134.
51. Petrocca F, Visone R, Onelli MR, Shah MH, Nicoloso MS, de Martino I, Iliopoulos D, Pilozzi E, Liu CG, Negrini M, Cavazzini L, Volinia S, Alder H, et al. E2F1-regulated microRNAs impair TGFbeta-dependent cell-cycle arrest and apoptosis in gastric cancer. Cancer cell. 2008; 13:272–286.
52. Bonci D, Coppola V, Musumeci M, Addario A, Giuffrida R, Memeo L, D’Urso L, Pagliuca A, Biffoni M, Labbaye C, Bartucci M, Muto G, Peschle C, et al. The miR-15a-miR-16–1 cluster controls prostate cancer by targeting multiple oncogenic activities. Nature medicine. 2008; 14:1271–1277.
53. Bottoni A, Piccin D, Tagliati F, Luchin A, Zatelli MC, degli Uberti EC. miR-15a and miR-16–1 down-regulation in pituitary adenomas. Journal of cellular physiology. 2005; 204:280–285.
54. Gu Z, Inomata K, Ishizawa K, Horii A. The FBXW7 beta-form is suppressed in human glioma cells. Biochemical and biophysical research communications. 2007; 354: 992–998.
55. Hagedorn M, Delugin M, Abraldes I, Allain N, Belaud-Rotureau MA, Turmo M, Prigent C, Loiseau H, Bikfalvi A, Javerzat S. FBXW7/hCDC4 controls glioma cell prolifera-tion in vitro and is a prognostic marker for survival in glio-blastoma patients. Cell division. 2007; 2:9.
56. Nourry C, Maksumova L, Pang M, Liu X, Wang T. Direct interaction between Smad3, APC10, CDH1 and HEF1 in pro-teasomal degradation of HEF1. BMC cell biology. 2004; 5:20. 57. van Leuken R, Clijsters L, Wolthuis R. To cell cycle,
swing the APC/C. Biochimica et biophysica acta. 2008; 1786:49–59.