DETECTION OF SPUTUM SMEAR CELL BASED ON IMAGE
PROCESSING ANALYSIS
F. I. Azman1, K. H. Ghazali1, Z. Mohamed2 and R. Hamid
1Vision and Intelligent System Research Lab, Universiti Malaysia Pahang, Malaysia 2UniversitiSains Malaysia, KubangKerian, Kelantan, Malaysia
E-Mail: [email protected]
ABSTRACT
Sputum is a liquid substance or mucus produced in the lungs and in the airways leading to the lungs. Sputum can be categorized in a type of bloody that often found in tuberculosis (hemoptysis), rusty colored where it can be found in pneumonia, purulent, foamy white and frothy pink. A patient suspected having respiratory infection could be examined by sputum diagnosis. Pulmonary infection is the most cases for the respiratory infection and it can cause of morbidity and mortality. Sputum sample that contain of pus cells, squamous cells, gram-positive and gram-negative organisms are usually examines by microbiology technologist using visualize inspection through microscope image. It is less practical to examine the huge sample of sputum by manually visualizing image under the microscope. Hence, it is crucial to introduce an automatic system using image processing technique where it can overcome the inefficient practice of examine the sputum sample. In this paper we proposed an image processing technique to detect the types of cells in sputum smear. The image processing methods used to analyze the cells are color, morphology, image arithmetic operation, K-Mean clustering and thresholding technique. The sputum image has been tested for the cell detection where we obtained more than 95% detection of squamous cell.
Keywords: sputum, color, morphology, K-Mean clustering.
INTRODUCTION
Sputum is usually used for microbiological examinations of respiratory infections. One of the respiratory infections is pulmonary infection and it becomes the most common causes of morbidity and mortality. It is important to have a good quality of sputumso that the diseases such as Moraxella catarrhalis, Mycobacterium tuberculosis, streptococcus pneumonia and Haemophilus influenzacan be detected. Good quality sputum is obtained when it is cough up from the lower respiratory tract (LRT)(Miriam et al. 1998). In sputum sample, it contains pus cells (neutrophils), squamous epithelial cells (SEC), gram-positive and gram-negative organisms. Technologist in microbiology lab will examine the characteristics of cell based on color, shape, edge and size. Figure-1 shown the sputum samples that consists of PUS Cell, SEC, gram-positive and gram negative under the 10x magnificent of microscope. Meanwhile in Figure-2 and 3 shown the individual cell of SEC and Pus Cell, gram positive and gram negative. All types of sputus have its own criteria such as color, shape, size as well as edge.
Figure-1. Sputum image under 10x magnification power a) Squamous epithelial cells b) Pus cells c) Bacteria
(gram-positive and gram-negative organisms).
Figure-3.Squamous epithelial cell image under 100x magnification power.
Manually examine the sputum cell by using microscope image is known to be very tedious. The lab technologist need to observe and finding the SEC and Puss Cell carefully and do the counting of the cell. This procedure is not practical whenever huge data need to be examined by lab technologist. Since human might have eye drowsiness and fatigue while doing the examination, it appears as disadvantages in terms of time consuming and human being factors. Thus, a detection and summation system based on image processing needs to be developed to improve efficiency of detection. So, it can speed up and smooth the process of cell examination. In this paper, we focus our study to analyze sputum cell type SEC and Pus Cell. Meanwhile, the gram-positive and gram-negative have been studied by Rosyati et al. (Rosyati Hamid, 2013).
RECENT WORKS
Examination of sputum culture is a routine procedure for evaluating patients with acute pneumonia. Aim of the sputum culture is to detect diseases relates to the lung. Culturing process requires high cost and takes time to be performed. Morris et al. have calculated the cost and time saving by analysing seven tests and procedure that when eliminated or controlled will results in reductions in reagent cost and time consuming. In his study (Arthur J. Morris, 1996), over one year period, 5181 test and 5218 broth cultures could have been eliminated as it will saving almost $28,000 and time saving exceeded 1000 hours. Rejection criteria which have been made to the seven tests prevented approximately $200,000 in patient charges. Therefore it is important to apply a rejection criteria or quality testing before undergo culturing process. In previous studies, there are six different criteria for judging the acceptability of sputum specimens. Bartlett refuse to culture the sputum sample if the specimen showing evidence of excessive oropharyngeal contamination. He proposed a grading scheme for quality of sputum based on the relative number of squamous epithelial cells, inflammatory cells, and mucus seen in gram-stained smears (Bartlett, 1974).
Murray and Washington rejected all specimens with more than 10 squamous epithelial cells (SEC) per average low-power field (LPF) and Geckleret. al rejected specimens with more than 25 SEC which are simpler scheme compared to Bartlett’s (Geckler, 1977, Murray, 1975). However Van Scoy re-examined their data and concluded that specimen with more than 25 white blood cells (WBC) per LPF should be accepted (Van Scoy, 1977). Based on Barry, his scheme is quite similar with Bartlett’s which evaluates the ratio as for Barry it evaluates the ratio between white blood cells and squamous epithelial cells and minimizes the effect of variations (Barry, 1978). Heinemen and Radano rejected specimens with more than 1 epithelial cell for every 10 white blood cells in the average LPF which described a similar scheme for screening sputum specimens (Heinemen, 1977).
Christian Donner et. al investigated how the choice of color space affect the sputum cell segmentation. Aim of the segmentation is to determine whether or not a pixel in the sputum image belongs to the sputum cell using the pixel colorinformation. The staining of Papanicolaou will results a dark blue nucleus and clear blue of cytoplasm for debris cells. As for sputum cell, the nucleus will be dark red and clear red for cytoplasm. Therefore, it is possible to segment the sputum cell from background using color attributes. In their study, the histograms were computed for different color spaces such as RGB, YCbCr, HSV and L*a*b. They conducted a set of experiments to analyse the effect of color representation. By using Rule-base algorithm, HSV shows the best performance followed by RGB while the performance of YCbCramd L*a*b degrades as the resolution drops (Christian Donner, 2012). Fatma, Naoufel and Hussain, they focused on extraction and detection of sputum cells based on thresholding classifier. They used a database of 100 sputum color images to test the thresholding classifier by comparing with ground truth data. In order to test their experiment, they computed a histogram for different color space such as RGB, YCbCr, HSV, L*a*b and XYZ in order to find the best color space with low false detection rate. In their result after undergo histogram normalization, sputum pixels have much larger variance in the RGB space than the non-sputum pixels (Fatma Taher, 2012b).
In other related studies, Makkapati has proposed a method of detecting a malaria parasite in stained blood smears which is critical for treatment of the diseases using image processing. A scheme based on HSV color space that segments red blood cells and parasites by detecting dominant hue range and by calculating optimal saturation thresholds was presented in his work (Vishnu V. Makkapati 2009).
and detection. This approach will be improved the technique that being used by previous studies.
IMAGE PROCESSING TECHNIQUE
General approach of the image sputum cell analysis is shown in Figure-4. The sputum data has been acquired in collaboration of Hospital UniversitiSains Malaysia KubangKerian (HUSM). The analyses of images have gone through the pre-processing, segmentation and finally the detection of cell.
Figure-4. General steps of sputum cell image analysis.
Data acquisition
The data collection has been performed in the Microbiology Lab, HUSM KubangKerian assisted by HUSM’s lab technologist. The sputum cell data have been collected using digital microscope that is attached to a digital camera, connected to a PC and runs with dedicated software for image collection. The specification of data collection apparatus is as follow:
Camera: Olympus XC50, U-CMAD3, Japan
Microscope: Model-BX41TF_CCD, Olympus, and serial number: BG22578
Software: AnalySISdocu, copyright 1986-2007, Olympus Soft Imaging Solutions GmbH.
Pre-processing
In the pre-processing stage, we introduced several methods in order to prepare a good image for the segmentation stage. Four experimental methods have been proposed to find the most suitable technique for noise removal. The following four different methods have been tested to analyze sputum image for the cell detection.
i. Preprocessing Method 1: Apply RGB color space followed by contrast enhancement
ii. Preprocessing Method 2: Analayze H channel of HSV and continue with contrast enhancement iii. Preprocessing Method 3: Analyze with S channel of
HSV and continue with contrast enhancement iv. Preprocessing Method 4: Analyze with V of HSV
color space and continue with contrast enhancement
Segmentation
As we choose the best pre processing technique of sputum cell, our work then continue by applying segmentation technique to find the suitable region of interest. In this stage, segmentation process is emphasis on getting region of interest of SEC by removing background and noises. Segmentation of SEC is important to ensure there is only SEC left in the image and no noise that
disturbing the interest cell. All the unwanted objects need to be removed so that the image contains only appropriate information of SEC pixel values. Figure-5 shows the block diagram of image segmentation process. Output from pre processing stage has been performed noise elimination followed by bores removal. Finally we applied object multiplication to get the segmented object of SEC. The same step applied to the Puss Cell.
Figure-5. Block diagram of segmentation stage.
Detection
Detection process is shown in Figure-6. In the detection stage, K-means clustering and color thresholding have been used to identify SEC Cell. The result from segmentation process has been continued by applying K-mean clustering then followed by color thresholding. We set a range of thresholding values and finally the numbers of sputum cell were detected. Figure-7 is one of the examples of SEC after performing K-mean and color thresholding steps.
Figure-6. Detection stage.
Figure-7. Nucleus and cytoplasm region of SEC.
RESULT AND DISCUSSION
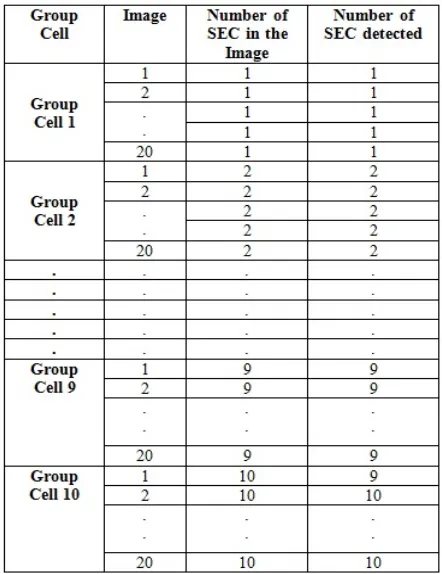
200 sputum images. The performance was evaluated based on detection and counting accuracy. Input data of 200 images were clustered to 10 groups, where each group contains 20 images. For example, in the group Cell 3, each image contains of three SEC cell. This clustered group is important to test the accuracy of the detection technique. Figure 8shows samples of data in each cell groups.
Figure-8.Group of cell for evaluating detection performance.
[image:4.612.76.293.194.310.2]Table-1 shows the sample of result for each group of cell. In each group of cell, the detection will increase according to the cell group. In example, the detection in cell group 4, it is supposed 4 cells will be detected. The detection of cells will increase as the number of cell group increase. Table-1 shows the example of result for overall group of cell.
Table-1. Result of SEC cell detection and summation.
The experiment result is shown in Figure-9. The number of images correctly detected represents images that detect the number of SEC correctly in each image.
Figure-9. Number of image SEC cell correctly detected.
[image:4.612.74.295.452.739.2]Figure-9 summarizes the number of image successfully detected. The graph shows that the images in-group Cell 1 to Cell 6 has been correctly detected the 20 cell images. However with the increasing number of cell in the images, the detection and counting result become less accurate. It was shown in cell group 7 to 10. The detection performance is measured by percentage of number of images successfully detected. From the results we can see that the system reliability and accuracy is 96.5%. Table-2 shows summary of the detection and summation performance.
Table-2. Summary of detection and summation performance.
CONCLUSIONS
[image:4.612.316.538.461.566.2]REFERENCES
[1] Miriam B. Buenviaje and M. D. 1989. Quantitative Sputum Culture and Gram Stain: Pulmonary Infection vs. Colonization. Vol. 18, pp. 28-35.
[2] Rosyati Hamid, N. a. H., Zeehaida Mohamed, Nurul Wahidah Arshad, FatadilaNaim and Mohd Falfazli Jusof. 2013. Feature Extraction of Pus Cells Detection and Counting in Sputum Slide Images. Electronics, Communications and Photonics Conference (SIECPC), Saudi International, 27-30 April 2013. Riyadh. IEEE, pp. 1 - 6.
[3] Arthur J. Morris, L. K. S., Stanley Mirret and L. Barth Reller 1996. Cost and Time Savings following Introduction of Rejection Criteria for Clinical Specimens. Journal of clinical microbiology, Vol. 34, pp. 355-357.
[4] Bartlett R. C. 1974. Medical microbiology: quality, cost and clinical relevance. In: SONS, J. W. (ed.). New York.
[5] Murray P. R. and J.A. Washington H. 1975. Microscopic and bacteriologic analysis of expectorated sputum. Mayo Clin. Proc. Vol. 50, pp. 339-344.
[6] Geckler R. W., D.H. Gremillion C. K. Mcallister and E. Ellenbogen 1977. Microscopic and bacteriological comparisons of paired sputa and transtracheal aspirates. Journal of clinical microbiology, Vol. 6, pp. 396-399.
[7] Van Scoy R. E. 1977. Bacterial sputum cultures, a clinician's viewpoint. mayo Clinical Process, Vol. 52, pp. 39-41.
[8] Barry A. L. 1978. Clinical specimens for microbilogic examination. In: HOEPRICH, I. P. D. (ed.) Infectious diseases. 2nd edition ed. New York: Harper & Rowe.
[9] Heinemen H. S., J. K. Chawla and W. M. Lofton 1977. Misinformation from sputum cultures without microscopic examination. Journal of clinical microbiology, Vol. 6, pp. 518-527.
[10] Christian Donner, N. W., FatmaTaher and Hussain Al-Ahmad. Cell Extraction from Sputum Images for Early Lung Cancer Detection. 2012. IEEE.
[11] FatmaTaher N. W. a. H. a.-A. 2012b. A Thresholding Approach for Detection of Sputum Cell for Lung Cancer Early Diagnosis. Image Processing (IPR 2012).