www.hydrol-earth-syst-sci.net/13/567/2009/ © Author(s) 2009. This work is distributed under the Creative Commons Attribution 3.0 License.
Earth System
Sciences
Improved estimation of flood parameters by combining space based
SAR data with very high resolution digital elevation data
H. Zwenzner and S. Voigt
German Remote Sensing Data Center, German Aerospace Center, Oberpfaffenhofen, Germany Received: 12 September 2008 – Published in Hydrol. Earth Syst. Sci. Discuss.: 29 October 2008 Revised: 20 April 2009 – Accepted: 4 May 2009 – Published: 11 May 2009
Abstract. Severe flood events turned out to be the most dev-astating catastrophes for Europe’s population, economy and environment during the past decades. The total loss caused by the August 2002 flood is estimated to be 10 billion Eu-ros for Germany alone. Due to their capability to present a synoptic view of the spatial extent of floods, remote sensing technology, and especially synthetic aperture radar (SAR) systems, have been successfully applied for flood mapping and monitoring applications. However, the quality and accu-racy of the flood masks and derived flood parameters always depends on the scale and the geometric precision of the orig-inal data as well as on the classification accuracy of the de-rived data products. The incorporation of auxiliary informa-tion such as elevainforma-tion data can help to improve the plausibil-ity and reliabilplausibil-ity of the derived flood masks as well as higher level products. This paper presents methods to improve the matching of flood masks with very high resolution digital el-evation models as derived from LiDAR measurements for ex-ample. In the following, a cross section approach is presented that allows the dynamic fitting of the position of flood mask profiles according to the underlying terrain information from the DEM. This approach is tested in two study areas, using different input data sets. The first test area is part of the Elbe River (Germany) where flood masks derived from Radarsat-1 and IKONOS during the 2002 flood are used in combination with a LiDAR DEM of 1 m spatial resolution. The other test data set is located on the River Severn (UK) and flood masks derived from the TerraSAR-X satellite and aerial photos ac-quired during the 2007 flood are used in combination with a LiDAR DEM of 2 m pixel spacing. By means of these two examples the performance of the matching technique and the
Correspondence to: H. Zwenzner ([email protected])
scaling effects are analysed and discussed. Furthermore, the systematic flood mapping capability of the different imaging systems are examined. It could be shown that the combina-tion of high resolucombina-tion SAR data and LiDAR DEM allows the derivation of higher level flood parameters such as flood depth estimates, as presented for the Severn area. Finally, the potential and the constraints of the approach are evalu-ated and discussed.
1 Introduction
when processing the respective flood masks in GIS opera-tions or when generating flood maps. This is the case when flood masks are combined with digital elevation data to de-rive spatially distributed estimates of inundation depths or to exactly locate the land-water boundary in a digital ter-rain model (Sanders, 2007; Mason et al., 2007; Ling et al., 2008). In such cases even small geometric inaccuracies dur-ing the geocoddur-ing process or slight classification errors (local or general in character) can significantly reduce the quality of higher level products such as maps of inundation depths. An-other approach for the estimation of uncertainty of observed inundation extent is the implementation of a fuzzy evaluation methodology (Pappenberger et al., 2007).
In order to enhance the geometric and thematic reliabil-ity of flood masks derived by remote sensing techniques, we here present methods to improve the matching of flood masks with very high resolution digital elevation models as derived from LiDAR measurements (Fowler, 2002). By ap-plying these matching techniques, the hydrological plausibil-ity and reliabilplausibil-ity of flood masks is improved, so that further processing in hydrological or hydraulic models can be per-formed with sufficient accuracy. This is of particular rele-vance whenever applying remote sensing techniques to op-erational flood monitoring or for rapid mapping purposes, i.e. when the processing and verification of the results have to be achieved under time pressure. Only a few authors have presented techniques to establish such links of remotely sensed flood masks with high resolution digital elevation data sets. Schumann et al. (2006) present a georeferencing ad-justment method which shifts the SAR image until an ac-ceptable agreement between left and right flood extent water level is found. Matgen et al. (2007) tested and compared methods for flood depth interpolation based on flood masks derived from SAR imagery. Bates et al. (2006) used a 2-D hydraulic model approach to cross-compare the results with SAR derived flood extent maps, while Meinel et al. (2003) presented concepts for computing water levels using eleva-tion readings from intersecting IKONOS flood masks with LiDAR DEMs and terrestrial land/water line observations. Schumann et al. (2007) used different regression models to fit the left and right bank elevation readings from SAR based water mask/DEM intersections. All authors described the difficulty of precisely combining water masks and DEMs, as geometric errors and thematic classification errors in the re-mote sensing data remain high. The methods presented in this paper seek to reduce such residual errors through local matching operations.
2 Methodological approach
The technique presented here is based on the concept of lo-cally fitting a carefully processed flood mask into high res-olution digital elevation data sets. Whereas Schumann et al. (2006) for example presented a method which shifts the
entire flood mask in order to achieve coherence with the un-derlying elevation data, the proposed method is based on a sequence of densely spaced cross sections which are shifted and adjusted individually. The assumption is that small-scale geometric or thematic classification errors can be compen-sated by the fitting process and the hydraulic accuracy can be improved through these fitting operations. However, the matching process can only be carried out within certain lim-its, as the approach is neither meant to inter- or extrapolate flood masks nor to substitute accurate hydraulic approaches. Two major assumptions for the fitting process and the deriva-tion of flood depth are, that each cross secderiva-tion has a horizon-tal water level and that only minor thematic errors (in the order of some pixels) exist in the satellite-derived flood pro-files. The character and accuracy of the digital elevation data is of key relevance to this approach, as remaining artefacts like vegetation, removable objects or interpolation errors in the DEM have an influence on the matching result (Fowler, 2002).
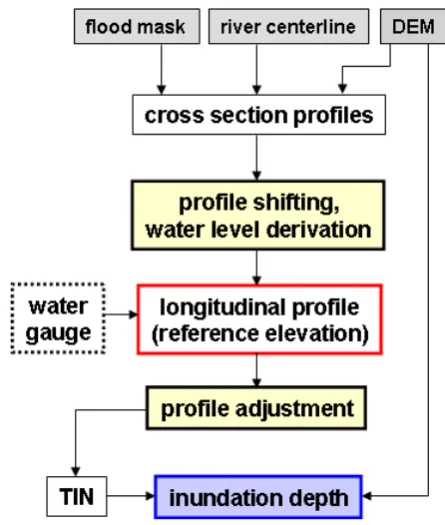
Figure 1 illustrates the sequence of the most important pro-cessing steps of the proposed method. Initially, the terrain profiles are generated perpendicularly to the centreline of the river. Ideally, this line should be the centreline of the area of the flood water body given by the flood mask, rather than the centreline of the normal water body. Especially for large flood situations, when the water flow takes a different path than normal river flow, the centreline should represent the ef-fective flood situation. In order to avoid too much overlap between the cross sections, the sinuosity of centreline should be minimised. The distance between cross sections as well as the sampling distance within profiles depends on the geo-metric resolution of the remote sensing data from which the water mask was derived.
this shift can only be applied within defined limits and we propose a threshold of a maximal shift in the order of 5–10 pixels depending on the general processing and classification accuracy of the flood mask. A larger shift would bias the de-termination of the water level. At this point it should be noted that the SAR image should be geo-referenced as accurately as possible beforehand, in order to minimise the geometric error. Finally, the elevation of the flood water level is calcu-lated from the elevation of the left and right border for each individual flood profile.
[image:3.595.313.536.63.326.2]The next processing step is the generation of the longitu-dinal flood level profile, illustrated by the red-framed box in Fig. 1, which consists of the sequence of the water level es-timates of each individual cross section along the river flow line. The longitudinal profile is a key instrument of the pro-posed methodology since the derived water level estimates of the individual profiles can be visualised and compared against water gauge data and other reference data if avail-able. This information can be used as an indicator of how well the water levels have been derived and where problems such as classification errors occurred. During this step it has to be evaluated if the quality of the derived water level es-timates allows the reliable mapping of inundation depth or not. Examples are given in chapter 3 and 4. On the basis of the longitudinal profile the water level estimates can be cor-rected in such a way that obvious errors due to misclassifica-tions are reduced. Hence, a moving average is applied to the longitudinal sequence of the water level estimates in order to obtain a naturally smooth water surface which serves as reference water level for the flood depth delineation. Theo-retically, this step allows for the compensation of small-scale thematic and/or geometric errors in such a way that variations in the water level estimates of subsequent cross sections are averaged and outliers are removed. The limitation of this ap-proach is that classification errors that range over more than a few cross sections can not be compensated. This occurs for example when the flood extent of a relatively large area of the river section is underestimated due to flooded vegetation. In this case the water level would be underestimated as well, and the respective flood profiles would have to be excluded or the errors be reduced by further pre-processing. This high-lights the importance of the visual interpretation and cross-checking of the longitudinal profile.
In the next processing step named “profile adjustment” in Fig. 1 the modified water level estimates are used to adjust the horizontal extent of the cross section flood profiles. This means that each individual flood profile is trimmed or ex-tended on the basis of its reference water level from the lon-gitudinal profile and is thus fitted to the flood plain topogra-phy.
The last processing step illustrated in Fig. 1 is the deriva-tion and mapping of inundaderiva-tion depth. From the xyz-coordinates of the left and right border of the adjusted flood profiles a Triangulated Irregular Network (TIN) is created. A continuous flood water surface which represents the
rec-19 Figure 1. Flowchart showing the interconnection of the major processing steps for the mapping of inundation depth. The grey boxes depict the input datasets for the river parameterization via cross-sections, the yellow-colored boxes illustrate the processing steps for each single cross-section and the red-framed box describes the integration process of all single cross-section profiles within the longitudinal profile. If available, water gauge data should be incorporated. The terrain adjusted profile heights are transformed into a raster file via a TIN and inundation depth can be derived by subtracting the terrain elevation from the elevation of the water surface.
Fig. 1. Flowchart showing the interconnection of the major
pro-cessing steps for the mapping of inundation depth. The grey boxes depict the input datasets for the river parameterization via cross-sections, the yellow-colored boxes illustrate the processing steps for each single cross-section and the red-framed box describes the in-tegration process of all single cross-section profiles within the lon-gitudinal profile. If available, water gauge data should be incor-porated. The terrain adjusted profile heights are transformed into a raster file via a TIN and inundation depth can be derived by sub-tracting the terrain elevation from the elevation of the water surface.
tified water levels from the longitudinal profile is generated via TIN interpolation. The resulting raster layer of inunda-tion depth is then computed by subtracting the DEM from the rasterised TIN.
The profile matching algorithm is implemented in IDL (in-teractive data language). Each profile is stored in a database and all intersections, cross-checking and matching opera-tions can be computed independently. Hence, even large data sets can be handled quite easily and the precomputed profile database can be used for a wide range of flood situations.
3 Case study on River Elbe, Germany
3.1 Study area and flood situation
20 Figure 2. Radarsat-1 image showing the flood situation of the Elbe River 15 km north-west of Dresden (Germany) on 18 August 2002, one day after the flood peak. For comparison a small subset of an IKONOS false colour image is presented which was acquired three hours after the Radarsat-1 scene.
Fig. 2. Radarsat-1 image showing the flood situation of the Elbe
River 15 km north-west of Dresden (Germany) on 18 August 2002, one day after the flood peak. For comparison a small subset of an IKONOS false colour image is presented which was acquired three hours after the Radarsat-1 scene.
of 9.4 m on 17 August 2002. This flood level exceeded the previously recorded all-time flood peak of the year 1845 by 63 cm.
Figure 2 gives an overview of the study area which com-prises a section of the middle course of the Elbe River of about 15 km length. The heavily flooded city centre of Dres-den is located about 20 km upstream, southeast of the study area. The floodplain geomorphology exhibits pronounced terrain with some steep slopes adjacent to the water course. The topographic gradient of 7 m and the resulting average longitudinal slope of 0.0005 m/m for this river section pro-vokes a straight river flow.
3.2 Data sets and pre-processing
A Radarsat-1 scene showing the flood situation of the Elbe River on 18 August 2002, one day after the flood peak, was used for this study. The incidence angle was 41◦ and the polarisation of the C-Band Radarsat-1 sensor was HH. First of all, the raw satellite data were processed and geocoded us-ing one ground control point (GCP) to improve the positional accuracy. The accuracy assessment based on 8 independent GCPs gave a total RMSE of 16.59 m. The pixel spacing of the processed image was 12.5 m. A standard edge-preserving adaptive Lee-Sigma filter with a window size of 7×7 pixels was then applied on the SAR data in order to reduce speckle and to support homogeneous water classification (Sheng and Xia, 1996). A binary flood mask was derived using a pixel-based threshold classification approach (Brivio et al., 2002; Bonn and Dixon, 2005). The assumption of the threshold classification approach is that all pixels with backscatter in-tensities below a certain threshold are classified as “flooded” whereas pixels with higher backscatter values are classified as “non-flooded”. The resulting classified flood extents were
21 Figure 3. Elevation map of the Elbe River north-west of Dresden with the original flood mask derived from Radarsat-1 (light blue). The cross section flood profiles with a spacing of 100 m were horizontally shifted according to the underlying terrain data and are drawn in yellow. For comparison the flood mask derived from IKONOS is encircled by the lime-green line.
Fig. 3. Elevation map of the Elbe River north-west of Dresden with
the original flood mask derived from Radarsat-1 (light blue). The cross section flood profiles with a spacing of 100 m were horizon-tally shifted according to the underlying terrain data and are drawn in yellow. For comparison the flood mask derived from IKONOS is encircled by the lime-green line.
visually compared against official municipality flood maps derived from aerial survey, ground truth information and citi-zen interviews. The errors were evaluated qualitatively by vi-sual interpretation and fine tuning of the threshold was done at a number of selected points for which the water bound-ary could be reliably identified from the reference data. As a final step of the classification small islands and lakes were removed.
A LiDAR DEM of the Elbe flood plain with 1 m horizon-tal resolution and a vertical accuracy of 0.1 m was available for the study area. For validation and cross-comparison an optical IKONOS satellite image with four channels and 1 m resolution, acquired three hours after the Radarsat-1 scene, was used. The IKONOS scene was orthorectified and visu-ally interpreted. Because of its high spatial resolution and the good perceptibility of the flooded area, especially in the near infrared channel, a detailed flood mask could be digi-tised. This flood mask showed good agreement with the of-ficial high resolution flood maps and is thus considered to reliably reflect the real flood situation.
3.3 Case specific analysis
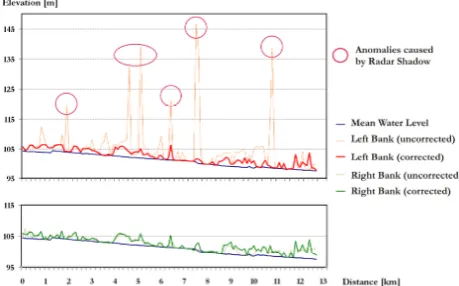
[image:4.595.310.545.63.244.2] [image:4.595.50.285.64.221.2]22 Figure 4. Longitudinal profile showing the elevation of the left and right river bank at each individual Radarsat-1 profile before and after the rectification. Large anomalies can be recognised in the uncorrected elevation readings of the left river bank caused by misclassification of water due to radar shadow. After the horizontal adjustment (shifting) of the profile, elevation readings of the left and right river bank correspond to each other.
Fig. 4. Longitudinal profile showing the elevation of the left and
right river bank at each individual Radarsat-1 profile before and after the rectification. Large anomalies can be recognised in the uncorrected elevation readings of the left river bank caused by mis-classification of water due to radar shadow. After the horizontal adjustment (shifting) of the profile, elevation readings of the left and right river bank correspond to each other.
areas on the hill slopes of the left river bank which were misclassified because of low backscatter intensities due to geometric effects such as radar shadow or stretching of the backside of the mountain. Obviously misclassified profile segments and segments not connected to the main flood sur-face were excluded from further processing. By applying the profile shifting methodology described in Sect. 2, all valid profile segments were shifted horizontally and adjusted to the flood plain topography. Figure 4 shows a comparison of the elevation of the left and right boundary of the flood profiles in flow direction, before and after the shifting was performed. Large outliers on the left bank are visible in the uncorrected flood profiles.
The same method and cross section profiles were applied on the flood mask derived from IKONOS imagery. Figure 5 presents a comparison of the water level readings derived from Radarsat-1 and IKONOS for each individual profile along the river reach.
3.4 Results
By applying the profile shifting method large outliers in the elevation of the left river bank could be eliminated (see Fig. 4) and the flood profiles from Radarsat-1 data thus ap-pear more plausible with respect to their position in the ter-rain. Figure 3 illustrates that all shifted flood profiles lie within the IKONOS flood mask. However, the results are rather disappointing with respect to the derived water lev-els depicted by the longitudinal profiles in Figs. 4 and 5. The terrain-adjusted flood profiles from Radarsat-1 indicate a large underestimation of the flood water levels when com-pared to water level estimates from IKONOS (see Fig. 5). Although also the water levels from IKONOS show a
sig-23 Figure 5. Longitudinal profile of the Elbe River reach north-west of Dresden showing the water level estimates for each individual cross-section profile for Radarsat-1 (red) and IKONOS (green) in comparison to the pre-flood average water level (blue).
Fig. 5. Longitudinal profile of the Elbe River reach north-west
of Dresden showing the water level estimates for each individual cross-section profile for Radarsat-1 (red) and IKONOS (green) in comparison to the pre-flood average water level (blue).
nificant scattering, the flood water levels derived from the Radarsat-1 profiles are much more variable. A number of flood profiles feature a water level similar to the pre-flood average water level as it is represented by the LiDAR ele-vation data. This is shown by the red data points which are located on the blue line in Fig. 5. Since flood extent and wa-ter level are closely correlated, it follows that the flood ex-tent detected by Radarsat-1 at these cross sections is largely underestimated and the profiles are too short. Thematic clas-sification errors caused by high backscatter intensities from flooded vegetation and too much distortion from the proxim-ity of the urban areas can be regarded as the main reasons for this. Also the pixel size of 12.5 m has a negative influence on the accuracy of the flood mask when compared to a high resolution DEM of 1 m pixel spacing.
A general underestimation of about 2 m compared to IKONOS such as it is shown by the regression lines in Fig. 5 leads to the conclusion that flood masks from traditionally medium resolution SAR sensors such as Radarsat-1 are not appropriate for such detailed analyses. The boundary condi-tions for the derivation of reliable flood water levels are not fulfilled and thus the following processing steps towards the generation of inundation depth are dismissed. This example shows that there is a need of much more appropriate radio-metric as well as higher spatial resolutions of SAR images such as it is provided by TerraSAR-X.
4 Application for high resolution SAR data at River Severn, UK
4.1 Study area and flood situation
[image:5.595.311.544.65.218.2] [image:5.595.52.282.66.209.2]24 Figure 6. Hydrograph of the Mythe Bridge water gauge at Tewkesbury, UK, showing the flood situation over 10 days from July 20th to July 30th, 2007. The red bars depict the time of the data acquisitions of Orthophotos and TerraSAR-X and the respective water levels are given in brackets. During the 15 hours time between the two acquisitions the water level decreased by 27 cm. The green box depicts the period in which the accuracy of the water gauge data is limited by +/- 30mm due to partial failure of the gauge and interpolation of missing values (data source: Environment Agency of England and Wales).
Fig. 6. Hydrograph of the Mythe Bridge water gauge at
Tewkes-bury, UK, showing the flood situation over 10 days from 20 July to 30 July 2007. The red bars depict the time of the data acquisitions of Orthophotos and TerraSAR-X and the respective water levels are given in brackets. During the 15 h time between the two acquisi-tions the water level decreased by 27 cm. The green box depicts the period in which the accuracy of the water gauge data is limited by +/- 30 mm due to partial failure of the gauge and interpolation of missing values (data source: Environment Agency of England and Wales).
England. The record flood level at Tewkesbury measured 5.43 m on 22 July 2007 which was 13 cm above the previous record from the year 1947. A number of water gauges in the area did not operate regularly in terms of a continuous flood monitoring. Figure 6 shows the hydrograph of the River Sev-ern at the water gauge at Mythe Bridge, Tewkesbury, which illustrates how the flood situation evolved. The flood situ-ation was stable over several days. In the beginning it was induced by surface water from heavy local precipitation that could not drain away quickly and later it was characterised by inflow originating from upstream rainfall.
The study area presented in Fig. 7 comprises a section of the River Severn of about 8 km length including the conflu-ence of the River Avon coming from northeast. The heavily flooded city of Tewkesbury is located east of the confluence and can be seen in the TerraSAR-X image as bright areas with high backscatter intensities (see Fig. 7). The Mythe Bridge water gauge is located 0.5 km north of the conflu-ence of the two rivers. The study area is part of the lower course of the River Severn, and opposed to the Elbe River, the terrain is relatively flat with a very gentle gradient in flow direction which hampers flood water to drain away quickly. 4.2 Data sets and Pre-processing
This case study is based on a TerraSAR-X StripMap scene with 3 m pixel spacing showing the flood situation on 25 July 2007. The incidence angle was 24◦and HH
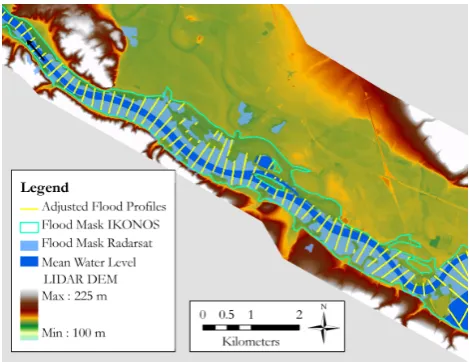
polar-25 Figure 7. TerraSAR-X image from 25 July 2007 showing the large flood event of the River Severn at Tewkesbury (UK). Cross section profiles with a distance of 50 m were created perpendicular to the flood centreline and were horizontally shifted according to the underlying high resolution elevation model. From the left and right boundary points the elevation of the water level could then be derived for each profile.
Fig. 7. TerraSAR-X image from 25 July 2007 showing the large
flood event of the River Severn at Tewkesbury (UK). Cross section profiles with a distance of 50 m were created perpendicular to the flood centreline and were horizontally shifted according to the un-derlying high resolution elevation model. From the left and right boundary points the elevation of the water level could then be de-rived for each profile.
isation was chosen. The TerraSAR-X image was delivered in the standard high precision Enhanced Ellipsoid Corrected (EEC) format. The “rapid” orbit type (GPS orbit determina-tion) was chosen which is advantageous for disaster response operations because of fast processing and data access. The pixel localisation accuracy of this orbit type is 2 m, in flat areas it is even more precise. In order to reduce speckle and obtain homogeneous water classifications as well as to re-move small islands in the data, an adaptive Lee-Sigma fil-ter with a window size of 31×31 pixels was applied to the image. In contrast to the Elbe case study and the Radarsat-1 pre-processing, a multiresolution segmentation was con-ducted on the high resolution TerraSAR-X data (Blaschke et al., 2000; Baatz and Sch¨ape, 2000).
[image:6.595.307.545.62.301.2] [image:6.595.50.285.72.239.2]26 Figure 8. Longitudinal profile of the Severn reach (exclusive of the River Avon) showing the elevation of the water level for each individual cross-section profile derived from TerraSAR-X (red) and from an Aerial Photography survey (green) one day prior to the satellite overpass in comparison to the pre-flood average water level (blue).
Fig. 8. Longitudinal profile of the Severn reach (exclusive of the
River Avon) showing the elevation of the water level for each indi-vidual cross-section profile derived from TerraSARX (red) and from an Aerial Photography survey (green) one day prior to the satellite overpass in comparison to the pre-flood average water level (blue).
4.3 Case specific analysis
Corresponding to the higher resolution of the TerraSAR-X flood mask, cross section flood profiles were generated at in-tervals of 50 m between profiles and a sampling distance of 5 m along the profiles. As illustrated in Fig. 7, the cross sec-tion profiles were arranged orthogonally to the centreline of the flooded Severn and Avon. The centreline was manually digitised from the satellite imagery. The flooded areas in the city of Tewkesbury which were not connected to the main water body were excluded from this study. It turned out that these areas could not be sufficiently represented by the pro-file method based on the centreline of the main river.
The profile shifting method described in chapter 2 was ap-plied to the flood profiles derived from the TerraSAR-X flood mask. A maximum horizontal shift of 5 pixels was allowed to achieve a horizontal water level. Subsequently, the water level of each individual cross section was derived from the elevation of the left and right border of the adjusted flood profiles. The same method was then conducted for the flood mask derived from the optical reference imagery. A com-parison of the water level altitude of both data sets and each cross section is displayed in Fig. 8.
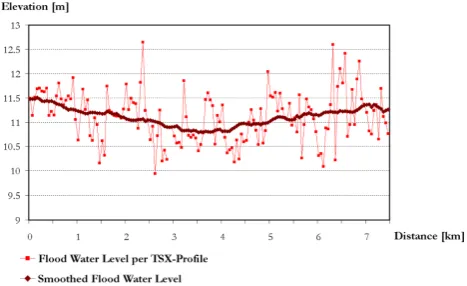
In contrast to the Elbe case study, the entire processing chain presented in chapter 2 was applied to the flood profiles derived from TerraSAR-X. Figure 9 presents the sequence of the water level elevation of each flood profile in flow direc-tion, showing a total vertical variation of about 2.7 m. The derived water level estimates were smoothed by applying a moving average filter over 31 cross sections. The smoothed water levels shown in Fig. 9 represent the longitudinal wa-ter surface of the river reach and serve as reference eleva-tion for the flood depth computaeleva-tion. By applying the file adjustment processing step, each individual flood
pro-27 Figure 9. Longitudinal Profile of the Severn reach (exclusive of the River Avon) showing the water level of the individual flood profiles derived from the TerraSAR-X flood mask. The water level estimates were smoothed by a moving average in order to diminish classification errors and possible inaccuracies in the elevation model. The smoothed line serves as reference flood level for the flood depth delineation.
Fig. 9. Longitudinal Profile of the Severn reach (exclusive of the
River Avon) showing the water level of the individual flood profiles derived from the TerraSAR-X flood mask. The water level estimates were smoothed by a moving average in order to diminish classifi-cation errors and possible inaccuracies in the elevation model. The smoothed line serves as reference flood level for the flood depth delineation.
file was trimmed or extended according to its respective ref-erence elevation from the longitudinal profile. This means that all flood profiles were fitted to the local flood plain ter-rain. The coordinates of the resulting left and right border of the matched flood profiles were then used together with the reference elevation to create a water surface TIN. A con-tinuous flood surface elevation was derived through TIN-interpolation and was exported to a raster file. In order to obtain inundation depth, the DEM was subtracted from the rasterised water surface elevation. The result is illustrated in Fig. 10.
4.4 Results
Figure 8 indicates that the general flood situation is well represented by the TerraSAR-X flood profiles. The regres-sion lines in Fig. 8 show that the water level estimates from TerraSAR-X data are on average about 80 cm lower than the water level estimates derived from aerial photography ac-quired 15 h earlier. At the Mythe Bridge water gauge (at 2.3 km on the longitudinal profile) the difference was actu-ally 62 cm. Due to the decreasing water level during the 15 h period between the acquisitions of TerraSAR-X and the aerial photos (see Fig. 6), 27 cm have to be subtracted, leaving a delta of 35 cm at Mythe Bridge. This means, that the TerraSAR-X water levels are underestimated by approx-imately 35 cm compared to water levels derived from or-thophotos. The comparison of the water level estimates de-rived from TerraSAR-X and aerial photos with water gauge data is summarised in Table 1.
[image:7.595.311.545.65.208.2] [image:7.595.51.285.67.217.2]Table 1. Comparison of water gauge data and water level estimates derived from Terra-SAR-X and aerial photography at the time of the two
data acquisitions at Mythe Bridge, Tewkesbury, UK.
Acquisition Time Aerial Photography TerraSAR-X 24/07/2007; 1:30 p.m. 25/07/2007; 6:30 a.m.
Water Gauge measurement 12.49 m 12.22 m 10.27 m
Remote Sensing estimate 11.67 m 11.05 m 10.62 m
10.35 m
28 Figure 10. Flood depth map of the River Severn near Tewkesbury derived from the rectified flood profiles of TerraSAR-X and a high resolution LiDAR elevation model. For comparison the flood extent derived from an aerial photography survey is shown by the yellow line. The urban area east of the river confluence was excluded from this study since the profile method was only applied along the river course.
Fig. 10. Flood depth map of the River Severn near Tewkesbury
derived from the rectified flood profiles of TerraSAR-X and a high resolution LiDAR elevation model. For comparison the flood extent derived from an aerial photography survey is shown by the yellow line. The urban area east of the river confluence was excluded from this study since the profile method was only applied along the river course.
for the orthophotos. The variability within the TerraSAR-X water level estimates illustrated in Fig. 9 is mainly caused by small scale geometric and classification errors due to higher backscatter from flooded vegetation, urban structures or a rough water surface. Figure 9 also shows the result of the averaging process of the flood water levels along the longitu-dinal profile in which local discontinuities in the elevation of the flood surface could be minimised.
However, the hydraulic situation shown in Fig. 9 is not as it would be usually expected. Although the reach length of 7 km in our study is very short and the topographic gra-dient in this area is too low in order to represent the natu-ral downward trend of the river, a noticeable depression of the water level can be seen in the mid-section of the
longi-tudinal profile. Classification problems around the city of Tewkesbury are most likely responsible for an underestima-tion of the flood extent and the resulting irregularities shown in Fig. 9. These classification errors in the TerraSAR-X de-rived flood mask were too large in scale to be compensated by the method applied.
As shown in Fig. 10, the created flood surface area from flood depth delineation corresponds well to the flood mask derived from aerial photography. In comparison to the original TerraSAR-X flood mask, a significant improvement could be achieved regarding its consistency with the high resolution elevation model. That means, that elevated ob-jects inside the flood mask such as bridges and buildings or higher ground could automatically be excluded by applying the method.
5 Discussion of results and conclusion
In this paper it could be demonstrated that for the given sit-uation of the Elbe case study flood extent could not be ade-quately retrieved for flood depth delineation from traditional medium resolution SAR sensors such as Radarsat-1. Pre-cise high resolution SAR-data is expected to be more suit-able for such detailed studies. Generally, wind, water tur-bulence, shallow water over agricultural fields and flooded areas covered with vegetation cause for high backscatter val-ues in SAR data and thus often lead to a misclassification and underestimation of the flood extent. X-Band sensors such as TerraSAR-X working with short wavelengths are even more sensitive to wind and roughness on water surfaces than the widely used C-Band systems (Horritt et al., 2003).
[image:8.595.48.282.203.419.2]should have a spatial sampling of 3 m minimum, with the DEM resolution being higher than the resolution of the re-mote sensing data.
It can be concluded from this study, that for high resolution SAR data in combination with very high resolution elevation data the proposed methodology allows the generation of hy-draulically improved maps of inundation depth. However, certain boundary conditions have to be taken into account when applying the profile method. For the adequate estima-tion of the water level, it is crucial to determine the accurate position of the flood water boundary. Since the water level is strongly correlated to flood extent, the terrain which confines the flood water should have a moderate slope to apply the method properly. A very steep slope would lead to increas-ing errors, because small changes in flood extent would lead to high variation in the water level estimates. This means that this method should only be applied for large flood events in which the normal river channel is overtopped. Apart from dense vegetation and urban structures at the flood boundary, also extremely flat terrain seems to cause problems with the accurate identification of the flood extent and thus can lead to errors in the derived water level estimates.
This study was able to demonstrate problems and possi-ble solutions when combining two different data sets – satel-lite data and DEM – for flood analysis and how to overcome discrepancies which can occur during the matching process. Even if both datasets are considered as highly accurate and their spatial resolution is in good accordance, a significant inconsistency may emerge as shown by the scattering of the water level estimates in the longitudinal profile. The causes for this are manifold and errors must be considered in both datasets. These errors may also be superimposed and can not be disentangled without high quality spatial validation data from the exact time of the satellite overpass. In the absence of such validation data the two data sets have to be weighted against each other. In the proposed approach the DEM is considered as “truth” because of the very high spatial reso-lution and accuracy of LiDAR, although there may still be some residual errors. In order to achieve coherence between the two data sets the flood mask is manipulated and fitted onto the DEM.
The proposed methodology does not work well in urban areas in which it is difficult to detect the exact position of the flood boundary in SAR-images in these image regions. The incidence angle of SAR systems as well as shadow/layover effects and strong backscattering (double bounce) caused by urban structures can all hamper the visibility of flood water in urban areas. However, the higher resolution SpotLight mode of TerraSAR-X should be used to find out more about the po-tential of this sensor’s ability to detect flood water in built-up areas. Assuming that the flood boundary can be reliably de-duced for at least one side of the river bank in urban areas, a very precise potential flood mask can still be provided for these areas without considering levees or mobile flood barri-ers
The proposed method was developed in the context of the earth-observation based mapping of flood parameters in sup-port of disaster management operations as well as to rapidly estimate flood damages. The requirements of such applica-tions are fulfilled in a way that computation time is negligi-ble and data requirements are low, i.e. only high resolution remote sensing data and LiDAR elevation data are needed. This work does not intend to replace accurate hydraulic mod-eling approaches which are more complex with respect to data requirements, parameterisation and computation time.
The proposed method has not yet been applied in real-time flood mapping operations, but is expected to improve accuracy and hydraulic reliability of SAR-based flood mon-itoring applications significantly. The main drawback of the profile method is that it depends on the availability of high resolution digital elevation models which are rather expen-sive and not readily available for a large number of basins. However, during the last years LiDAR DEMs became more and more available and have been successfully used for hy-draulic applications in river flood plains. In the near future, the upcoming TanDEM-X satellite constellation renders the possibility to provide elevation data of a new dimension on a global scale (Krieger et al., 2005). On this basis the proposed methodology represents a promising tool for improving flood monitoring and flood mapping, especially in large ungauged basins.
Acknowledgements. This work was supported by the Helmholtz Association of German Research Centres and the German Aerospace Center (DLR) within the framework of the “DIS-FLOOD” Project. The authors wish to thank the Environment Agency of England and Wales for providing the LiDAR DEM and aerial photography of the Tewkesbury region. Special thanks go to Andr´e Twele for supporting the flood depth computations and reading the manuscript, Alexandra F¨orster for reading the manuscript, Sandro Martinis for providing the TerraSAR-X flood mask and Marianne Wargenau for digitising the flood mask from aerial photos. Finally, the authors wish to thank the Referees for their constructive comments which greatly improved the paper.
Edited by: N. Verhoest
References
Baatz, M. and Sch¨ape, A.: Multiresolution Segmentation–an opti-mization approach for high quality multi-scale image segmenta-tion, Angewandte Geographische Informationsverarbeitung XII. Beitr¨age zum AGIT-Symposium Salzburg, 200, 12–23, 2000. Bates, P. D., Wilson, M. D., Horritt, M. S., Mason, D. C., Holden,
N., and Currie, A.: Reach scale floodplain inundation dynamics observed using airborne synthetic aperture radar imagery: Data analysis and modeling, J. Hydrol., 328, 306–318, 2006. Blaschke, T., Lang, S., Lorup, E., Strobl, J., and Zeil, P.:
Pub-lic, edited by: Cremers, A. and Greve, K.: Metropolis Verlag, Marburg, Germany, 2, 555–570, 2000.
Bonn, F. and Dixon, R.: Monitoring Flood Extent and Forecasting Excess Runoff Risk with RADARSAT-1 Data, Nat. Hazards, 35, 377–393, 2005.
Brivio, P. A., Colombo, R., Maggi, M., and Tomasoni, R.: Inte-gration of remote sensing data and GIS for accurate mapping of flooded areas, Int. J. Remote Sens., 23, 429–441, 2002. Fowler, R. A.: LIDAR for Flood Mapping, Earth Observation
Mag-azine, 9, 2002, http://www.eomonline.com/Common/Archives/ July00/robert.htm, access: 25 August, 2008.
Horritt, M. S., Mason, D. C., Cobby, D. M., Davenport, I. J., and Bates, P. D.: Waterline mapping in flooded vegetation from air-borne SAR imagery, Remote Sens. Environ., 85, 271–281, 2003. Krieger, G., Fiedler, H., Hajnsek, I., Eineder, M., Werner, M., and Moreira, A.: TanDEM-X: mission concept and performance analysis, IEEE International Geoscience and Remote Sensing Symposium Proceedings, 2005 (IGARSS ’05), 25–29 July 2005, Seoul, South Korea, 4890–4893, 2005.
Ling, F., Xiao, F., Du, Y., 5 Xue, H. P., and Ren, X. Y.: Waterline mapping at the subpixel scale from remote sensing imagery with high-resolution digital elevation models, Int. J. Remote Sens., 29, 1809–1815, 2008.
Mason, D. C., Horrit, M. S., Dall’Amico, J. T., Scott, T. R., and Bates, P. D.: Improving River Flood Extent Delineation From Synthetic Aperture Radar Using Airborne Laser Altimetry, IEEE T. Geosci. Remote, 45, 3932–3943, 2007.
Matgen, P., Schumann, G., Henry, J. B., Hoffmann, L., and Pfis-ter, L.: Integration of SAR derived river inundation areas, high-precision topographic data and a river flow model toward near real-time flood management, Int. J. Appl. Earth Obs., 9, 247– 263, 2007.
Meinel, G., Schumacher, U., and Hennersdorf, J.: GIS-Technical Evaluation of the Flood Disaster in Summer 2002 with respect to the City of Dresden on the Basis of Remote Sensing, Laser Scanner and Measurement Data, ISPRS International Archives of the Photogrammetry, Remote Sensing and Spatial Information Sciences, XXXIV, 104–111, 2003.
Pappenberger, F., Frodsham, K., Beven, K., Romanowicz, R., and Matgen, P.: Fuzzy set approach to calibrating distributed flood inundation models using remote sensing observations, Hydrol. Earth Syst. Sci., 11, 739–752, 2007,
http://www.hydrol-earth-syst-sci.net/11/739/2007/.
Sanders, B. F.: Evaluation of on-line DEMs for flood inundation modeling, Adv. Water Resour., 30, 1831–1843, 2007.
Sanyal, J. and Lu, X. X.: Application of Remote Sensing in Flood Management with Special Reference to Monsoon Asia: A Re-view, Nat. Hazards, 33, 283–301, 2004.
Schneiderhan, T., Huber, M., Zwenzner, H., and Hoffmann, J.: Use of ENVISAT ASAR and ERS SAR data for flood rapid mapping, ENVISAT Symposium, Montreux, Swiss, 2007.
Schumann, G., Black, A., Cutler, M., Henry, J.-B., Hoffmann, L., Matgen, P., and Pfister, L.: Hydraulic and event knowledge to reduce the positional uncertainty in SAR flood images for im-proved flood model calibration and development, 7th Interna-tional Symposium on Spatial Accuracy Assessment in Natural Resources and Environmental Sciences., Lisbon, Portugal, 633– 642, 2006.
Schumann, G., Hostache, R., Puech, C., Hoffmann, L., Matgen, P., Pappenberger, F., and Pfister, L.: High-Resolution 3-D Flood In-formation From Radar Imagery for Flood Hazard Management, IEEE T. Geosci. Remote, 45, 1715–1725, 2007.
Sheng, Y. and Xia, Z.-G.: A comprehensive evaluation of filters for radar speckle suppression, in: Remote Sensing for a Sustainable Future, International Geoscience and Remote Sensing Sympo-sium (IGARSS), Lincoln, Nebraska, USA, 1559–1561, 1996. Thieken, A. H., M¨uller, M., Kreibich, H., and Merz, B.: Flood
dam-age and influenceing factors: New insights from the August 2002 flood in Germany, Water Resour. Res., 41, 1–16, 2005.