Georgia State University
ScholarWorks @ Georgia State University
Public Health Theses School of Public Health
1-9-2015
Associations between Butylparaben and Thyroid
Levels in Females Aged 12 and over (NHANES,
2007-2008)
Andrea H. Decker
Follow this and additional works at:https://scholarworks.gsu.edu/iph_theses
This Thesis is brought to you for free and open access by the School of Public Health at ScholarWorks @ Georgia State University. It has been accepted for inclusion in Public Health Theses by an authorized administrator of ScholarWorks @ Georgia State University. For more information, please contact [email protected].
Recommended Citation
Decker, Andrea H., "Associations between Butylparaben and Thyroid Levels in Females Aged 12 and over (NHANES, 2007-2008)." Thesis, Georgia State University, 2015.
Associations between Butylparaben and Thyroid Levels in
Females aged 12 and over (NHANES, 2007-2008)
Andrea Harlow Decker
Master of Public Health
Associations between Butylparaben and Thyroid Levels in
Females aged 12 and over (NHANES, 2007-2008)
by
Andrea Decker
Approved:
____________________________________
Christine Stauber, Ph.D., M.S.
Committee Chair
____________________________________
Scott Weaver, Ph.D.
Author’s Statement
In presenting this thesis as a partial fulfillment of the requirements for an advanced degree from Georgia State University, I agree that the Library of the University shall make it available for
inspection and circulation in accordance with its regulations governing materials of this type. I agree that permission to quote from, to copy from, or to publish this thesis may be granted by the author or, in his/her absence, by the professor under whose direction it was written, or in his/her absence, by the Associate Dean, College of Health and Human Sciences. Such quoting, copying, or
publishing must be solely for scholarly purposes and will not involve potential financial gain. It is understood that any copying from or publication of this thesis which involves potential financial gain will not be allowed without written permission of the author.
____
Andrea Harlow Decker
_____
Acknowledgements
Notice to Borrowers Page
All theses deposited in the Georgia State University Library must be used in
accordance with the stipulations prescribed by the author in the preceding statement.
The author of this thesis is:
Andrea Harlow Decker
100 Brookstone Park
Newnan, GA 30265
The Chair of the committee for this thesis is:
Dr. Christine Stauber
Institute of Public Health
414 Petit Science Center
100 Piedmont Avenue, NE
Atlanta, GA 30302
Georgia State University
P.O. Box 3995
Atlanta, Georgia 30302-3995
Users of this thesis who not regularly enrolled as students at Georgia State University
are required to attest acceptance of the preceding stipulation by signing below.
Libraries borrowing this thesis for the use of their patrons are required to see that each
user records here the
Name of User
Address
Date
Type of Use
Curriculum Vitae
Andrea Harlow Decker
100 Brookstone Park (678) 301-9147
Newnan, GA 30265 [email protected]
Education
Master of Public Health (Epidemiology) Expected graduation December 2014
• Georgia State University; GPA: 3.93
Bachelor of Science in Health Education (Community Health) Graduated August 2012
• Georgia College and State University; GPA: 3.61 (institution GPA)
Public Health Experience
Public Health Practicum Healthcare Georgia Foundation May 2014- October 2014
• “Two Georgia’s” Initiative: Researching disparities associated with rurality. • Researching and constructing questionnaire questions for rural healthcare survey.
Community Health Intern Communities In Schools, Milledgeville May 2012-August 2012
• Redesigning the curriculum for the Scrubby Bear program, a part of the Red Cross. • Designing and promoting community health through projects and presentations.
Relevant Epidemiology Courses: Infectious Disease Epidemiology, STD/HIV Epidemiology, Principles of Tobacco Control, Public Health Policy, and Case Studies in Epidemiology.
Employment
Additional Experience and Awards
• Golden Key International Honour Society Member: Georgia State University Alpha Chapter • Public Health Student Organization: Georgia College and State University
• The Honors Program of Darton College: Scholar Award
• Chair member of the Scrubby Bear (Red Cross) program at Georgia College and State University
Skills
• Microsoft Office, SAS
Assistant Swim Coach Coweta County School System: Northgate High School October 2012- Present Student Assistant Center for Student Success: GCSU January 2012- May 2012 Resident Assistant Darton College Commons Dorms August 2009- May 2010 Assistant Swim Coach
and Lifeguard
Abstract
Background:
Paraben exposure occurs everyday to most people unknowingly. Parabens arepresent in most personal care products in varying amounts. Presently, parabens are not listed as endocrine disruptors; however, some research has shown parabens associated with decreases in thyroid hormone levels. The chemical and adsorption mechanism for parabens in association with thyroid hormones is not well understood. Determining whether parabens are associated with a change in thyroid hormone levels can help reduce the incidence of possible adverse health effects with exposure to parabens.
Methodology:
The selected study variables were analyzed using SAS version 9.2. Data wereobtained from the 2007-2008 National Health and Nutrition Examination Survey (NHANES). Analyses were performed separately for adolescent females (12-19) and adult females (20+). Weighted means were performed for the main independent and dependent variables of interest stratified by race/ethnicity groups and by smoking status. Independent samples t-test and ANOVA was used to test significance of differences of weighted means. Weighted bivariate linear regression was performed for each dependent variable (Thyroid Stimulating Hormone [TSH], Triiodothyronine [T3], and Thyroxine [T4]) regressed on butylparaben. Weighted multiple linear regressions were performed and parameter estimates with 95% confidence intervals were used to ascertain the
measure of effect. Separate regression models stratified by age group (adolescent vs. adult) were ran for each dependent variable (TSH, T3, and T4) regressed on butylparaben level and covariates, race/ethnicity and smoking status (ever smoked).
Results:
Weighted bivariate linear regression showed that among adult females, for each ng/ml increase in butylparaben, there was a -1.07 decrease in ng/dL T3 (p<. 05) levels. Among adult females, for each ng/ml increase in butylparaben was associated with a -0.12 decrease in ug/dL T4 (p<. 01) levels. Butylparaben was not predictive of TSH (p=. 15), T3 (p=. 79), or T4 (p=. 07) levels in adolescent females, whereas butylparaben in adult females was not predictive of TSH (p=. 55) levels.0.67 ug/dL lower than average T4 levels compared to other race adolescent females (p<. 0001), controlling for butylparaben and smoking status. Non-Hispanic Black female adolescents had 0.44 ug/dL higher than average T4 levels compared to other race adolescent females (p<. 05) whereas non-Hispanic black adults showed a 0.28 ug/dL higher than average T4 levels compared to other race adult females (p=. 05), controlling for butylparaben and smoking status. Ever smoking status was not associated with any of the thyroid hormone measures.
Conclusion:
While parabens are currently not considered endocrine disruptors, the humanmetabolism of and effects from exposure to parabens are not well understood. Results from this study showing decreased levels of some thyroid hormone levels (TSH, T3, and T4) associated with increased levels of butylparaben was found, as well as differences in thyroid hormone levels among
racial/ethnic groups. Although not many human studies have found significant results, 10 some
rodent studies have found butylparaben associations with thyroid hormone changes.4, 6, 19, 54 The
results of this study indicating no statistically significant association between butylparaben and decreases in thyroid hormone levels are consistent with results of some rodent studies.7, 8, 54, 55 In light of these findings, additional human studies with paraben exposure and thyroid hormone levels are needed to increase knowledge of the mechanism and effect of parabens in the human body.
Key Words:
Butylparaben, Thyroid Stimulating Hormone (TSH), Triiodothyronine (T3),Table of Contents
Abstract……….……6-7
List of Tables and Figures………10
Chapter I Introduction
1a. Background………..………..11
1b. Purpose of Study………...………11-12
1c. Hypothesis………..12
Chapter II Literature Review
2a. Overview of Parabens………..……..13
2b. Legislations of Parabens………...…13-14
2c. Exposure to Parabens……….14
2d. Metabolism of Parabens in Humans………...………..15-16
2e. Endocrine System……….16-17
2f. Triiodothyronine (T3)………17
2g. Thyroxine (T4)………..17
2h. Thyroid-Stimulating Hormone (TSH)………...17
2i. Endocrine Disruption……….……18-19
2j. Estrogenic Effects of Parabens………..19-20
2k. Smoking……….20
Chapter III Methodology
3a. Data Source………21
3b. Study Population………..21-22
Chapter IV Results
4a. Sample Demographics………...24
4b. Descriptive Statistics………25-28
4c. Bivariate Analysis……….28-29
4d. Multivariate Analysis………...29-32
Chapter V Discussion and Conclusion
5a.
Discussion……….………..33-34
5b. Strengths………35
5c. Limitations……….35
5d. Future Study……….35-36
5e. Conclusion………..36
References………..37-41
List of Tables and Figures
Figure 1: Basic Paraben Chemical Structure……….3
Figure 2: Butylparaben Chemical Structure………..3
Figure 3: Parabens Exposure and Metabolism Pathways………..6
Figure 4: Release and Flow of TSH, T3, and T4 Hormones.
Adapted from Faix & Thienpont 2013………...8
Figure 5: Inclusion and Exclusion Subsample Flow Chart………..12
Table 1: Distribution of Race/Ethnicity in Adolescent and Adult Females……….14
Table 2: Distribution of Race/Ethnicity in Butylparaben and Thyroid Hormone
Subgroups Among Adolescent and Adult Females……….14
Table 3: Weighted Means of Butylparaben, TSH, T3, and T4 for Adolescent
and Adult Females by Race/Ethnicity Groups……….15
Table 4: Weighted Means of Butylparaben, TSH, T3, and T4 for Adolescent
and Adults Female Smokers and Non-Smokers………..16
Table 5: Weighted Regression of TSH, T3, and T4 on Butylparaben for
Adolescent and Adult Females………16
Table 6: Weighted Regression of TSH (log mIU/L) on Butylparaben (log ng/ml)
and Covariates……….17
Table 7: Weighted Regression of T3 (ng/dL) on Butylparaben (log ng/ml)
and Covariates………..18
Table 8: Weighted Regression of T4 (ug/dL) on Butylparaben (log ng/ml)
and Covariates………..19
Appendices:
Table 9: Parabens and Synonymous Names………29
Table 10: Trimester Specific T3, T4, and TSH Hormone Ranged During Pregnancy………30
Chapter I
Introduction
1a. Background
Parabens, widely used for their antibacterial properties, are found in many personal care products. Parabens are an ester of parahydroxybenzoic acid. It is believed that the pharmaceutical industry first used parabens as preservatives in the 1920s. Over the decades since its introduction, parabens have found their way into many products used daily such as cosmetics, hair products, lotions, shaving products, etc. Parabens are sometimes used in food and drink products, especially canned goods, to help preserve the product and create a longer shelf life.
Starting in the early 1990s the fear of possible endocrine disrupting powers of parabens began, due
to articles suggesting negative health effects from pesticides and other man-made chemicals.1-4 In
vivo and in vitro studies soon followed; an overview of these studies will be covered in the literature review. To date, it is uncertain whether or not parabens cause endocrine disruption in humans. Many rodent studies have shown estrogenic tendencies, whereas some others have shown small to no estrogenic effect. 5-9 Few human paraben studies have been completed, 10-12 also with conflicting results.
A small number of natural or chemical compounds have been scientifically proven to create
endocrine disruption including, diethylstilbesterol (DES), dioxin, polychlorinated biphenyls (PCBs),
DDT, and some other pesticides. 13 Endocrine disruption causes interference with the normal functioning of the endocrine system. Thyroid hormones, which control many bodily functions including growth, development, and reproduction, are very important to human homeostasis. Thyroid hormones are also incredibly important for fetus and child development, without which could cause detrimental developmental effects. The long-term, low-dose effect of paraben exposure is not known, nor has it been studied, thus the risk for negative human health effects is unknown.14
1b. Purpose of Study
levels this study aims to use a nationally representative dataset to show the association of urine paraben levels with blood thyroid levels.
1c. Hypothesis
H1: Butylparaben will be associated with decreases in thyroid hormone levels (TSH, T3, and T4). H0: Butylparaben will not be associated with decreases in thyroid hormone levels (TSH, T3, and T4).
This study examined the research question of whether butylparaben levels in urine was associated with blood thyroid hormone levels (TSH, T3, and T4) in females aged 12 and over in the National Health and Nutrition Survey from 2007-2008. Specifically, the central hypothesis of this study is that butylparaben will cause thyroid hormone levels to decrease. Previous studies showed that analyzing data among two separate age groups, adolescents aged 12-19 and adults age 20 and over, was
warranted due to differing thyroid activity among age groups.10 The results of some studies suggest
that parabens might be thyroid hormone receptor agonists.15, 16 Ever smoking and race/ethnicity were
Chapter II
Literature Review
The literature review contains compiled research from various studies on paraben exposure and thyroid levels as well as the estrogenic and endocrine disrupting effects of parabens. This review also is composed of an overview of parabens, the endocrine system, and thyroid hormones. The literature review is designed to help understand parabens, how they work, and what effects they have on human health.
2a. Overview of Parabens
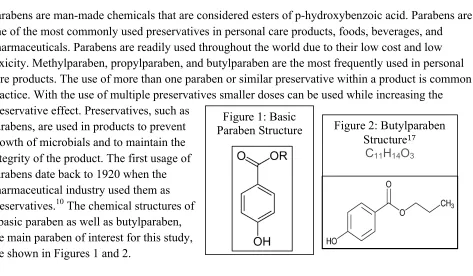
Parabens are man-made chemicals that are considered esters of p-hydroxybenzoic acid. Parabens are one of the most commonly used preservatives in personal care products, foods, beverages, and pharmaceuticals. Parabens are readily used throughout the world due to their low cost and low toxicity. Methylparaben, propylparaben, and butylparaben are the most frequently used in personal care products. The use of more than one paraben or similar preservative within a product is common practice. With the use of multiple preservatives smaller doses can be used while increasing the preservative effect. Preservatives, such as
parabens, are used in products to prevent growth of microbials and to maintain the integrity of the product. The first usage of parabens date back to 1920 when the pharmaceutical industry used them as preservatives.10 The chemical structures of
a basic paraben as well as butylparaben, the main paraben of interest for this study, are shown in Figures 1 and 2.
2b. Legislation of Parabens
In the United States, parabens are not widely legislated. The Food and Drug Administration (FDA) does not regulate ingredients in cosmetics, where a majority of parabens can be found. Color additives are the only ingredient that may be regulated by the FDA under The Federal Food, Drug,
and Cosmetic Act (FD&C Act). 18 In comparison, many other countries, including the European
Union (EU) countries and Japan, have limits on the amount by mass of parabens allowed in cosmetic products: 0.4% for a single paraben and 0.8% for multiple parabens in EU countries, and 1.0% total
paraben concentration in Japan.19 Increasing concern about endocrine disruption from man-made
chemicals has lead to a review of the toxicity of parabens. The Cosmetic Ingredient Review expert panel examined the safety assessment of parabens in 2008. After reviewing hundreds of references on parabens the panel concluded that parabens are safe to use. The panel set no-observed adverse
Figure 2: Butylparaben Structure17
C11H14O3
[image:15.612.65.538.238.514.2]
effect levels (NOAEL’s) at 1.2mg/kg bw/day for adults and 0.3mg/kg bw/day for infants.20 In the European Union the Scientific Committee on Consumer Products (SCCP) concluded that
methylparaben and ethylparaben are safe for use in cosmetics at up to 0.4% of the cosmetic
concentration, with an acceptable daily intake (ADI) set at 10mg/kg/bw/day.20 Insufficient results
were found for propyl-, isopropyl-, butyl-, and isobutylparaben, with no ADI set for these parabens.
Butylparaben is not safe to be used in food products according to data collected by the WHO.21, 22
Examining the regulation that other countries have placed on parabens in comparison to the United States, there is a need for product review programs to regulate parabens being used for human consumption. A sign of hope for paraben regulation is the formation of the United States Endocrine
Disruptor Screening and Testing Advisory Committee (EDSTAC).23
2c. Exposure to Parabens
The most common exposure to parabens is through personal care products including but not limited to: makeup, moisturizers, hair-care products, shaving creams, pharmaceuticals, foods, drinks. A 1995 study by Rastogi et al. analyzed 215 cosmetic products and found that 77% of rinse-off
products contained parabens, while 99% of leave-on products contained parabens.24 Dodson et al.
completed a study which tested 213 products for parabens; parabens were found in 10 products, 7 of
which were from products where parabens were not found on the label.25 A study done by Rastogi
found that 45% of skin creams were incorrectly labeled, while 10% of other products were
mislabeled with respect to parabens.26 Retail cosmetics must declare ingredients on the packaging of
the product, which helps to determine which products contain parabens. In Appendix 1 is a list of names used for each paraben.
Humans are exposed to parabens via three routes: dermal, inhalation, and ingestion. The majority of personal care products enter the body through dermal exposure. While food and drink are the main sources of ingestion and air (and dust) is the main route for inhalation exposure, presumably from
personal care product usage.27, 28 The amount of parabens found in indoor air and dust vary
regionally, most likely due to differing consumption of paraben containing personal care products.27
Parabens have also been found in ground water as well as waste water treatment facilities, most
likely caused by run-off from daily usage of parabens.29 Daily estimates of paraben usage from
cosmetic products for adults is 17.76g and 0.378g for infants, calculated by Błędzka, et al. from
Cosmetic Ingredient Review panel estimates.19 The U.S. Food and Drug Administration’s Center for
Food Safety and Applied Nutrition has estimated a consumption rate of 37 ng/day for
butylparaben.30 Differences in daily exposure may be due to environmental factors.31 Environmental
factors could include differences in climate, socioeconomic, cultrual, or demographic factors. These factors can change the amount of paraben containing products used. It has been found that women have higher rates of parabens found in their blood, most likely due to the amount of paraben
2d. Metabolism of Parabens in Humans
Metabolism of parabens in the human body depends on the route of exposure. After oral exposure, the parabens travel to the gastrointestinal tract and blood where they are rapidly absorbed. It is thought that parabens are broken down by esterase, leading to hydrolysis; p-hydroxybenzoic acid
(PHBA) is the main product that results from hydrolysis of parabens.33 The metabolized parabens
are then excreted in urine and feces. The body excretes a majority of orally ingested parabens within
the twenty-four hours following exposure.19 Dermal exposure also results in absorption into the
blood stream and metabolism by esterase. Increased chain length of the paraben decreases the ability
of the paraben to penetrate the skin.20 However, the metabolic rate of parabens is based on the
amount of paraben that penetrates the skin; for example, butylparaben is hydrolysed at a higher rate
when compared to propylparaben.34 Oral and dermal exposures both lead to absorption in the blood
as well as the liver. In the liver the parabens are adjoined with glycine, sulfate, or glucuruonate,
which aids in the breakdown of parabens for excretion in the urine.35 Parabens also have lipophilic
characteristics that cause them to be absorbed and remain intact in human tissue. According to Aubert et al. results of a study on lab rats showed that 50% of dermally applied paraben was
absorbed.36 The presence of intact parabens found in human excretions shows that they have escaped
either skin or intestinal/liver metabolism.37
Continuous dermal exposure to parabens may result in bioaccumulation according to a study by
Ishiwatari et al.38 It has been shown that hydrolysis of parabens occurs more slowly in dermal
exposure compared to exposure to the liver by route of ingestion.39 The slowed hydrolysis of
dermally exposed parabens may be the reason for accumulation in the body. In comparison to oral and dermal absorption of parabens in the body, subcutaneous exposure creates a large exposure to
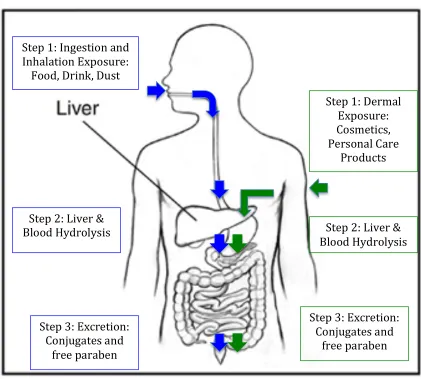
parabens in the body due to the bypassing of hydrolysis in skin and gastrointestinal system.40 Figure
3, shows the different human exposure to parabens and how they are metabolized in the body.
Human metabolism data are lacking, particularly showing the fraction of excreted paraben versus the fraction of excreted p-hydroxybenzoic acid; which would aid understanding the differences in
metabolism by exposure route.41 However, it is known that most of a paraben is excreted in a
Figure 3: Exposure and Metabolism Pathways of Parabens
2e. Endocrine System
The endocrine system controls many human bodily functions. The endocrine system produces hormones at various glands located in the body. The hormones then travel all over the body to maintain organs and tissues. The glands that release the hormones act as messengers to the receptors that collect and respond to the hormones. Reproduction, growth, sexual development, energy levels, bone and muscle strength, and homeostasis are some, but not all, of the areas that are governed by
the endocrine system.43 The endocrine system has ten glands including: adrenal, hypothalamus,
ovaries, pancreas, parathyroid, pineal, pituitary, testes, thymus, and thyroid gland.44 Hormones created in the endocrine system must find a compatible receptor in order to bind and carryout the
instructions of the hormone.45 Hormones in reaction to a receptor can do one of two things, either
alter an existing protein or turn on a gene to create a new protein. The main hormones of interest for
Step 1: Ingestion and Inhalation Exposure:
Food, Drink, Dust
Step 2: Liver & Blood Hydrolysis
Step 3: Excretion: Conjugates and
free paraben
Step 1: Dermal Exposure: Cosmetics, Personal Care
Products
Step 2: Liver & Blood Hydrolysis
Step 3: Excretion: Conjugates and
the human body, the pituitary gland creates thyroid-stimulating hormone (TSH), among other hormones, while T3 and T4 are created by the thyroid gland.
2f. Triiodothyronine (T3)
Triiodothyronine or T3 is created from a conversion of T4 in the blood. The lifespan of T3 is shorter than the lifespan of T4 to help ensure that T4 creates a steady flow of T3 in the body. The reference
values of T3 are 80-190 ng/dL for those aged one or older.46 High levels of T3 can create rapid heart
rate, insomnia, anxiety, as well as harm to the bones.47 For adults and children, T3 values greater than 180 ng/dL and greater than 200 ng/dL, respectively, are signs of hyperthyroidism.
Hyperthyroidism should not be diagnosed using only a T3 test result, but a thyroid panel instead. Lower than average T3 levels could be due to a long-term illness, hypothyroidism, or starvation.
2g. Thyroxine (T4)
Thyroxine or T4 is created by the thyroid gland of the endocrine system. T4 tests are usually done on patients that may have hyper- or hypothyroidism or infertility problems. Some things may cause T4 levels to increase including, birth control, estrogens, methadone, tamoxifene, steroids, androgens,
barbiturates, and lithium. A normal range of T4 is 4.5-11.2 mcg/dL.48 Results that are below the
normal range could be caused by many things, including hypothyroidism, long term illness, or malnutrition.
2h. Thyroid-Stimulating Hormone (TSH)
Thyroid-stimulating hormone also known as thyrotropin, is created by the pituitary gland, which is then sent to the thyroid gland in order to create T4 and T3. As shown in Figure 4, the pattern of release and flow for TSH, T3, and T4 is shown throughout the endocrine system. TSH is released in a diurnal pattern, which means that it is released daily with it active mainly in the daytime.49 The normal reference range for TSH usually depends on the health professional, but this study will use
the American Association of Clinical Endocrinologists range of 0.2-3.0 mIU/L.50 TSH values below
Figure 4: Release and Flow of TSH, T3, and T4 Hormones Adapted from Faix & Thienpont 2013.49
2i. Endocrine Disruption
Endocrine disruption occurs when a body is exposed to a chemical, either natural or man-made, which in turn causes interference with the body’s normal endocrine system functioning, producing
adverse effects.51 Chemicals that disrupt the endocrine system are called, endocrine-disrupting
compounds (EDC). 52 It is important to note that some endocrine disruptors may be naturally present
in food as phytoestrogens.23 There are many definitions of endocrine-disrupting compounds.
The EPA has defined EDC as, …exogenous agents that interfere with the production,
release, transport, metabolism, binding, action, or elimination of the natural hormones in the body responsible for the maintenance of homeostasis and the regulation of developmental processes.53
Estrogens, either natural or chemically derived, are known to increase T4-binding globulin (TBG),
which in turn increases total T4 concentrations.12 This increase of T4 is thought to make the
endocrine system unstable, which may lead to endocrine disruption. Endocrine disruption can occur
one of four ways. First, the chemical can simulate a hormone, which confuses the body into over-responding to the stimulus. Second, the chemical can imitate the hormone and cause it to respond at incorrect times. Third, the chemical can block the receptors of a hormone. Finally, the chemical can over or under produce hormones to stimulate or hinder the system. Endocrine disruptors are thought
to be able to bind to the estrogen receptor, which would affect the estrogen-dependent genes.5
Another option is that parabens are similar structurally to xenobiotics, thus the estrogenicity of
parabens may be a result of suppression of estrogen sulfotransferases (SULTs). 54 Taxvig et al,
believes that parabens interfere with the transport of cholesterol to the mitochondria, which would thereby interfere with steroidogenisis.15
It is important to note that some pharmaceuticals purposely create endocrine disrupting effects, such as birth control pills. Following the passing of the Food Quality Protection Act and the Safe
Drinking Water Act in 1996, the EPA began screening chemicals for endocrine disruption
capabilities under the Endocrine Disruptor Screening Program (EDSP). 55 A lack of regulation for
parabens and other potential endocrine disrupting compounds has led to many in vivo and in vitro studies to examine the estrogenic effects of parabens (see table 3 in appendices).
2j. Estrogenic Effects of Parabens
It has been theorized that butylparaben possesses weak estrogenic effects when exposed
subcutaneously, while another study found negative fertility effects from oral exposure to butyl- and
propylparaben.5, 7 When the latter study was repeated with a larger study design, no effect was
found.8, 9 Another rodent development study found that butylparaben did not affect development of
rodent fetuses in any aspect, which led to the finding that butylparaben does not have a strong
estrogenic effect on development.56 Some may argue that the estrogenic effects found in rodent
studies cannot be extrapolated to humans.57 A study conducted on humans, dermally exposed 2.0%
butylparaben on the whole body for two weeks did not have a reproductive effect.12 Another
important study using fertility clinic data showed no evidence for a relationship between methyl-, propyl-, or butylparaben and altered hormone levels or sperm quality; however, it was found that butylparaben has greater reproductive toxicity potential.11 A nationally representative data study
showed ethyl- and butylparaben to decrease thyroid hormone levels in females but not males.10
It is thought that disease of the thyroid gland is related to breast cancer, however this has not been proven. Some studies have found parabens in breast cancer tissue 14, 58 and try to link parabens to breast cancer. However, there is no scientific basis for hypothesizing that parabens are linked to the
development of breast cancer.59 Over recent decades an increase of breast cancer incidence has been
correlated with the growth of personal care product use in the Western world, however it is important to note that other lifestyle changes have occurred during this time that could possibly confound correlation results.14 Another difficulty in establishing causation of parabens is that the
harm or adverse effects may not come until many years after exposure.60
Table 3 in the appendices, shows the various studies that have shown estrogenic effects from
butylparaben, adapted from P.W. Harvey and D.J. Everett.61 According to Scialli, A. (2011) the
studies each have limitations that make them unsupported, outlined in his paper.40 While the debate
of the estrogenic effects of parabens continues, some people have disputed the possible additive or
synergistic effect of multiple weak estrogenic compounds.62 However it has been found that
compounds that are considered reproductive toxins have an adversity threshold, which would limit the additive or synergistic effects of multiple parabens.63 The long-term effects of low-level paraben
exposure on the human body have not been studied and therefore are unknown.58 A need for further
research on paraben human exposure is important to further understand paraben potency.
2k. Smoking
Smoking cigarettes has been shown to have a weak stimulatory effect on thyroid function and size.64
Although the mechanism is unknown, it is thought that the nicotine included in tobacco products
causes a stimulatory effect of the nervous system, which in turn increases thyroid secretion.65 Some
studies have found TSH levels are lower in those who are smokers.66-68 Various studies have shown
Chapter III
Methodology
3a. Data Source
Data used in these analyses were collected from the 2007-2008 National Health and Nutrition
Examination Survey (NHANES).76 NHANES is conducted by the Center for Disease Control and
Prevention (CDC) as an ongoing, cross-sectional study on the health and nutrition of adults and children in the United States. Participants of NHANES are selected by stratified multistage
probability sampling of the civilian non-institutionalized population of the United States.77 The first
stage of the multistage probability sampling of NHANES began with primary sampling units (PSUs), which were usually counties or small groups of adjacent counties. The PSUs were selected with probabilities proportionate to size. During the second stage, blocks or groups of blocks were selected within the PSUs. For the third stage, selections of dwelling units within the census blocks were chosen. During the fourth and final stage, a group of individuals were chosen from the sampled
households to complete the household interview.78 Survey information was collected through
household interviews by trained interviewers. Physical examinations, laboratory tests, and other measurements were completed in mobile examination centers.
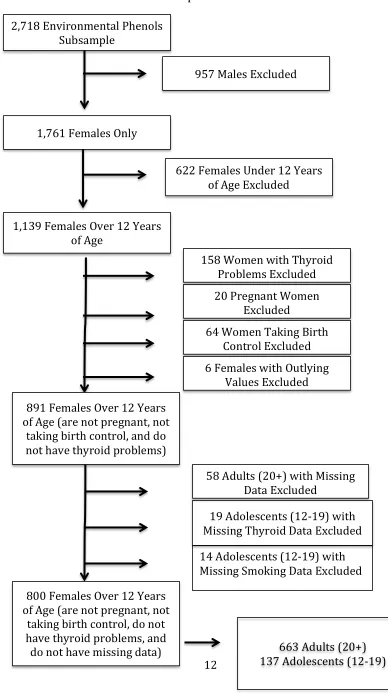
3b. Study Population
Figure 5. Inclusion and Exclusion Subsample Flow Chart
2,718 Environmental Phenols Subsample
957 Males Excluded
20 Pregnant Women Excluded
64 Women Taking Birth Control Excluded 158 Women with Thyroid
Problems Excluded 622 Females Under 12 Years
of Age Excluded
6 Females with Outlying Values Excluded
19 Adolescents (12-‐19) with Missing Thyroid Data Excluded
58 Adults (20+) with Missing Data Excluded
1,761 Females Only
1,139 Females Over 12 Years of Age
891 Females Over 12 Years of Age (are not pregnant, not
taking birth control, and do not have thyroid problems)
800 Females Over 12 Years of Age (are not pregnant, not
3c. Butylparaben and Serum Thyroid Measures
Butylparaben and serum thyroid measures were measured in a one-third subsample of the dataset. Subsamples were done to prevent participant burnout. Mobile examination centers were used to collect examination and laboratory data. Butylparaben measures were collected from participants 6 and over using spot urine samples that were stored at -20°C until analysis. Hydrolysis of the
conjugated specimen using β-glucuronidase/sulfatase, was followed by solid phase extraction (SPE),
reverse-phase high-performance liquid chromatography separation, and atmospheric pressure chemical ionization-isotope dilution and tandem mass spectrometry (MS/MS). These measure
methods are more fully described in a previous study.42 The limit of detection (LOD) for
butylparaben was 0.2 ug/L. Serum thyroid measures were collected from participants 12 years and over from the NHANES thyroid profile. The serum samples were measured with immunoenzymatic assays.
3d. Data Analysis Overview
Data analyses were performed using SAS software (version 9.2; SAS Institute, Cary, NC). SAS survey procedures were employed to account for the complex, multistage study design of
NHANES.79 Results presented are weighted except where noted otherwise. Descriptive statistics
were obtained to summarize the distribution of study variables. Butylparaben and TSH were non-normally distributed for both the adolescent and adult age groups and was log transformed. Concentrations of butylparaben that were below the LOD (limit of detection) were replaced in the NHANES dataset with values equal to the LOD divided by the square root of two. Weighted means were obtained for the main independent and dependent variables of interest stratified by
race/ethnicity group and by smoking status. Independent samples t-test and ANOVA was used to test whether butylparaben, TSH, T3, or T4 levels differed across race or smoking status groups.
Weighted bivariate linear regression was performed for each independent variable with the
Chapter IV
Results
4a. Sample Demographics
The sample of females 12 years old and over totaled to 891 participants after exclusionary criteria were applied. Thirty-three adolescents (12-19 years old) were omitted from the analytic sample due to missing data on the variables, while 58 adults (20+ years old) were excluded due to missing values. The final study analytic data consisted of 800 participants, with 663 in the adult (20+years old) age group and 137 in the adolescent (12-19 years old) age group.
All analyses were done with stratified age groups and all results will be shown stratified. The participants ranged in age from 12 to 80 with a mean age 43.79 (SD=20.29) for the total subsample. The average age for adolescents was 15 (SD=2.14) while the average age for adults was 50
[image:26.612.58.553.337.448.2](SD=16.71). Table 4 describes the racial/ethnic distribution of adolescent and adults females.
Table 1: Distribution of Race/Ethnicity in Adolescent and Adult Female Study Subsamples Adolescent Females N (%) Adult Females N (%)
Mexican American 39 (25.83) 132 (19.91)
Other Hispanic 27 (17.88) 86 (12.97)
Non-Hispanic White 37 (24.50) 282 (42.53)
Non-Hispanic Black 43 (28.48) 137 (20.66)
Other Race- Including Multi-Racial 5 (3.31) 26 (3.92)
a
[image:26.612.62.527.486.705.2]Unweighted Estimates of Race/Ethnicity
Table 2: Distribution of Race/Ethnicity in Butylparaben and Thyroid Hormone Subgroups Among Adolescent and Adult Female Study Subsamples
Adolescent Females N (%) Adult Females N (%)
Butylparaben: 170 721
Mexican American 43 (25.29) 139 (19.28)
Other Hispanic 28 (16.47) 88 (12.21)
Non-Hispanic Black 41 (24.12) 294 (40.78)
Non-Hispanic White 53 (31.18) 171 (23.72)
Other Race-Including Multi-Racial 5 (2.94) 29 (4.01)
TSH, T3, T4: 137 663
Mexican American 39 (25.83) 132 (19.91)
Other Hispanic 27 (17.88) 86 (12.97)
Non-Hispanic Black 37 (24.50) 282 (42.53)
Non-Hispanic White 43 (28.48) 137 (20.66)
4b. Descriptive Statistics
As shown in Table 3, weighted means concentrations of ng/ml butylparaben, mIU/L TSH, ng/dL T3, and ug/dL T4 levels are shown with comparison between age and race. Among adolescent females, Mexican Americans had the highest mean concentration levels of butylparaben, T3, and T4. Other Hispanic Adolescents had the lowest mean concentration levels of butylparaben and T3. Non-Hispanic White adolescents had the highest mean concentration levels of TSH and the lowest mean concentration levels of T4, whereas the other race group, which includes multi-racial races, had the lowest mean concentration levels for TSH.
Adult female non-Hispanic Whites had the highest mean concentrations of butylparaben and TSH, while the other race group, which includes multi-racial races, had the lowest mean concentration levels of butylparaben and non-Hispanic Blacks had the lowest mean concentration levels of TSH. Adult Mexican Americans had the highest mean concentration levels of T3 and T4, whereas other race adult females, which include multi-racial races, had the lowest mean concentration levels of T3 and T4 mean levels.
[image:27.612.29.586.464.710.2]The age stratified, weighted mean concentrations for TSH (mIU/L) , T3 (ng/dL), and T4 (ug/dL) between adolescents who ever smoked and those who did not as well as adults who have smoked at least 100 cigarettes and those who have not are presented in Table 4.
Table 3: Weighted Means of Butylparaben, TSH, T3, and T4 for Adolescent and Adult Females by Race/Ethnicity Groups
Mean (95% Confidence Interval) Butylparaben
(log ng/ml)
TSH (log mIU/L)
T3 (ng/dL)
T4 (ug/dL)
Adolescent Females (12-19) 0.25 (0.10-0.65) 2.06 (1.54-2.75) 121.65 (117.28-126.01) 7.44 (7.25-7.62) Mexican American 0.96 (0.14-6.43) 1.71 (1.20-2.43) 130.16 (115.28-145.04) 8.19 (7.65-8.74) Other Hispanic 0.08 (0.03-0.28) 1.60 (0.79-3.25) 125.51 (116.57-134.46) 7.67 (7.37-7.98) Non-Hispanic Black 0.19 (0.05-0.65) 2.80 (2.15-3.63) 121.24 (115.48-126.99) 7.12 (6.93-7.31) Non-Hispanic White 0.28 (0.15-0.49) 1.49 (1.10-2.02) 116.74 (111.86-121.62) 7.64 (7.36-7.91) Other Race- Including Multi-Racial 1.61 (0.14-18.2) 0.45 (0.06-3.31) 114.47 (98.14-130.79) 8.07 (7.50-8.65)
Table 4: Weighted Means of Butylparaben, TSH, T3, and T4 for Adolescent and Adults Female Smokers and Non-Smokers
Adolescent Females (12-‐19) Adult Females (20+)
Smoking (Yes) Smoking (No) Smoking (Yes) Smoking (No)
TSH Mean [log mIU/L] (95% CI)
2.61
(1.41-4.82) (1.35-2.82)1.95 (1.78-3.57)2.61 (2.70-4.36)3.43
T3 Mean [ng/dL] (95% CI)
121.77
(114.71-128.82) (116.36-128.65)122.51 (106.00-109.71)110.43 (103.13-109.71)106.42
T4 Mean [ug/dL] (95% CI)
7.51 (7.11-7.92)
7.41 (7.13-7.69)
7.57 (7.39-7.75)
7.67 (7.42-7.92)
Butylparaben Mean [log ng/ml] (95% CI)
0.32
(0.12-0.89) (0.09-0.44) 0.19
1.12
(0.57-2.20) (0.96-2.69)1.61
a Adolescent Smoking question: Have you ever smoked before?
b Adult Smoking question: Have you smoked at least 100 cigarettes in lifetime?
4c. Bivariate Analysis
Weighted bivariate regression analysis was performed for TSH, T3, and T4 separately for adolescent and adults females. Table 6, shows bivariate weighted regression coefficients with 95% confidence intervals. Among adult females, a one-ng/ml increase in butylparaben was associated with a -1.07 decrease ng/dL in T3 (p<. 05). Among adult females, a one-ng/ml increase in butylparaben was associated with a -0.12 decrease ug/dL in T4 (p<. 01). Butylparaben level was not predictive of TSH (p=. 15), T3 (p=. 79), or T4 (p=. 07) levels in adolescent females, whereas butylparaben levels in adult females was not predictive of TSH (p=. 55) levels.
Table 5: Weighted Regression of TSH, T3, and T4 on Butylparaben for Adolescent and Adult Females
β (95% CI)
*Butylparaben (log ng/ml)
Adolescent Females (12-19)
TSH (log mIU/L) -0.29 (-0.68-0.10) T3 (ng/dL) -0.00 (-0.01-0.01) T4 (ug/dL) 0.24 (-0.01-0.50)
Adult Females (20+)
TSH (log mIU/L) -0.05 (-0.24-0.13) T3 (ng/dL) -1.05 (-2.05- -0.04)* T4 (ug/dL) -0.20 (-0.30- -0.09)**
[image:28.612.134.451.522.695.2]4d. Multivariate Analysis
Six multiple regression analyses were performed. Butylparaben was the exposure variable, and TSH, T3, and T4 were the outcome variables, with smoking and race as controlling variables. The multiple regression analyses were performed separately for adolescent females (12-19) and adult females (20+). Results of the multivariate regressions stratified by age group are presented in Tables 6-8.
4d1. Thyroid Stimulating Hormone (TSH)
a.
Adolescent Females (12-19 years)
TSH levels for Other Hispanic adolescent females had 0.3 mIU/L higher than the average of all racial/ethnic groups, adjusting for butylparaben, smoking, and race (p<. 05). Butylparaben (p=. 10) and smoking (p=. 40) were not associated with TSH level change. Mexican
American (p=. 57), non-Hispanic White (p=. 59) and non-Hispanic Black (p=. 48) race/ethnicities were not associated with TSH level changes among adolescent females.
b.
Adult Females (20+ years)
[image:29.612.49.543.481.700.2]TSH levels for Mexican American adult females were 0.17mIU/L lower than the average of all racial/ethnic groups, adjusting for butylparaben, smoking, and race (p<. 01). TSH levels for other Hispanic adult females were 0.12mIU/L higher than the average of all racial/ethnic groups, adjusting for butylparaben, smoking, and race (p<. 05). Butylparaben (p=. 30) and smoking (p=. 07) were not associated with TSH level change. Non-Hispanic White (p=. 79) and non-Hispanic Black (p=. 41) race/ethnicities were not associated with TSH level changes among adult females.
Table 6: Weighted Regression of TSH (log mIU/L)on Butylparaben (log ng/ml) and Covariates Independent Variables Adolescent Females (12-19)
N=137
Adult Females (20+) N=663
β (95%CI)
Butylparaben -0.05 (-0.10-0.01) -0.01 (-0.04-0.01)
Smoking 0.14 (-0.20-0.47) -0.14 (-0.30-0.01)
Mexican American 0.07 (-0.17-0.30) -0.17 (-0.26- -0.07)**
Other Hispanic 0.30 (0.03-0.57)* 0.12 (0.00-0.24)*
Non-Hispanic Black 0.06 (-0.19-0.32) 0.02 (-0.16-0.20)
Non-Hispanic White 0.09 (-0.18-0.36) 0.05 (-0.07-0.17)
F 7.46 7.25
df 6, 16 6, 16
R2 (adjusted R2) 0.12 (0.11) 0.025 (0.022)
p <. 0001* <. 0001*
4d2. Triiodothyronine (T3)
a.
Adolescent Females (12-19 years)
None of the covariates in the model significantly changed T3 levels. Butylparaben (p=. 66), smoking (p=. 83), Mexican American (p=. 12), other Hispanic (p=. 74), non- Hispanic White (p=. 39), and non-Hispanic Black (p=. 83) races/ethnicities were not associated with changes in T3 levels among adolescent females.
b.
Adult Females (20+ years)
[image:30.612.48.551.408.627.2]T3 levels for other Hispanic adult females were 0.03 ng/dL lower than the average of all racial/ethnic groups, adjusting for butylparaben, smoking, and race (p<. 05). Butylparaben (p=. 12), smoking (p=. 16), Mexican American (p=. 54), non-Hispanic White (p=. 12), and non-Hispanic Black (p=. 16) races/ethnicities were not associated with change in T3 levels among adult females.
Table 7: Weighted Regression of T3 (ng/dL) on Butylparaben (log ng/ml) and Covariates Independent Variables Adolescent Females (12-19)
N=137
Adult Females (20+) N=663
β (95%CI)
Butylparaben -0.51 (-2.88-1.86) -0.01 (-0.02-0.00)
Smoking -1.03 (-10.99-8.94) 0.04 (-0.02-0.09)
Mexican American -6.14 (-14.15-1.88) -0.01 (-0.06-0.03)
Other Hispanic -1.12 (-8.08-5.84) -0.03 (-0.06- -0.00)*
Non-Hispanic Black 3.74 (-5.32-12.80) 0.03 (-0.01-0.07)
Non-Hispanic White 9.49 (-10.99-8.94) 0.03 (-0.01-0.07)
F 2.64 8.08
df 6, 16 6, 16
R2 (adjusted R2) 0.05 (0.03) 0.028 (0.025)
p 0.0165* <. 0001*
4d3. Thyroxine (T4)
a.
Adolescent Females (12-19 years)
T4 levels for other Hispanic adolescent females were 0.67 ug/dL lower than the average of all racial/ethnic groups, adjusting for butylparaben, smoking, and race (p<. 0001). T4 levels for Non-Hispanic White adolescent females were 0.44 ug/dL higher than the average of all racial/ethnic groups, adjusting for butylparaben, smoking, and race (p<. 05). Butylparaben (p=. 18), smoking (p=. 84), Mexican American (p=. 34), and non-Hispanic Black (p=. 77) racial/ethnic groups were not associated with change in T4 levels among adolescent females.
b.
Adult Females (20+ years)
Adult female T4 levels were 0.12 ug/dL lower than average with increased butylparaben exposure, adjusting for butylparaben, smoking, and race (p<. 01). Smoking (p=. 51),
[image:31.612.56.549.394.622.2]Mexican American (p=. 47), non-Hispanic Black (p=. 05), and non-Hispanic White (p=. 40) racial/ethnic groups were not associated with change in T4 levels among adolescent females.
Table 8: Weighted Regression of T4 (ug/dL) on Butylparaben (log ng/ml) and Covariates Independent Variables Adolescent Females (12-19)
N=137
Adult Females (20+) N=663
β (95%CI)
Butylparaben 0.13 (-0.07-0.33) -0.12 (-0.19- -0.05)**
Smoking 0.07 (-0.60-0.74) -0.07 (-0.29-0.15)
Mexican American -0.14 (-0.45-0.16) -0.08 (-0.30-0.14)
Other Hispanic -0.67 (-0.93- -0.42)*** -0.24 (-0.50-0.02)
Non-Hispanic Black 0.06 (-0.39-0.52) 0.17 (-0.24-0.57)
Non-Hispanic White 0.44 (0.07-0.81)* 0.28 (-0.01-0.57)
F 9.09 10.52
df 6, 16 6, 16
R2 (adjusted R2) 0.15 (0.13) 0.04 (0.03)
p <. 0001* <. 0001*
Chapter V
Discussion and Conclusion
In this analysis of data from 2007- 2008 NHANES exposure to butylparaben and hormone levels (TSH, T3, and T4), bivariate results among adult females found that, butylparaben was associated with decreases in T3 among adult females, but not associated with change in T3 among adolescent females. Butylparaben was associated with decreases in T4 among adult females, but was not associated with change in T4 among adolescent females. No association was found for TSH change from increased butylparaben levels in adolescent or adult females. Multivariate results show
butylparaben associated with a decrease in T4 levels among adult females but not with adolescent females, adjusting for race and smoking. Butylparaben was not associated with increased TSH or T3 levels for adolescent or adult females. TSH levels for Mexican American adult females were higher than the average of all racial/ethnic groups, adjusting for butylparaben, smoking, and race. TSH levels for other Hispanic adolescent females were higher than the average of all racial/ethnic groups, adjusting for butylparaben, smoking, and race. T3 and T4 levels for other Hispanic adolescent females were lower than the average of all racial/ethnic groups, adjusting for butylparaben, smoking, and race. T4 levels for Non-Hispanic White adolescent and adult females were higher than the average of all racial/ethnic groups, adjusting for butylparaben, smoking, and race. Smoking and non-Hispanic Black race/ethnicity was not associated with changes in thyroid levels in any multivariate model. The adolescent female group for this study showed differing results to adult females. Among adolescent and adult females butylparaben, TSH, T3, and T4 variation was found among the race classifications. Smoking did not present an association to any of the thyroid hormone levels in adolescent or adult females. Though smoking did not show an association in either of the age groups, we did find weighted mean differences for TSH, T3, T4, and butylparaben among those who smoked and those who did not smoke as mentioned previously in the descriptive statistics section of the results.
To the best of my knowledge, two studies have been done to which I could compare some of my findings.10, 31 Koeppe et al. studied the association of urinary triclosan and paraben concentrations with serum thyroid measures using the same NHANES 2007-2008. His study included both males and females, and the use of paraben measures adjusted for creatinine in analyses. Calafat et al. studied paraben concentrations in NHANES 2005-2006. Koeppe et al. and Calafat et al. did not calculate geometric means of butylparaben due to high percentages of values below the LOD, while Calafat et al. did not conduct multivariate analysis due to high percentage of values below the LOD.
10, 41 The large amount of values below the LOD in my study may have created misrepresented
means for butylparaben. The only study to which I can compare my multivariate results is from Koeppe et al. The final regression models of Koeppe et al. included covariates, age, sex, BMI, and urinary creatinine. My study did not examine BMI or urinary creatinine. Creatinine levels are used to measure kidney function, and it was not clear why these measures were included in the analyses of
associations for T3 and T4 levels with increased levels of butylparaben. Among adolescent females no significant associations were found for T3 and T4 levels with increased butylparaben levels. Among adult females, evidence of an inverse association for ln-Free T3 levels with increased
butylparaben levels.10 My study used total T3 and T4, whereas, Koeppe et al. study used both free
and total T3 and T4. Lack of comparison between studies is due to differences in variables and models used for analyses.
Hollowell et al. studied serum TSH, T4, and thyroid antibodies from 1988 to 1994 in the NHANES III survey. This study found that TSH level among Hispanic blacks was lower than that of Hispanic whites, as well as T4 levels among Mexican Americans being higher than that of non-Hispanic Whites. 31 Hollowell et al. believed that environmental factors, such as, region, poverty status, and urban versus rural residence, may have been playing a role in differences between racial/ethnic groups.29 Differences in race/ethnic thyroid levels may also be due to the cultural
differences between race/ethnic groups, such as behaviors, beliefs, or traditions.My study also found
many race/ethnic groups associated with changes in thyroid hormone levels. It is unclear why race is
associated with changes in thyroid levels.A study by McLeod examining thyroid-related disease
among U.S. military personnel from 1997 to 2011, found thyroid levels varied across race groups. McLeod was uncertain on whether the racial differences were caused by genetics, environmental
exposure, or a combination of both. 81 Future analyses should account for environmental factors such
as region, poverty status, SES, urban vs. rural location, as well as cultural differences.
Meeker et al. studied urinary concentrations of parabens and serum hormone levels, semen quality parameters, and sperm damage from fertility clinic data. They found no evidence for an association between parabens (methylparaben, propylparaben, and butylparaben) with altered hormone levels or
semen quality parameters.11 They also found that increased levels of butylparaben were associated
with sperm DNA damage. BMI of participants was associated with higher levels of parabens concentrations, possibly due to an increase to exposure.
While few human studies have found associations for change in thyroid hormone levels from
increased levels of butylparaben10, several rodent studies have found associations for estrogenic
effects of increased butylparaben.4, 6, 19, 54 Rodent effects of butylparaben exposure included birth
defects, uterotrophic capacity, reproductive toxicity, and developmental toxicity. A list of studies finding estrogenic effects from butylparaben exposure can be found in the appendices. A rodent study by Daston, found no effects of butylparaben on development, while it did produce maternal
toxicity in rats at exposure doses up to 1000mg/kg/day.56 A rodent study by Hossaini et al. found a
lack of estrogenic effects from butylparaben exposure to mice.21 Conflicting results can be seen
among rodent studies, some find estrogenic effects while others find a lack of estrogenic effects. It is important to look at if/how the rodent study results could be applied to humans. Some may argue
5a. Strengths
The use of a nationally representative study increases the generalizability of the results. To my knowledge, this is the first study to investigate butylparaben level associated with thyroid hormone levels (TSH, T3, T4) in a female only study design. Exclusion of pregnant women, women taking birth control, as well as women with thyroid problems help to limit confounding effects of known thyroid increasing properties. Stratifying analyses by age groups, adolescent’s age 12 to 19 years and adults age 20 years and over helped to reduce bias due to differing thyroid activity in younger and older ages.
5b. Limitations
The lack of associations in the adolescent female age group may have been due to the smaller sample size. The adolescent female sample size was only 151 whereas the adult female sample size was much large at 663. It is also possible that adolescents excrete lower levels of thyroid hormones and are therefore more difficult to detect associations in thyroid levels. Among adolescent females 66 (39%) participants had butylparaben levels below the limit of detection (LOD), while adults had 256 (36%) participants with butylparaben levels below the LOD. As described in the methodology section butylparaben levels below the LOD would be replaced with the LOD divided by the square root of two (0.14). For both adolescent and adult females, butylparaben levels below the LOD made up the largest percentages of values; this may have been the reason for the skewness of the
butylparaben variable. Causation cannot be established due to the use of data from NHANES, an observational, cross-sectional study. Butylparaben was measured using a spot urine test. Parabens are known to have a short half-life, however three recent studies show that timing of the urine spot test do not affect the accuracy of paraben representation.41, 82, 83
5c. Future Study
It is still debated whether parabens are endocrine/thyroid disruptors. As of now, parabens are not considered endocrine disruptors, yet some studies have shown associations of parabens with changes in thyroid hormone levels. Studies are needed that explain the absorption and metabolism of
A randomized controlled study (RCT) could be used to study the cause of thyroid differences in race/ethnicities.
5d. Conclusion
In conclusion, the present analysis examined the relationship between butylparaben and thyroid hormone levels among a female only study design using a large, representative sample of the U.S. adolescent and adult female population. NHANES data from 814 females aged 12 and over who were not pregnant, not taking birth control, and did not have thyroid problems increased the
generalizability of findings. I observed significant association between butylparaben and decreases in T4 thyroid hormone levels among adult females, as well as several associations both positive and negative between race categories and thyroid hormone levels in adolescent and adult females. While parabens are currently not considered endocrine disruptors, the human metabolism of and affects from exposure to parabens are not well understood. Results from this study showed decreased levels of T4 thyroid hormone levels associated with increased levels of butylparaben, as well as differences in thyroid hormone levels among racial/ethnic groups. The results of this study indicating no
statistically significant association between butylparaben and decreases in thyroid hormone levels are consistent with results of some rodent studies finding a lack of estrogenic effects of parabens. 9,
20, 54 Although not many human studies have found significant results, 10 some rodent studies have
References
1. Marty, M., Carney, E., & Rowlands, J. (2011). Endocrine Disruption: Historical Perspectives and Its Impact on the Future of Toxicology Testing. Toxicological Sciences, 120(S1), S93-S108.
2. Colborn, T., Dumanoski, D., and Myers, J. P. (1996). In Our Stolen Future. Are We
Threatening Our Fertility, Intelligence and Survival?—A Scientific Detective Story. Penguin Books USA, New York.
3. Colborn, T., vom Saal, F. S., and Soto, A. M. (1993). Developmental effects of
endocrine-disrupting chemicals in wildlife and humans. Environ. Health Perspect. 101, 378–384.
4. Hunter, D. J., and Kelsey, K. T. (1993). Pesticide residues and breast cancer: the harvest of a
silent spring? J. Natl. Cancer Inst. 85, 598–599.
5. Routledge, E., Parker, J., & Odum, J. (1998). Some Alkyl Hydroxy Benzoate Preservatives (Parabens) Are Estrogenic. Toxicology and Applied Pharmacology, 153, 12-19.
6. Byford, J., Shaw, L., Drew, M., Pope, G., Sauer, M., & Darbre, P. (2002). Oestrogenic
activity of parabens in MCF7 human breast cancer cells.The Journal of Steroid Biochemistry
and Molecular Biology,80, 49-60.
7. Oishi, S. Effects of butylparaben on the male reproductive system in rats. Toxicol. Ind.
Health, 2001; 17 (1): 31-39.
8. Gazin, V., Marsden, E., Briffaux, J. Propylparaben-8- week post-weaning juvenile toxicity
study with a 26-week treatment-free period in the male Wistar rat by the oral route. US
Society of Toxicology Meeting, 2012; Abstract No. 2359.
9. Hoberman, A.M., Schreur, D.K., Leazer, T., Daston, G.P., Carthew, P., Re, T., Loretz, L.,
Mann, P. Lack of effect of butylparaben and methylparaben on the reproductive system in male rats. Birth Def. Res., 2008; 83, 128-33.
10.Koeppe, E., Ferguson, K., Colacino, J., & Meeker, J. (2013). Relationship between urinary
triclosan and paraben concentrations and serum thyroid measures in NHANES 2007–
2008. Science of the Total Environment,15, 299-305.
11.Meeker, J., Yang, T., Ye, X., Calafat, A., & Hauser, R. (2011). Urinary Concentrations of
Parabens and Serum Hormone Levels, Semen Quality Parameters, and Sperm DNA
Damage. Environmental Health Perspectives,119(2), 252-257.
12.Janjua, N., Mortensen, G., Andersson, A., Kongshoj, B., & Wulf, H. (2007). Systemic
Uptake Of Diethyl Phthalate, Dibutyl Phthalate, And Butyl Paraben Following Whole-Body Topical Application And Reproductive And Thyroid Hormone Levels In
Humans. Environmental Science & Technology,41, 5564-5570.
13.Diamanti-Kandarakis, E., Bourguignon, J., Giudice, L., Hauser, R., Prins, G., Soto, A., ... Gore, A. (2013). Endocrine-Disrupting Chemicals: An Endocrine Society Scientific Statement. Endocrine Reviews,30(4), 293-342.
15.Taxvig, C., Vinggaard, A., Hass, U., Axelstad, M., Boberg, J., Hansen, P., Nellemann, C.
(2008). Do Parabens Have the Ability to Interfere with Steroidogenesis? Toxicological
Sciences,106, 206-213.
16.Vo, T.T., Yoo, Y.M., Choi, K.C., Jeung, E.B. (2010). Potential estrogenic effect(s) of
parabens at the prepubertal stage of a postnatal female rat model. Reprod Toxicol. 29;
306-16.
17.Butylparaben. PubChem Compound; NCBI. (n.d.). Retrieved September 13, 2014.
18.U.S. Food and Drug Administration. (2006, March 24). Retrieved August 14, 2014.
19.Błędzka, D., Gromadzińska, J., & Wąsowicz, W. (2014). Parabens. From environmental
studies to human health. Environment International,67, 27-42.
20.Boberg, J., Taxvig, C., Christiansen, S., & Hass, U. (2010). Possible endocrine disrupting
effects of parabens and their metabolites.Reproductive Toxicology,30, 301-312.
21.Hossaini, A., Larsen, J., & Larsen, J. (2000). Lack of oestrogenic effects of food
preservatives (parabens) in uterotrophic assays. Food and Chemical Toxicology,38, 319-323.
22.WHO (1974) Toxicological evaluation of some food additives including anticaking agents,
antimicrobials, antioxidants, emulsifiers, and thickening agents. WHO Food Additives Series
5. FAO Nutrition Meeting Report Series 53A.
23.Ashby, J. (2001). Testing for endocrine disruption post-EDSTAC: Extrapolation of low dose rodent effects to humans. Toxicology Letters, 120, 233-242.
24.Rastogi, S.C., Schouten, A., de Kruijf, N., Weijland, J.W. (1995). Contents of m,
ethyl-, propyl-ethyl-, butyl-ethyl-, and benzylparaben in cosmetic products. Contact Derm. 32: 28-30.
25.Dodson, R., Nishioka, M., Standley, L., Perovich, L., Brody, J., & Rudel, R. (2012). Endocrine Disruptors and Asthma-Associated Chemicals in Consumer
Products. Environmental Health Perspectives, 120(7), 935-943.
26.Rastogi, S.C. (2000). Analytical control of preservative labeling on skin creams. Contact
Derm. 43: 339-343.
27.Canosa, P., Perez-Palacious, D., Garrido-Lopez, A., Tena, M.T., Rodriguez, I., Rubi, E., et
al. Pressurized liquid extraction with in-cell clean-up followed by gas chromatography-tandem mass spectrometry for the selective determination of parabens and triclosan in indoor
dust. J Chromatogr A, 2007a; 1161:105-12.
28.Rudel, R.A., Camann, D.E., Spengler, J.D., Korn, L.R., Brody, J.G. Phthalates, alkyl
phenols, pesticides, polybrominated diphenyl ethers and other endocrine-disrupting
compounds in indoor air and dust. Environ Sci Technol, 2003; 37: 4543-53.
29.Liao, C., Lee, S., Moon, H.B., Yamashita, N., and Kannan, K. (2013). Parabens in sediment
and sewage sludge from the United States, Japan, and Korea: spatial distribution and temporal trends. Environ Sci Technol. 47 (19), 10895-902.
30.NTP. (2005) Butylparaben. Review of Toxicology Literature; National Toxicology Program:
Research.
31.Hollowell JG, Staehling NW, Flanders WD, et al. Serum TSH, T4, and thyroid antibodies in
32.Boas M, Feldt Rasmussen U, Main KM. Thyroid effects of endocrine disrupting chemicals. Mol Cell Endocrinol 2012; 355: 240-8.
33.Soni, M.G., Carabin, I.G., Taylor, S.L., Greenburg, N.A. Safety assessment esters of
p-hydroxybenzoic acid (parabens). Food Chem Toxicol, 2005; 43: 985-1015.
34.Bando, H., Mohri, S., Yamashita, F., Takakura, Y., & Hashida, M. (1997). Effects of skin
metabolism on percutaneous penetration of lipophilic drugs. Journal of Pharmaceutical
Sciences,86, 759-761.
35.Crinnion, W. (2010). Toxic Effects of the Easily Avoidable Phthalates and
Parabens. Environmental Medicine,15(3), 190-196.
36.Aubert, N., Ameller, T., Legrand, J.J. Systemic exposure to parabens: pharmacokinetics,
tissue distribution, and excretion balance and plasma metabolites of methyl-, propyl-, and
butylparaben in rates after oral, topical, or subcutaneous administration. Food Chem Toxicol,
2012; 50: 445-54.
37.Darbre, P., & Harvey, P. (2008). Paraben esters: Review of recent studies of endocrine toxicity, absorption, esterase and human exposure, and discussion of potential human health risks. Journal of Applied Toxicology, 561-578.
38.Ishiwatari, S., Suzuki, T., Hitomi, T., Matsukuma, S. Tsuji, T., et al. Effects of
methylparaben on skin keratinocytes. J Appl Toxicol, 2007; 27: 1-9.
39.Harville, H.M., Voorman, R., Prusakiewicz, J.J. Comparison of paraben stability in human
and rat skin. Drug Metab Lett, 2007; 1: 17-21.
40.Scialli, A. (2011). Reproductive effects of the parabens. Reproductive Toxicology,32,
138-140.
41.Calafat AM, Ye X, Wong LY, Bishop AM, Needham LL. Urinary Concentrations of four
parabens in the U.S. population: NHANES 2005-2006. Environ Health Perspect 2010; 118: 679-85.
42.Ye X, Bishop AM, Reidy JA, Needham LL, Calafat AM. Parabens as urinary biomarkers of
exposure in humans. Enciron Health Perspect 2006; 114: 1843-6.
43.What are Endocrine Disruptors?| Endocrine Disruptor Screening Program | US EPA. (2011, August 11). Retrieved August 14, 2014.
44.Anawalt, B., Kirk, S., Shulman, D., & Feuer, M. (2013, May 1). An Introduction to the Endocrine System. Retrieved September 15, 2014.
45.Endocrine System Information. (2001, January 6). Retrieved September 15, 2014.
46.Test ID: T3 (Triiodothyronine), MedlinePlus Medical Encyclopedia. (n.d.). Retrieved August 14, 2014.
47.Thyroid Hormone Treatment. (2012, June 4). Retrieved September 15, 2014.
48.Test ID: T4, MedlinePlus Medical Encyclopedia. (2012, June 26). Retrieved August 14, 2014.