Munich Personal RePEc Archive
A discrete choice approach to model
credit card fraud
Pulina, Manuela and Paba, Antonello
Sassari University, Faculty of Economics, Economics Department
(DEIR), Sassari University, Faculty of Political Science, Economics
Department (DEIS)
April 2010
Online at
https://mpra.ub.uni-muenchen.de/20019/
A discrete choice approach to model credit card fraud
1Manuela Pulina ∗, Antonello Paba °
Abstract: This paper analyses the demographic, socio-economics and banking specific
determinants that influence the risk of fraud in a portfolio of credit cards. The data are from
recent account archives for cards issued throughout Italy. A logit framework is employed that
incorporates cards at a risk of fraud as the dependent variable and a set of explanatory
variables (e.g. gender, location, credit line, number of transactions in euros and in non euros
currency). The empirical results provide useful indicators on the factors that are responsible
for potential risk of fraud.
Keywords: credit card, fraud, demographic and socio-economics factors, logit modelling.
JEL Codes: D12, G21, C35.
1 Acknowledgements
. The authors thank the financial support provided by Fondazione Banco di Sardegna, Prot. 1110/2009.0120.
Corresponding author. Ph.D. Southampton University (UK). Researcher at Centro Ricerche Economiche Nord e Sud
(CRENoS) and Department of Economics (D.E.I.R.), Università di Sassari, Via Torre Tonda, 34, 07100 Sassari, Italy, Tel. +39 (0)79 2017412, Fax +39 (0)79 2017312. E-mail: mpulina@uniss.it
° Professor in Economics. Department of Economics, Institutions and Society (D.E.I.S.) Università di Sassari, Piazza
Introduction
The current global recession is highlighting the fragility of the global banking and
finance system that is subject to greater risk and acts of fraud. There are new challenges in
tackling fraud stemming from a fast changing information technology environment, where
the internet has become one of the most important channels for the retail sector. Kageyama
(2009) reports that in the past three years more than 900 companies surveyed at a worldwide
level have lost an average of 8.2 billion dollars a year, a 22% increase with respect to the
previously published research. Moreover, the percentage of firms that registered at least one
fraud in 2008 has reached 85% that is an 80% increase on the previous year. While these
figures hide the motivation for fraud, the rates of growth are significant and in a time of
recession this rate is more likely to increase as higher numbers of individuals commit fraud
(Abbey, 2009).
In 2005 the worlds two largest credit card circuits, Visa and MasterCard, reported 1.14
billion dollars of fraud losses that represented a 62.9% increase with respect to 1995. In the
United Kingdom for example credit card fraud is one of the fastest growing crimes and in
2008 total card fraud losses amounted to more than 609 million pounds, of which 52.5
million was attributed specifically to online banking fraud (Association for Payment Clearing
Services, 2009). Arguably, these high amounts can be partially be explained by the high
volume of transactions and remarkable growth in credit cards ownership over the past three
decades. Visa (2003) calculates a 10% year on year compound growth since cards were first
issued. The USA for instance denotes the highest number of issued cards (more than 1.5
billion) and each inhabitant owns on average more than 5 payment instruments. In Europe
fraud losses are driving increasing efforts in both the detection and prevention of fraud and
the implementation of robust risk management practices in the credit card industry.
In this paper credit card fraud is defined as “the misuse of a card – without authorisation
or unapproved purchases – or the counterfeiting of cards” (Wells, 2007). The motivation and
opportunity behind credit card fraud are many and varied. Traditional types of fraudulent
behaviour such as identity theft relate to family members or people that can easily access
individual’s mail and personal information and committing fraud either by applying for a
card or taking over the existing account. Dumpster diving or trashing, where criminals raid
rubbish bins to search for credit card details and other sensitive information is becoming
more widespread. Lost or stolen credit cards may also be used fraudulently. Skimming of
the magnetic stripe is also still practiced either using highly sophisticated devices embedded
in ATM’s or POS or using simple hand held skimmers capable of storing magnetic stripe
data.
Internet enabled fraud is also growing; phishing attacks continue to harvest credit card
users’ details and compromised computer with key loggers provide organised criminals with
the card details. As the vast majority of all credit card transactions are now authorised and
cleared on-line, hacking into the e-payment chain to intercept data can harvest many millions
of card details. The e-fraud market has grown. Criminals are now provided with various
internet resources to counterfeit credit cards, examples are tipping, custom embossing,
decoding machines as well as software such as Creditmaster. A common practise is also that
of phishing where fraudulent emails hijacking brand name of banks, credit cards companies,
(etc.) are sent aimed at acquiring trickily financial data, account usernames and passwords.
Organised crime are normally composed by professional criminals that are setting “carding
forums” where it is possible to buy wide-scale global stolen personal and financial
purchase goods and services often involves thousands and even millions of victims (Peretti,
2008). Indeed credit card fraud is subject to technological enhancement and it is in a
continuous evolution.
However, due the lack of statistical information on fraud - MasterCard for example is the
only international circuit that provides statistical information on credit card fraud - few
microeconomics studies are available in this field. The purpose of this paper is to analyse the
demographic, socio-economics and banking-specific determinants that influence the risk of a
credit card fraud. The empirical investigation is based on a unique dataset containing
approximately 320,000 observations from a recent credit card portfolio issued in Italy. In
2004, MasterCard reported that the percentage of fraud in all European countries was
approximately 0.07% of card holder expenditure while in Italy this figure was 0.05% (Affari
& Finanza, 2009). The Association for Payment Clearing Services (APACS, 2009) reports
that at a worldwide level Italy is one of the top five countries to have seen an increase in the
use of fraudulent UK credit cards. Fraud on UK-issued cards being used in Italy has
increased by 72.9% since 2005, to £8.3 million in 2008.
For the portfolio of cards under study, the empirical analysis is performed on the risk of
fraud across three product categories that are classic, gold and revolving. The econometric
approach is based on a logit framework, where the probability that a given credit card
experiences a fraud is estimated. The dichotomous dependent variable is regressed on a set
of explanatory variables (e.g. gender, location, outstanding balance, number of transactions
in euros and non euros). The empirical results provide useful indicators on the factors that are
likely to influence fraud events based on the available sample. Hence, this framework offers
not only a microeconomics perspective to analyse the risk of a fraudulent behaviour but most
importantly an approach to help risk managers in fraud prevention by providing insight into
The paper is organised as follows. In the next section, a literature review on credit cards
fraud is provided. In the third section the methodology employed is highlighted. In the fourth
section, main empirical results are provided and concluding remarks are given in the last
section.
A literature review in credit card fraud
Fraud literature, that first appeared in the 1980s, treated a wide range of economic
activities such as insurance fraud (Dionne, 1984; Clarke, 1989; Artís, Ayuso and Gillén,
1999; Caudill, Ayuso and Gullén, 2005; Boyer, 2007), medical fraud (Pontell, Jesilow and
Geis, 1982; Feldman, 2001; Rai, 2001) and accounting fraud ( Beasley, 1996; Gerety and
Lehn, 1997; Sadka, 2006; Crutchley, Jensen and Marshall, 2007). Though fraudulent
behaviour has been analysed in financial markets (particularly for securities, bankruptcy and
money laundering), very few studies exist on credit card fraud.
One of the first papers that appeared in the law and criminology literature on credit card
fraud (Caminer, 1985) emphasised the need to allow authorities greater access to issuer
records and to the USA federal government to devote greater resources to the investigation of
credit card fraud. Hence, since the 80’s there has been the belief that credit card fraud was
increasing at an astounding rate and losses were borne by customers themselves. It is
interesting to note that in Italy over 20 years after the Caminer’s appeal, all card issuers are
obliged to report all credit card fraud into a central database (Decreto, 2007).
As Bolton and Hand (2002) point out, it is important to distinguish between fraud
prevention (that is measures to stop fraud occurring in the first place) and fraud detection
(that is measures to identify as quickly as possible fraud once it has been perpetrated). Very
few studies analyse how to prevent fraud occurring in the first place. Masuda (1993) for
that program initiatives and an industry-wide action with the exchange of fraud-related
intelligence data amongst regional and national authorities seem to be the key to reduce
credit card fraud. Williams (2007) presents a case study of credit card fraud in Tobago and
Trinidad, new entry countries into the credit card market, in which a prevention activity can
be improved by issuing specific laws, educating and informing the public of the various
fraudulent typologies and enhancing the critical role of the banking associations in
formulating ad hoc principles and policies to control this type of crime. Barker, D’Amato
and Sheridon (2008) describe numerous schemes and techniques and give additional
However, detection and prevention cannot be always regarded as distinct actions. To a
certain extent it is possible to learn from the past fraud patterns in order to prevent similar
cases occurring in the future. To this aim, several statistical techniques are available such as
linear regression, classification trees, naïve Bayes, neural networks and self-organising maps
(SOM) that builds on the clustering capabilities of neural networks (Thomas, Oliver and
Hand, 2005). These techniques are aimed at discriminating if a new credit card transaction
belongs to the genuine set or to the fraudulent set. More recently, Quah and Sriganesh (2008)
propose a real-time fraud detection and present a new approach to analyse card owners’
behaviour for detection of fraud.
In the literature, a commonly used technique to detect credit fraud is logistic regression.
Such an econometric tool, together with the above mentioned techniques, is mostly employed
within the credit scoring process to help institutions and organisations decide whether to
issue credit to consumers who apply for it (Desai, Crook and Overstreet, 1996; Greene, 1998;
Thomas, 2000; Crook and Banasik, 2004).
From the present literature review, it emerges that empirical studies are mainly concentrated
(such as a credit card or loan). However, very few papers employ microeconomics bank data
to analyse the factors that influence the risk of fraud in a portfolio of credit cards. In a recent
study, Hartmann-Wendels, Mählmann and Versen (2009) make use of a sample of
approximately 200 thousand observations, on successful applicants from a German
internet-only bank, to analyse what factors do affect fraud. The main finding is that fraud risk is
highly influenced by determinants such as gender, civil status, age, occupation an
urbanisation. Above all, nationality matters as foreign customers are 22.25 times more likely
to perpetrate a fraud than nationals. Hence, the present paper aims at expanding this strand
of research, providing new evidence on the main factors affecting the risk of fraud within the
Italian credit card market, through the analysis of an extensive credit card data set at a
microeconomics level.
Methodology
Definitions and data
The empirical model presented in this study makes use of banking microeconomics data
on the risk of fraud occurring on three types of credit cards Classic, Gold and Revolving. A
credit card can be defined as a payment instrument that may be employed to purchase goods
and services and, where offered by the issuer, to borrow money on credit. Credit cards can be
divided into their respective target segments that are mass market, premium, business and
revolving. Mass market credit cards, sometimes referred to as “classic cards”, are well-spread
worldwide and usually have a set of basic characteristics; a relatively limited availability to
spend, point-of-sale (POS) and automated teller machines (ATM) functionality, low or no
annual fees and limited add on services as insurance and loyalty programmes. Premium
credit cards, marketed under brands such as “gold”, “premium” and “diamond” are generally
can be thought of as a more sophisticated classic card. Premium cards are characterised by
higher joining and annual fees, higher spending and daily cash withdrawal limits as well as
extra services such as travel insurance, roadside assistance, hotel and car-rental advantages.
A minimum set of services is mandatory by the international circuit although the issuer is
free to customise the product. The business segment is a vast generic segment of customers
that includes sole traders and international corporations but, independently of company size,
the business card must be used exclusively for business transactions as mandated in the card
contract.
Cards issued in the mass market, premium and business segments typically require that
the balance be paid off in full at the end of the billing cycle. The revolving card is often
similar to the classic card but allows the card owner to spread the payment over a series of
billing cycles usually paying interest. Unlike the other segments, the revolving segment
contains customers who have a need to borrow or are happy to control the way the debt is
repaid in exchange for an interest payment.
In the present study gold, classic and revolving segments are analysed. The data are
collected from recent account archives (January 2007-December 2008) for bankcards issued
throughout Italy. The cards were issued on both the Visa and MasterCard circuits. Overll,
317,231 thousand card positions are analysed.
It is important to note that this paper employs data on every individual whose application
for the card was accepted. Clients with a poor credit history are not accepted. This is
particularly true for the revolving credit cards that are subject to stricter credit acceptance
rules applied by the bank. Hence, in this circumstance, it is possible that the use of ex post
selected data leads to biased estimates of the probability to acquire a given payment
instrument. This issue is not uncommon in the literature as seen in other academic studies.
make use of a sample of successful applicants from a German internet-only bank, to analyse
which factors affect fraud. Hence, even factors that do not explicitly enter into the acceptance
scoring process, but are at the same time correlated with the variables in the fraud equation
may cause biased predictions. Nevertheless, the findings emerging from actual data on
successful applications can shed light on understanding potential fraudulent behaviour in
credit markets. Besides, from the bank’s perspective understanding determinants of fraud risk
for the existing customer portfolio is important to risk managers who have to detect, control
and prevent credit card fraud.
The dependent variable used in the binomial logit model is risk of fraud where risk of
fraud is defined as a situation where there is risk of or actual evidence of unauthorised use of
a credit card or its details. These include also cards that are reported as stolen that are at risk
of fraud.
Following the empirical study cited in the previous section, a set of explanatory variables
are also included in the model, as follows:
• Gender (gen) - This dichotomous variable takes the value one if female, zero if male.
• Location (loc)- These dummy variables take into account the residence of the card
holder by macro geographical zone in Italy as defined in Table 1.
• Circuit (cr)– This dummy variable takes one as a value if the card has been issued by
the first circuit and zero by the second circuit.
• Ownership or “holder” (hl)– This dummy variable takes the value one if the credit
card has been issued for a secondary owner and zero otherwise.
• Outstanding balance (ob) – The outstanding balance is the sum of all expenditure
and charges on the card less the amounts paid. For revolving cards this translates into what
cards it is what the customer actually pays at the end of the month. Within the sample, the
maximum value is 20,062 euros, while the minimum value is zero euros.
• Number of transactions in euros (nteu) – The number of transactions in euros.
Within the sample, the minimum value is zero, while the maximum value is 87 transactions.
• Number of transactions in non-euros (ntneu) – The number of transactions in a
foreign currency rather than euro. Within the sample, the minimum value is zero, while the
maximum value is 58 transactions.
• Credit line (cl)– This is a continuous variable that accounts for the amount of the
spending limit of the card. Within the sample, the minimum value is 1,000 euros, while the
maximum value is 50,000 euros.
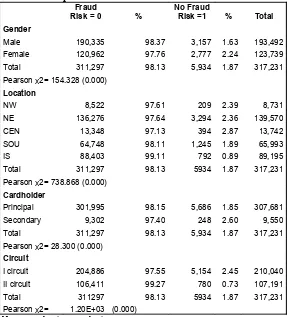
Table 2 provides a statistical description of the dichotomous variables under investigation.
The Pearson χ2 statistics tests for the null hypothesis that the distribution of fraud case does
not differ across the categories of the variable. Hence, the result is that all the variables are
highly dependent with the risk of fraud.
The model specification
The aim of the empirical analysis is to estimate the probability that a given type of credit
card experiences a risk of fraud. This framework is made operational by using a particular
distribution for the disturbances, that is a logit model within a discrete choice structure
(Greene, 2003). Formally, a vector of dependent variables is observed Yi, = (Y1, Y2).
Specifically, if a customer is characterised at risk of fraud (either where the customer is the
fraudster or is a victim of fraud), and hence a given credit card is at a fraud risk, Yi takes the
value one; likewise, if customer i belongs to the genuine set, and hence a given credit card is
one regime to another, probabilities (P) change leading to a new index (I). In analytical terms: ) 6 ( ) ( 1 ) | 1 ( ) 5 ( ) ( ) ( ) ( 0 ) ( ) 0 ( ) 1 ( ) 4 ( 0 1 ) 3 ( 1 0 1 0 1 0 1 0 1 0 1 0 1 0 1 0 i X X i X i i i i i i i i i i i i i X e e X Y P X F dt t f P X P X P I P Y P I if Y X I i i i β β β β β β ε ε β β ε β β β β β β β β + Λ = + = = + = = = − − > = > + + = > = = > = + + = + + + ∞ −
∫
that is the probability of a fraudulent action is assumed to be a function of customers’
behaviour and a set of determinants (age, location, credit line, etc.) defined as Xi;β0 and β1
are the parameters to be estimated; e is the logistic functional form that allows one to ensure
that the estimated choice probabilities lie between zero and one; Λ is the cumulative logistic
distribution function. The logistic regression is estimated using maximum likelihood.
In discrete choice models, estimated coefficients cannot be interpreted in terms of
elasticity. Hence, marginal effects, that represent the impact of a one-unit change in the
explanatory variable on the dependent variable, ceteris paribus, can be also computed. In
analytical terms given the index I and the probability P:
) 8 ( ) ( ) 7 ( 1 0 1 0
∫
+ ∞ − = + + = i X i i i i dt t f P X I β β ε β βthen the marginal effect of changes in X on this probability is given by:
) 9 ( )
(β 0 β1 i β1
i
i f X
X P + = ∂ ∂
The marginal effect (ME) for dummy variables is computed by employing the means of all
the other variables. This gives an accurate measure of elasticity as if the dichotomy variable
were a continuous one (Greene, 2003). Regression results are reported in the second column
In the empirical literature, more often, the Relative Risk Ratio (RRR) is reported (see for
example Ardiç and Yüzereroğlu, 2006). This ratio is given by the exponential function of the
estimated coefficient (b) and it is reported in absolute terms:
RRR = exp (b) (10)
RRR also expresses the ratio of the probability of choosing one category over the probability
of choosing the reference category. In other words, for one unit change in one of the
explanatory variables, it computes how many percent the relative risk of choosing a given
category is with respect to the reference category change. Values above one indicate that
higher values of the explanatory variable increase the predicted probability of a given
category compared to the reference category. Coefficients less than one indicate the opposite.
Empirical findings
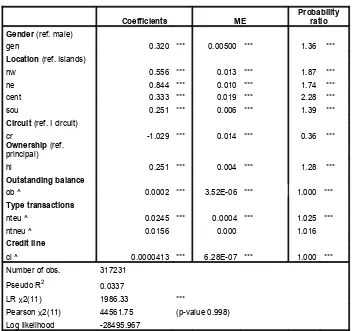
The main findings from the logit regression are reported in Table 3. With only one
exception, all of the coefficients are statistically significant at the 1% level. The overall
statistics indicate a well-specified model: the likelihood ratio test (LR(11)) show that the
coefficients of the explanatory variables are jointly statistically significant; the
Hosmer-Lemeshow goodness-of-fit test (that is Pearson χ2) fails to reject the null hypothesis that the
distribution fits the data.
Considering the first dichotomous variable gen (gender), the probability ratio indicates
women are 1.36 times riskier than men. This outcome can be interpreted in a number of
ways: women may be more likely to discover and report a fraudulent event than men; their
behaviour and spending patterns puts the card at a greater risk; women may commit more
fraud than men. As pointed out by Epaynews (2009), women are more likely to commit fraud
in mail order, communications and loans, whereas men fraudster in areas such as asset
Location turns to be an important factor in explaining risk fraud in credit cards.
Customers who are resident in the Centre of Italy are the riskiest category in comparison to
the reference one but also to the other geographical areas. The customers who are resident in
the South tend to show a relative lower risk.
The second circuit is affected only 36% by fraud risk and, hence, the first circuit has 2.75
times more probability to incur in a fraud. This finding is of a particular interest for banking
institutions that should closely consider banking specific features such as the security
standards for a given circuit. Besides, this result may also be explained by the risk propensity
of the pool of customers inherent to each of the circuits.
As an additional outcome, secondary card owners are significantly more likely to be at
risk of fraud (Table 3). In general, secondary card owners are close relatives of the primary
owner (e.g. partners, children); these individuals may be less aware of the various fraudulent
typologies and are more likely to be at risk.
Overall, the coefficients of the continuous variables (ob, nteu, ntneu, cl) are statistically
significant at the 1% level, with the only exception for ntneu. However, the effects on the
risk of fraud is very small, as highlighted by the marginal effects results. According to the
RRR for nteu and ntneu, the transaction in euros are slightly more risky than the non-euros
transactions.
Conclusions
In the credit market literature, only a few studies make use of banking data to analyse the
risk of fraud for a given set of credit cards (i.e. classic, gold and revolving credit cards). In
this paper, a logit analysis has been conducted to assess which factors may lead to the risk of
fraud. Fraud has been defined as an unauthorised use of a credit card, including card details,
have been employed for more than 300 thousand observations. Data were obtained from
recent account archives for bankcards issued throughout Italy. The model has focused on
socio-demographic as well as banking-specific factors influencing the probability to incur a
risk of fraud. Marginal effects and relative risk ratio have been computed. Overall, the
coefficients of the explanatory variables included in the model are statistically significant at
the 1% level.
The results have shown that the risk of fraud in credit cards is influenced by many
determinants: gender, location, type of circuit, card ownership, credit line and number of
transactions divided by currency. Women have been found to be riskier than men.
Geographic location also matters. The Centre of Italy denotes customers that are likely to
lead to a higher risk of fraud for the bank. Overall, the least risky geographical zone is the
Islands.
As a banking specific feature, transactions within the second circuit have denoted higher
standards of security with respect to the first circuit. Furthermore, risk managers should also
increase fraud prevention in transactions made by secondary owners who have been found to
be 1.28 times more risky than principal owner.
Though the coefficients of the continuous variables (ob, nteu, cl) are statistically
significant, the marginal effects on fraud risk are quite small. Overall, the transaction in euros
are slightly riskier than the non-euro transactions. The empirical findings show that an
increase in either the credit line or in the amount the client needs to pay at the end of the
billing cycle should not imply a higher risk.
This paper is a novel example of consumer finance research on fraud risk. A discrete
choice model has helped to systematically analyse the potential fraudulent behaviour within
the credit card market, where customers can be considered either as fraudsters or as victims.
and behaviour of their pool of clients and on the potential factors that may lead to fraudulent
actions. Bankers can employ actual positions to assess fraud risk and to discriminate
customers into the genuine set or the at risk set. Risk managers should also closely consider
banking specific features such as standards of security for a given circuit.
References
Abbey, R. (2009), `Perché in tempi di recessione aumentano i casi di frode? `Global Fraud
Report, Kroll, 8(4): 2.
Affari & finanza, (2009), `Clonazioni, truffe e furti d'identità: furbi in agguato `, available
online at http://guide-finanza.repubblica.it/carte-di-credito/893001/893046/rep (downloaded 18 June
2009).
APACS, (2009), `2008 fraud figures announced by APACS`, available online at
http://www.apacs.org.uk/09_03_19.htm (downloaded 25 August 2009).
Association for Payment Clearing Services, (2009), `Fraud the facts`, available online at
http://www.apacs.org.uk/resources_publications/documents/FraudtheFacts2009.pdf (downloaded 25
August 2009).
Ardiç, O. P. and Yüzereroğlu, U. (2006), `A multinomial logit model of bank choice: an
application to Turkey `,Research paper, ISS/EC-2006-02, Boğariçi University Department of
Economic Research Papers, 1--23.
Artís, M., Ayuso, M. and Guillén, M. (1999), `Modelling Different Types of Automobile
Insurance Fraud Behaviour in the Spanish Market `,Insurance: Mathematics and Economics,
24(1-2): 67--81.
Milano.
Barker, K. J., D'Amato, J., and Sheridon, P. (2008), `Credit card fraud: awareness and
prevention `, Journal of Financial Crime, 15(4): 398--410.
Beasley, M. S. (1996), `An Empirical Analysis of the Relation between the Board of Director
Composition and Financial Statement Fraud`,The Accounting Review, 71(4) 443--465.
Bolton, R. J. and Hand D. J. (2002), `Statistical fraud detection: a review`,Statistical Science,
17(3): 235--255.
Boyer, M. M. (2007), `Resistance (to fraud) is futile`,Journal of Risk and Insurance, 74 (2):
461--492.
Burns, P. and Stanley, A. (2002), `Fraud management in the credit card industry`, Discussion
paper, Payment Cards Center, April, Federal Reserve Bank of Filadelphia, 1--16.
Caudill, S., Ayuso, B. and Guillén, M. (1999), `Fraud detection using a multinomial logit
model with missing information`,Journal of Risk and Insurance, 72(4): 539--550.
Clarke, M. (1989), `Insurance Fraud`,British journal of Criminology, 29: 1--20.
Crook, J. and Banasik, J. (2004), `Does reject inference really improve the performance of
application scoring models? `,Journal of Banking & Finance, 28(4): 857—874.
Crutchley, C. E., Jensen, M. R. H., Beverly, B. and Marshall, B.B. (2007), `Climate for
Scandal: Corporate Environments that Contribute to Accounting Fraud `, Financial Review,
42(1): 53—73.
Decreto, (2007), `Istituzione di un sistema di prevenzione delle frodi sulle carte di
pagamento`, 30 aprile, n° 112.
Desai, V. C., Crook, J. N., Overstreet, J. G. A. (1996), `A comparison of neural networks and
linear scoring models in the credit union environment`, European Journal of Operational
Research, 95(1): 24--37.
Risk and Insurance-Issues and Practice, 9: 304--321.
Wells, J. T. (2007), Encyclopedia of fraud, Association of Certified Fraud Examiners, inc.,
Texas.
Epaynews.com, (2009), `Fraud figures reveal some interesting gender patterns`, available
online at http://www.epaynews.com/item.php?news_id=6474 (downloaded 10 September 2009).
Feldman, R. (2001), `An Economic Explanation for Fraud and Abuse in Public Medical Care
Programs`, Journal of Legal Studies, 30(2): 569--577.
Gerety, M. and Lehn, K. (1997), `The Causes and Consequences of Accounting Fraud`,
Managerial and Decision Economics, 18(7/8): 587--599.
Greene, W. (2003), Econometric analysis. Prentice Hall, Upper Saddle River: New Jersey.
Greene, W. H. (1998), `Sample selection in credit-scoring models`, Japan and the World
Economy, 10: 299--316.
Hartmann-Wendels, T., Mählmann, T. and Versen, T. (2009), `Determinants of banks’ risk
exposure to new account fraud– Evidence from Germany`, Journal of Banking & Finance,
33: 347--357.
Kageyama, J. M. (2009), `Nuovi rischi di frode per le aziende giapponesi: una lezione per
tutti`, Global Fraud Report, Kroll, 8(4): 3.
Masuda, B. (1993), Credit card fraud prevention. A successful retail strategy in crime
prevention studies. Volume 1. Edited by R.V. Clarke.
Pontell, H. N. and Geis, G. (1982), `Policing Physicians: Practioner Fraud and Abuse in a
Governament Medical Program`, Social Problems, 30(1): 117--125.
Quah, J. T. S. and Sriganesh, M. (2008), `Real-time credit card fraud detection using
computational intelligence`,Expert systems with applications, 35: 1721--1732.
Rai, A. K. (2001), `Health Care Fraud and Abuse: A Tale of Behaviour Induced by Payment
Sadka, G. (2006), `The Economic Consequences of Accounting Fraud in Product Markets:
Theory and a Case from the U.S. Telecommunications Industry (WorldCom)`,American Law
and Economics Review, 8(3): 439--475.
Thomas, L. C. (2000), `A survey of credit and behavioural scoring: forecasting financial risk
of lending to consumers`, International Journal of Forecasting, 16(2): 149--172.
Thomas, L. C., Oliver, R. W. and Hand, D. J. (2005), `A survey of the issues in consumer
credit modelling research`,Journal of Operational Research Society, 56: 1006--1015.
Williams, D. A. (2007), `Credit card fraud in Trinidad and Tobago`, Journal of financial
crime, 14 (3): 340—359.
VISA, (2003), Marketing. History of card products and acquiring. Visa International Service
Table 1 Geographical zones 1 0 0 0 0 is 0 1 0 0 0 sou 0 0 1 0 0 cent 0 0 0 1 0 ne 0 0 0 0 1 nw is sou cent ne nw dumm y variables 1 0 0 0 0 is 0 1 0 0 0 sou 0 0 1 0 0 cent 0 0 0 1 0 ne 0 0 0 0 1 nw is sou cent ne nw dumm y variables
NOTE. -- Standard definitions of geographical zones are employed (ISTAT, 2009); North West (nw), North East (ne), Centre (cent), South (sou) that is also use as the reference category,
Islands (is, Sardinia and Sicily). The locations of the cardholder is given by a mapping of their postal address zip code to geographical zone using tables produced by the Institute Post Office.
Table 2 Descriptive statistics of dichotomous variables
Fraud
Risk = 0 %
No Fraud
Risk =1 % Total
Gender
Male 190,335 98.37 3,157 1.63 193,492
Female 120,962 97.76 2,777 2.24 123,739
Total 311,297 98.13 5,934 1.87 317,231
Pearson χ2= 154.328 (0.000)
Location
NW 8,522 97.61 209 2.39 8,731
NE 136,276 97.64 3,294 2.36 139,570
CEN 13,348 97.13 394 2.87 13,742
SOU 64,748 98.11 1,245 1.89 65,993
IS 88,403 99.11 792 0.89 89,195
Total 311,297 98.13 5934 1.87 317,231
Pearson χ2= 738.868 (0.000)
Cardholder
Principal 301,995 98.15 5,686 1.85 307,681
Secondary 9,302 97.40 248 2.60 9,550
Total 311,297 98.13 5,934 1.87 317,231
Pearson χ2= 28.300 (0.000)
Circuit
I circuit 204,886 97.55 5,154 2.45 210,040
II circuit 106,411 99.27 780 0.73 107,191
Total 311297 98.13 5934 1.87 317,231
Pearson χ2= 1.20E+03 (0.000)
[image:20.595.84.371.360.677.2]Table 3 Logit regression results
Coefficients ME
Probability ratio
Gender (ref. male)
gen 0.320 *** 0.00500 *** 1.36 ***
Location (ref. Islands)
nw 0.556 *** 0.013 *** 1.87 ***
ne 0.844 *** 0.010 *** 1.74 ***
cent 0.333 *** 0.019 *** 2.28 ***
sou 0.251 *** 0.006 *** 1.39 ***
Circuit (ref. I circuit)
cr -1.029 *** 0.014 *** 0.36 ***
Ownership (ref.
principal)
hl 0.251 *** 0.004 *** 1.28 ***
Outstanding balance
ob ^ 0.0002 *** 3.52E-06 *** 1.000 ***
Type transactions
nteu ^ 0.0245 *** 0.0004 *** 1.025 ***
ntneu ^ 0.0156 0.000 1.016
Credit line
cl ^ 0.0000413 *** 6.28E-07 *** 1.000 ***
Number of obs. 317231
Pseudo R2 0.0337
LR χ2(11) 1986.33 ***
Pearson χ2(11) 44561.75 (p-value 0.998)
Log likelihood -28495.967