Performance Analysis of RFID Framed Slotted Aloha
Anti-Collision Protocol
Emad Felemban1,2
1
Simplicity Labs, Umm Al-Qura University, Makkah, KSA; 2Computer Engineering Department, Umm Al-Qura University, Makkah, KSA.
Ema
Received October 5th, 2013; revised November 2nd, 2013; accepted November 10th, 2013
Copyright © 2014 Emad Felemban. This is an open access article distributed under the Creative Commons Attribution License, which permits unrestricted use, distribution, and reproduction in any medium, provided the original work is properly cited. In accor-dance of the Creative Commons Attribution License all Copyrights © 2014 are reserved for SCIRP and the owner of the intellectual property Emad Felemban. All Copyright © 2014 are guarded by law and by SCIRP as a guardian.
ABSTRACT
In this paper, we develop a novel mathematical model to estimate the probability distribution function of the number of tags discovered after a certain number of interrogation rounds. In addition, the pdfs of the number of rounds needed to discover all the tags are also calculated. The estimation of such pdfs will be helpful in estimat-ing the number of interrogation rounds and the optimal parameter configuration of the RFID system which in turn will be helpful in estimating the time needed to discover all tags. Our results show that the proposed model accurately predicts the tags detection probability. We then use the proposed model to optimally configure the reader parameters (i.e. the frame size and the number of interrogation rounds).
KEYWORDS
Performance Modeling; RFID; Wireless Networks; Anti-Collision; Protocol
1. Introduction
In RFID systems with one reader and many tags, tag-to- tag collisions occur when multiple tags transmit their signals simultaneously to the reader. This problem is called tag collision and many tag anti-collision protocols have been proposed in the literature [1]. Many efficient an-ti-collision protocol adopted by different body standards [2] and commercial products are based on the classical Framed-Slotted Aloha. In framed slotted aloha based anti-collision protocols, the reader begins each interroga-tion round by informing all tags about the current frame size in terms of time slots. Each tag then selects a ran-dom time slot and sends its identifier in that time slot. The probability of tag collision depends on the frame size and the number of tags. Since not all tags can be identi-fied in the one round, the reader repeats the interrogation rounds until all tags are identified.
Many experimental [3] and mathematical performance analysis [4-6] of framed-slotted Aloha based anti-colli- sion protocols have been published in the literature to measure and estimate the performance of RFID systems
in terms of discovery delay and throughput. However in those previous models, an estimation of the number of rounds needed to discover all tags was not proposed yet. In this paper, we develop a novel mathematical model to estimate the probability distribution function of the num-ber of tags discovered after a certain numnum-ber of interro-gation rounds. In addition, the pdfs of the number of rounds needed to discover all the tags are also calculated. The estimation of such pdfs will be helpful in estimating the number of interrogation rounds and the optimal pa-rameter configuration of the RFID system which in turn will be helpful in estimating the time needed to discover all tags. The paper is organized as follows. Section 3 presents the system model used to develop the proposed mathematical model. The development of the two stages mathematical model is presented in Section 4. Parameter selection and optimization are presented in Section 5. Finally, the conclusion is presented in Section 6.
2. Related Work
extensively analyzed and modeled either as a communi-cation system or as an RFID anti-collision protocol. The most classical paper that provides an exact analysis of the framed slotted aloha communication system was written by Wieselthier and others [4]. The authors provided a combinatorial analysis of different variations of the pro-tocol including capture effects and dynamic frame slots allocation. By calculating all states of all users, the tech-niques provided in the paper could be used to calculate the throughput and other performance indicators.
Haralad Vogt [7] introduced a mathematical modeling for the Slotted Aloha protocol that is being used in RFID readers as an anti-collision protocol. Starting form a sim-ple occupancy problem, Vogt has calculated the proba-bility distribution function of the random variable that is equal to the number of slots in a frame that is being filled with exactly r tags. Kim etal. [8] have started with con-ditional probabilities and reached to the same recursive closed formula introduced by Vogt. The mathematical model introduced in [9] was based on simple probability calculations with approximated performance measure-ments.
Delgado etal. [10] utilized Vogt model [7] and mod-ified it to reflect the case of tag muting in RFID system. The algorithm is modeled by a Markov Chain of size N + 1 where N is the number of tags. The transition probabil-ities of the Markov Chain are then calculated using the model introduced by Vogt.
3. System Model
We assume an RFID network with one reader and n tags. Note that in real applications, the number of tags is usually unknown. For this, we assume the availability of a population estimation algorithm such as [11-13]. The reader selects the frame size s in terms of time slots and announces it to the tags. Each tag then, selects a random time slot to send its identification code. The reader iden-tifies the tags who selected unique time slots. Hence when at least two tags select the same time slot, a tag collision occurs. As a result, the involved tags will not be identified during that specific interrogation round. The reader continues the interrogation process for r rounds. In this work, once a tag is identified, it will be muted (i.e. the tag will not respond to the reader request) in the sub- sequent interrogation rounds. Also, we assume that frames have fixed sizes and no channel capture effect is assumed. We will relax these assumptions in our future work.
The allocation of tags to slots within a time frame is an example of a mathematical class of problems called the Occupancy Problems [14-17]. This class of problems studies the random allocation of a number of balls to a number of bins with different settings and objectives. Some examples of such problems include, estimating the number of empty bins, estimating the number of bins
containing only one ball and estimating the number of bins containing more than one ball.
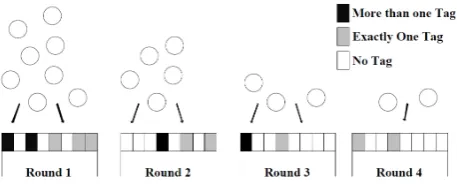
Reformulating the occupancy problem in terms of tags and slots, we are interested in finding the number of slots that contains one and only one tag. This means that the tags included in those slots were successfully identified by the RFID reader. Figure 1 shows an example of an interrogation process. In the first round, 8 tags were competing for 8 time slots. After selecting a random slot, three tags selected distinct time slots. The reader was able to recognize them. The other five tags selected one of two time slots and thus their messages collided. The reader needed 4 rounds to discover all the tags in this particular example.
4. Mathematical
The proposed mathematical model consists of two parts. First in 4.1, we calculate the probability mass function of the number of tags that can be identified in one round. Then in 4.3, we calculate the probability density function of the number of identified tags after r rounds. Addition-ally, the probability density function of the number of rounds needed to discover n tags can also be estimated. The notations used throughout the paper are summarized in Table 1.
4.1. Analytical Model for Slot Selection Mechanism
[image:2.595.310.539.491.583.2]To identify a tag during an arbitrary slot time “a” out of s slots in a round, exactly one tag out of n tags should se-lect that slot and transmit its identification code. Let us define slot “a” as a Discovery Slot. Then, the probability
Figure 1. Tags Allocation to time slots in multiple interro-gation frames.
Table 1. Notations.
Notation Description
n Number of tags
r Number of rounds
s Number of slots per frame
p(n, s) Probability that a slot is a discovery slot (i.e. only one tag has transmitted its ID)
m(n, s) Maximum number of tags that can be identified during single round
q1(n, s) Probability of identifying exactly one tag during a round
p(n, s) that an arbitrary slot is a discovery slot (i.e. ex-actly one tag transmits during that slot) can be given as
( )
( )
1 1 1, 1
1
n
n p n s
s s
− = −
, (1)
where, 1
s is the probability that a tag selects a random
slot out of s slots. Let us also define m(n, s) as the maxi-mum number of tags that can be identified during a sin-gle interrogation round given that there are n tags com-peting for s slots. Formally, m(n, s) can be defined as
( )
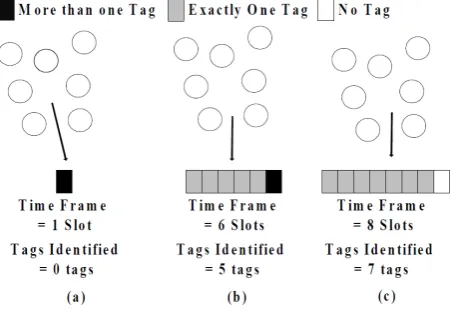
, 10 ifif 1. ifs
m n s s n s
n n s
=
= − >
≤
(2)
Defining m(n, s) is very important in case an exact analysis of the slotted Aloha operation is needed. The first line explains the case where only one time slot is used in the time frame. In that case no tag will be identi-fied because all of them will collide in that time slot. The second line explains the case where the number of tags is more than the number of slots. In this case, only (s− 1) tags could be identified while the remaining tags will collide in the remaining time slot. The last line represents the case where the number of tags is less than the number of time slots available in the frame. In that case, all tags could be identified. Figure 2illustrates the different cas-es.
Now, we can define the probability q1(n, s) of
identi-fying exactly 1 tag out of n tags during an interrogation round that consists of s slots is given as
( )
( ) (
)
1 , , 1, 1 ,
1
s
q n s = p n s l n− s−
(3)
[image:3.595.313.539.200.303.2]where l(n− 1, s− 1) is the probability that none of the remaining (s− 1) slots is a discovery slot. Alternatively,
Figure 2. Illustration of Equation (2). (a) Shows the case where s = 1 slot; (b) Shows the case where n > s; (c) Shows the case where n ≤ s.
l(n− 1, s− 1) can be defined also as the probability that none of the remaining (n−1) tags is identified during the remaining (s − 1) slots. The term p(n, s) is the probability of having an arbitrary discovery slot as defined in Equa- tion (1) and
( )
1s is the number of ways this arbitrary slot can be selected. The probability qi(n, s) ofidentify-ing i tags (1 ≤i≤m (n, s)) in one interrogation round can be calculated as
( )
(
)
(
)
1
0
1 if 1
0 if & 1
0 if 1 & 1 , , , Otherwise i i j n
n s i n
s n
q n s s
p n j s j i
l n i s i − = = ≤ = −
= >
= − − × − −
∏
(4) which, can be used to calculate the probability mass function of the number of tags that can be identified in one interrogation round.Finally, the probability l(n− i, s−i) is defined as the probability that none of the remaining (s − i) slots are discovery slots, or alternatively, it is the probability that no discovery slot exist among (s− i) slots and is calcu-lated as
(
)
(
)
( , )(
)
0 1 ,, 1 ,
m n i s i k k
l n i s i
q n i s i q n i s i
− −
= − −
= − − = −
∑
− − (5)4.2. RFID System Efficiency
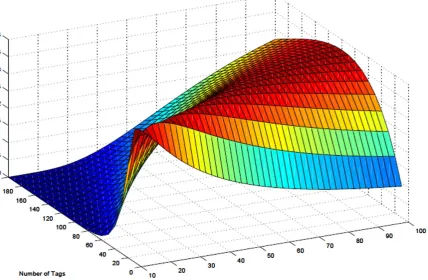
An interesting metrics to be measured for RFID systems is its efficiency which can be calculated as follows. The expected number of identified tags for each interrogation round can be calculated as follows
( )
( )
1 , , n i iE n s i q n s
=
=
∑
× (6)and the efficiency of the RFID system can then is calcu-lated as
( )
efficiency
Number of slots filled with one tat Number of slots in one frame Expected number of identified tags
Number of slots in one frame ,
E n s s
=
=
=
[image:3.595.61.288.546.701.2](7)
Figure 3. 3D Plot for number of tags vs. number of slots.
slots is equal to number of tags.
4.3. Analytical Model for Multiple Interrogation Rounds
Recall that from Equation (2), the RFID reader can only identify up to m(n, s) tags in one interrogation round. To estimate the probability that k tags are identified when the whole interrogation process ends (i.e., after r rounds), we must keep track of different possibilities that lead to identifying the k tags in r rounds.
For example, assume that tag A discovered 4 tags after 3 rounds of interrogation frames. Then, A might have discovered 1 tag in the first round, 0 tag in the second and 3 tags in the third round. On the other hand, it might have discovered 2 tags in the first round, one tag in the second and one tag in the third round.
To account for such possibilities, subsequent interro-gation rounds can be described as a two dimensional probability map with (n + 1) × r states as shown in Fig-ure 4. Each state (x, y) represents the probability that y
tags are identified up to and including the xth round. Any state (x, y) can only access states (x + 1, y), (x + 1, y+
1),∙∙∙ or (x + 1, min(y+ m(y, s), n)). The transition prob-abilities from states (x, a) to (x+ 1, b) are given by the probability mass of the number of identified tags in round
[image:4.595.312.539.407.543.2]x.
Figure 4. Two dimensional map for r rounds and n tags.
Note that the states’ probabilities are greatly dependent on the number of tags n and the number of slots s. In fact, the probability
( )
ns
b y of the state (x, y) given that there are n tags and s slots per round can be given as
( )
( )
( )
(
(
)
)
(
)
0
, if 1
, ,
1, if 1 .
y n n
s k
k n s
q n s x
b x y q n y k s
b x y k x r
=
=
= − −
× − − < ≤
∑
(8)Therefore, the probability distribution function of the number of tags identified after r rounds is given by cal-culating the probabilities (bsn
( )
r, 0 ,),( )
( )
4.4. Model Validation
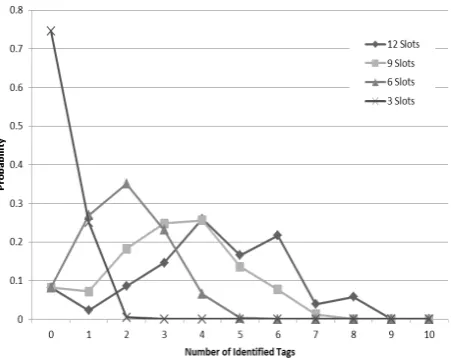
To validate the accuracy of our analytical models, we have implemented the slot selection mechanism in MAT-LAB and compared its result with the result obtained from the models presented earlier. Simulation results are averaged over 10,000 runs with different seeds. Figure 5
shows a comparison of the cumulative distribution function of the number of identified tags out of 10 tags using dif-ferent number of slots. As shown in the Figure, the mod-el matches perfectly with the simulation results. Figure 6
shows the cumulative distribution function of the number of identified tags using 4 slots in different number of rounds with similar accuracy.
5. Parameter Optimization
[image:5.595.62.288.312.491.2]The aforementioned multiple interrogation rounds model can be used to optimize the parameters of the RFID sys-
[image:5.595.60.291.531.708.2]Figure 5. CDF of the number of identified tags with 10 tags and different number of slots in one round.
Figure 6. CDF of the number of identified tags with 10 tags, 4 slots and different number of rounds.
tem. We are interested in finding the optimal system configuration that minimizes the discovery time such that probability that the reader misses at most one tag is less than a certain threshold ϵ. Each round r takes tr+ ts*s
seconds to finish where tr is the time to send the Hello
packet and ts is the slot duration. Then, the discovery
time can be calculated as
(
)
.d r s
t = ∗r t + ∗t s (9) We can represent this optimization problem as the fol-lowing linear program
(
)
Minimize
Subject To ,
r s
Miss
r t t s P
∗ + ∗
(10)
where PMiss is the probability of missing at least one tag
and can be computed using Equation (8) as follows
[
]
( )
1 tags are discovered in rounds 1 , .
Miss n s
P P n r
b r n
= −
− (11)
To solve this optimization problem, we propose a heu-ristic approach to find the optimal number of slots and rounds needed to discover all the tags with certain miss threshold. The approach sequentially iterates through all slot values starting from 2 slots to maxSlots slots. Then, for each number of slots, the approach finds the mini-mum number of rounds that satisfy the condition PMiss≤ ϵ
and minimizes the discovery time.
The algorithm Find Optimal Configuration (n, ϵ,
max-Slots, tr, ts) describes such approach.
6. Conclusion and Future Work
fu-ture work, we are planning to extend the model to dif-ferent varieties of the slotted frame aloha (i.e. non-mut- ing, variable frame size etc.).
Acknowledgements
This work is part of the REMONG project supported by the National Science, Technology and Innovation Plan, Saudi Arabia grants: NSTIP-10-ELE1238-10.
REFERENCES
[1] D. Shih, P. Sun, D. Yen and S. Huang, “Taxonomy and Survey of Rfid Anticollision Protocols,” Computer Com- munications 2006, Vol. 29, 2006, pp. 2150-2166.
[2] “Epc Global Class 1 Generation 2 Uhf,”
[3] M. Buettner and D. Wetherall, “An Empirical Study of Uhf Rfid Performance,” ACM MobiCom’08, 2008.
[4] J. Wieselthier, A. Ephremides and L. Michaels, “An Ex- act Analysis and Performance Evaluation of Framed Alo- ha with Capture,” IEEETransactionsonCommunication, Vol. 2, 1989, Article ID: 125137.
[5] D. Klair, K. Chin and R. Raad, “On the Suitability of Framed Aloha Based Rfid Anti-Collision Protocols for Rfid-Enhanced Wsns,” IEEEIC-CCN’07, 2007.
[6] L. Zhu and T. Yum, “Design and Analysis of Framed Aloha Based Rfid Anti-Collision Algorithms,” IEEEGlo- beCom’09, 2009.
[7] H. Vogt, “Efficient Object Identification with Passive RFID Tags,” Proceedings of Pervasive, 2002.
[8] J. Kim, W. Shin and J. Yoo, “Performance Analysis of EPC Class-1 Generation-2 RFID Anti-Collision Protocol,” ICCSA Springer, 2007.
[9] S. Lee, S. Joo and C. Lee, “An Enhanced Dynamic Framed Slotted ALOHA ALgorithm for RFID Tag Iden- tification,” ACMMobiQui-Tous’05, 2005.
[10] M. Delgado and J. Alonso, “On the Optimal Frame- Length Configuration on Real Passive RFID Systems,” JournalofNetworkandComputerApplications, 2010.
[11] Onat and A. Miri, “A Tag Count Estimation Algorithm for Dynamic Framed Aloha Based Rfid Mac Protocols,” IEEEICC’11, 2011.
[12] Z. Li, S. Guo, Y. Wang, Z. Yang and M. Zhang, “A Hy- brid Tag Number Estimation Scheme for Aloha Based Anti-Collision Algorithm in Rfid Networks,” ICACT’10, 2010.
[13] J. Eom and T. Lee, “Accurate Tag Estimation for Dy- namic Framed Slotted Aloha in Rfid Systems,” IEEE CommunicationLetters, 2010.
[14] N. Johnson and S. Kotz, “Urn Models and Their Applica- tions,” Wiley, 1977.
[15] V. Kolchin, B. Svast’yanov and V. Christyakov, “Ran- dom Allocations,” Winstons and Sons, 1978.
[16] R. Motwani and P. Raghavan, “Randomized Algorithms,” Cambridge University Press, 1995.