How to cite this paper: Bassey, B.E. and Andreyevich, L.K. (2016) On Analysis of Parameter Estimation Model for the Treatment of Pathogen-Induced HIV Infectivity. Open Access Library Journal, 3: e2603.
http://dx.doi.org/10.4236/oalib.1102603
On Analysis of Parameter Estimation
Model for the Treatment of
Pathogen-Induced HIV Infectivity
Bassey E. Bassey1*, Lebedev K. Andreyevich2
1Department of Mathematical and Computer Methods, Kuban State University, Krasnodar, Russia 2Department of Computational Mathematics and Informatics, Kuban State University, Krasnodar, Russia
Received 3 April 2016; accepted 18 April 2016; published 22 April 2016
Copyright © 2016 by authors and OALib.
This work is licensed under the Creative Commons Attribution International License (CC BY).
http://creativecommons.org/licenses/by/4.0/
Abstract
Multiplicity of new cases of HIV/AIDS and its allied infectious diseases daunted by lack of proper parametric estimation necessitated this present work. Formulated using ordinary differential eq-uation was a five-dimensional (5D) differential mathematical model with which compatibility of optimal control strategy for dual (viral load and parasitoid-pathogen) infectivity in the blood plasma was investigated. Discretization method indicated the incompatibility of the model due to large error derivatives. The study using numerical method established treatment set point with which we explored the variation of predominant model parameters and thereof investigated the maximization of uninfected healthy CD4+ T cell count as well as the de-replication of viruses
fol-lowing the consistent administration of reverse transcriptase inhibitor from set point. Presented was a series of numerical calculations obtained using well-known Runge-Kutter of order of preci-sion 4, in Mathcad platform. Analysis of simulated parameters showed that distortion of replica-tion viruses and de-transmutareplica-tion of susceptible CD4+ T cells by viruses via chemotherapy led to
restoration and gradual increase of healthy blood plasma, with near zero declination of both viral load and parasitoid-pathogen within chemotherapy validity time frame. The model was worthy in the study of treatment analysis of dual HIV—pathogen infection and thereof recommended for other related dual infectious diseases.
Keywords
Asymptomatic-Stage, De-Replication, Discretization, Infectivity, Mutation-Ability
Subject Areas: Mathematical Analysis, Numerical Mathematics, Ordinary Differential Equation
*
OALibJ | DOI:10.4236/oalib.1102603 2 April 2016 | Volume 3 | e2603
1. Introduction
Still a daunting hurdle for the scientists of infectious diseases is the unfounded clear medical literature for the absolute eradication of the human immune deficiency virus (HIV), a primary route of the dreaded disease called Acquired Immune Deficiency Syndrome (AIDS). In the circumstance, suppression and prevention of HI-virus and its associated infectious diseases have become an inevitable remedy in the annals of study into the cure for HIV/AIDS. Further hindrance to the achievable goals from both clinical trials and scientific researches is the multiplicity of new cases of HIV/AIDS and its affiliated infectious diseases.
The formulation and analysis of HI-virus and its allies significantly revolve round the parameters with which the models are formulated. Therefore, evaluation (or estimation) of the parameters is of paramount importance. Attempts in this direction by a number of researchers [1]-[6] include the use of 3-Dimensional (3D)—Ordinary Differential Equations (ODEs), with most models presented as optimal control problems. Visible constraints from outcomes of these works have been the indistinguishable nature of the infected CD4+ T cells from the un-infected CD4+ T cells [7].
In this present paper, we presuppose two infectious parasitoid-pathogenic induced HIV infections. The study is formulated as a 5-Dimensional (5D)—ODE model aimed at investigating the compatibility of optimal control strategy for the treatment of HIV and its allies of infections. Use as treatment factor is reverse transcriptase inhi-bitor (RTI) with the blood plasma (CD4+ T cells) as the prime host. Unlike several other studies conducted using 3-Dimensional differential equations, on a single HIV infection, the novelty of this present paper lies in the en-hance formulation of 5-Dimensional mathematical model, propose to investigate the parameter estimation of dual HIV—pathogen induced infection. Thus, the objective is in the investigation of the compatibility of optimal control strategy for the estimation of model parameters of dual HIV—pathogen infection. Therefore, the present work does not only accounts to establish the compatibility of application of optimal control in parameter estima-tion of dual infectious diseases but also, accounts for viral load de-replicaestima-tion and de-transmutaestima-tion of pathogen resistivity through varying of model parameters. The model explores numerical method via discretization tech-niques (method), with numerical illustrations using Range-Kutter of order of precision 4, in Mathcad platform.
Exceptional works on parameter estimations include: virus clearance rate and death rates of infected CD4+ T cells [2] [3]; the analysis based on the quasi-steady state of the asymptomatic period before it is disturbed by chemotherapy [8]. The model [1] investigated the optimal control strategy for a full determined HIV model aimed at clinical testing and monitoring of HIV/AIDS diseases. In that study, demonstrated was the CD4+ T cells measurement and viral load count, using reverse transcriptase inhibitor (RTI) as single treatment. Other notable models involving discretization methods for parameter estimations could be found in [6] [9] [10]. The deployment of highly antiretroviral therapy (HAART) regimen in the treatment and suppression of viral replica-tion and immune system recovery were studied by [5] [11] [12]. The study [13] had discussed on the impact of numerical stability of the treatment of vertical transmitted HIV/AIDS infections; while global convergence and impact of multistage and Padé techniques for iterative chain model were contained in [14].
The scope of this work is characterized by four subsections, which includes: introductory aspect as in Section 1. The material and methods of the model, which includes: System modalities as a problem statement, discreti-zation technique and model parameter variation constitute Section 2. Section 3 is covered by a number of nu-merical illustrations and discussion, while the last Section 4 is devoted to conclusion and recommended remarks. The study is anticipated to throw more insight to compatibility of optimal control strategy in 5D-model in the treatment of dual infectivity.
2. Material and Methods
We present in this section, the statement of the problem and model formulation followed by the discretization technique used, as well as model parameter variation of the system.
2.1. Problem Statement and Model Formulation
In our presupposition to study the compatibility of optimal control strategy for the treatment of dual HIV—pa- thogen induced infection; we bring to relation, ordinary differential equation in mathematical modeling, struc-tured as problem statement solvable possibly by discretization method.
OALibJ | DOI:10.4236/oalib.1102603 3 April 2016 | Volume 3 | e2603
Physiologically, we let Tu denote the uninfected CD4
+
T cells, Vv-HIV virus (viral load), Pp-parasitoid-
pathogen; then for virus-infected CD4+ T cells and pathogen-infected CD4+ T cells, we shall denote by I( )v and
( )p
I respectively. The biological description of the parameters with which these variables interact and its
cor-responding ODE’s are defined as inTable 1, thereof:
The differential equation of the model is derived as follows:
( ) ( ) ( ) ( ) ( ) ( ) ( ) ( ) ( ) ( ) ( ) ( ) ( ) ( ) ( ) ( ) ( ) ( ) ( ) ( )
(
)
( ) ( )(
)
1 2u p v p u u v u p
v u v v v
p u p p p
v v v
p p p
T b V P T T V T P
I T V I kI
I T P I dI
V kI c V
P dI e P
σ α µ β δ
β τ δ τ σ α = + + − − − = − − = − − = − + = − + (2.1)
and satisfying all the variables and parameters as defined inTable 2.
Biologically, Equations (2.1) assumed a relatively steady viral level during the asymptomatic stage of HIV and pathogen infection known as “set-point”. At this initial set-point, the body develops an immune system called, the innate immune system, which act as antibodies against HIV-infection and pathogen barrier preventing me-chanism. However, the replication of viral load and the rapid adaptivity of pathogen make it impossible for easy detection and subsequently neutralize this innate immune system, which then leads to gradual full blown AIDS
[1] [15] [16]. It is known that for most HIV patients, β ≠0 and τ <1 c, which also holds for δ ≠0 and
2 e
[image:3.595.95.535.386.718.2]τ < [4].
Table 1. Biological description of HIV—pathogenic infection model.
Biological description Interaction Reaction rate Translation to ODE
CD4+ T cells production. 0
u T
→ bp Tu=b Tp u+σVv+αPp
CD4+ T cells natural death. 0
u
T → µ Tu= −µTu
CD4+ T cells become infected by virus.
Rate at which virus attack CD4+ T cells.
( )
u v v v
T +V →I +V
( )
v u v v
V +T →V +I
β
σ
( )
u u v
u v v
T T V
I T V
β β = − = u v v v T V V V σ σ = = −
CD4+ T cells invaded by pathogen.
Rate at which pathogen invade CD4+ T cells.
( )
u p p p
T +P →I +P
( )
p u p p
P +T →P +I
δ
α
( )
u u p
u p p
T T P
I T P
δ δ = − = u p p p T P P P α α = = −
Death of virus infected CD4+ T cells.
( )v 0
I → τ1 I( )v = −τ1I( )v
Virus replication in infected CD4+ T cells. I( )v →I( )v +Vv k V= −kI( )v
Virus natural death. V→0 c Vv= −cVv−σVv
Death of pathogen infected CD4+ T cells.
( )p 0
I → τ2 I( )p = −τ2I( )p
Pathogen replication in infected CD4+ T cells.
( )P ( )P p
I →I +P d Pp= −dI( )p
OALibJ | DOI:10.4236/oalib.1102603 4 April 2016 | Volume 3 | e2603
Figure 1. Pictorial representation of HIV—pathogenic infection model.
Table 2. Variables and parameters values of optimal control for model (2.1).
Dependent variables Initial values
u
T Uninfected CD4+ T cells population.
V
I Viral load infected CD4+ T cells.
p
I Parasitoid-pathogen infected CD4+ T cells.
0.8/mm3
0.01/mm3
0.01/mm3
v
V HIV (viral load) population. 0.08/ml
P Parasitoid-pathogen. 0.07/ml
Parameters and Constants Values
p
b CD4+ T cells natural source production. 3 1
0.01 mm d⋅ −
µ Natural death rate of uninfected CD4+ T cells. 1
0.01 d−
1
τ Death rate of HI-virus infected CD4+ T cells. 3 1
0.02 mm d⋅ −
2
τ Death rate of P-pathogen infected CD4+ T cells. 3 1
0.02 mm d⋅ − k HI-virus replication in infected cells. 3 1
5 mm d⋅ −
d P-pathogen replication in infected cells. 3 1
5 mm d⋅ −
c HI-virus natural death rate. 3 1
0.1 mm d⋅ −
e Elimination (clearance) rate of P-pathogen. 3 1
0.02 mm d⋅ − σ Rate of CD4+ T cells infection by HI-virus. 3
0.2 mm
α Rate of CD4+ T cells infection by P-pathogen. 3
0.4 mm
δ CD4+ T cells invaded by pathogen. 3 1
0.5 mm d⋅ − β CD4+ T cells become infected by virus. 3 1
[image:4.595.136.539.363.715.2]OALibJ | DOI:10.4236/oalib.1102603 5 April 2016 | Volume 3 | e2603
Furthermore, it can be shown mathematically from Equation (2.1), that the amount of V( )v and Pp in the
set-point are given by the equilibrium of virus and parasitoid-pathogen depicted
i.e.
( )*
(
)(
( ))
( )(
)(
( ))
1 2
; .
p p
v p
kb db
V P
k c d e
µ µ
τ σ β ∗ τ α δ
= − = −
+ + + + (2.2)
Thus, model (2.1) adequately reflected the disease progression from initial infection to an asymptomatic stage
[5].
2.2. Discretization Technique
The discretization method which is aimed at estimating all the parameters of HIV and pathogen as involved in our basic model (2.1) is applied here. The method affords us the opportunity to transform and study the compa-tibility of equations as in model (2.1) into solvable discrete form. Clearly, with discretization method, we aim to estimate (or measure) all the twelve parameters in model (2.1). None-the-less, we shall deliberately omit the va- riables I( )v and I( )p at the set-point (initial stage) of our parameter estimation in view of the following
limita-tions:
1) The microscopically indistinguishable nature of infected cells from the uninfected cells which leads to de-velopment of state estimator is a factor [7].
2) Extreme high cost of quantification of these infected cells at the set-point is another factor [1].
3) The number of infected CD4+ T cells at the set-point is found to be too small (negligible) compared to the number of healthy CD4+ T cells [4].
4) At the set-point, treatments are certainly not administered from the first hour/day or even weeks of initial in-fection. Therefore, estimation of parameters starts with setting Iv=0 and Ip=0, to be able to obtain de-sired interval for drugs administration.
Therefore, we see from Equation (2.1) that the first and second derivatives becomes
( ) ( ) ( ) ( ) ( ) ( ) ( ) ( ) ( )
( ) ( )
(
( ))
( )( ) ( )
(
)
( )u p v p u u v u p
v v v v
p
p p p
T b V P T T V T P
V kI c V
P dI e P
σ α µ β δ
σ α
= + + − − −
= − +
= − +
(2.3)
which is the equation representing the progression of infection at the asymptomatic stage.
Equations (2.3) accounts for the model parameters without τ1 and τ2. Biologically, these clearly indicate that infection of CD4+ T cells by viral load and parasitoid pathogen (V( )v and P( )p ) at set point through asymp-tomatic stage are indistinguishable from healthy CD4+ T cells and are insignificant. Hence, the death rates (τ1 and τ2) of these viruses at set point and in the short period after chemotherapy treatment of the CD4+ T-cell count does not change significantly (see assumptions i, iii & iv). Therefore, the conditions τ <1 c and τ <2 e, given above is justified, [4] [5]. Surpassing the asymptomatic stage (or at symptomatic stage/chronic level) with
( ) ( )v,p 0
I ≠ , Equation (2.1), using Equation (2.3), becomes:
( ) ( ) ( ) ( ) ( ) ( ) ( ) ( ) ( )
( ) ( )
(
)
( ) ( ) ( )(
)
( ) ( ) ( )
(
)
( )( ) ( ) ( )
(
)
( ) ( )1
2
u p v p u u v u p
v
v v v
p
p p
v u v v
P u p p
T b V P T T V T P
V kI c V
P dI e P
I T V k I
I T P d I
σ α µ β δ
σ α
β τ
δ τ
= + + − − −
= − +
= − +
= − +
= − +
(2.4)
OALibJ | DOI:10.4236/oalib.1102603 6 April 2016 | Volume 3 | e2603
equations (containing many variables and model parameters) into a few numbers of indicators without loss of originality.
Achieving this, we rewrite Equation (2.4) by introducing new variables i.e. let y1=T( )u , y2=V( )v and ( )
3 p
y =P , y4 =I( )v,y5=I( )p and such that the twelve parameters in model (2.1) are denoted by the coefficients , 1, 2, ,12
i i
λ = . Then we have,
(
)
(
)
1 1 2 2 3 3 4 1 5 1 2 6 1 3
2 7 1 2 8 4 9 2
3 10 1 3 11 5 12 3
4 1 2 1 4
5 1 3 2 5
y y y y y y y y
y y y y y
y y y y y
y y y k y
y y y d y
λ λ λ λ λ λ
λ λ λ
λ λ λ
β τ δ τ = + + + + + = + + = + + = − + = − + (2.5)
This is to say that the coefficients of the original system can be expressed through the new coefficients as fol-lows:
1 2 3 4 5 6 5 12 9 2
7 4 8 5 7 11 5 7
1 2
5 5 7 5 10 5
; ; ; ; ; ; ; ;
; ; ; .
p p v
b e c
k d
λ σ λ α λ µ λ β λ δ λ λ λ λ λ
λ λ τ λ λ λ τ λ λ λ
λ λ λ λ λ λ
= = − = − = − = − = − = − − = −
⋅ ⋅
= = = − − = − −
Therefore, by discretization of Equation (2.5) and substitution of approximate values of the first derivative of
1
y , for CD4+ T cells; the first and second derivatives of y2 and y3 for viral load and pathogen; as well as the first derivative of y4 and y5 for infected CD4
+
T cells by viruses respectively, we can investigate the mea-surement of the variables at different time intervals. That is, having the experimental dependence of yi,
Equa-tion (2.5) can be written as the system of algebraic equaEqua-tions relative to the vector λ, i.e.
1
1 1
1 2 2 3 3 4 1 5 1 2 6 1 3, 0,1, , 5
i i
i i i i i i i
i
y y
y y y y y y y i
h λ λ λ λ λ λ
+ −
= + + + + + = (2.6)
Similarly, for a 3 3× matrices, we have
2 1 1 1
1 1 1
2 2 2 2 2 2
7 1 2 8 4 9
1 1
2 i i i i i i i i i
i i i i i
y y y y y y
y y y
h h h h λ λ λ h
+ + + +
+ + +
+ +
− − − = + + −
+ , i=0,1, 2 (2.7)
2 1 1 1
1 1 1
3 3 3 3 3 3
10 1 3 11 5 12
1 1
2 i i i i i i
i i i
i i i i i
y y y y y y
y y y
h h h h λ λ λ h
+ + + + + + + + + − − − − = + +
+ , i=0,1, 2 (2.8)
In matrix form, taking Equation (2.6), we have,
1 0 1 1
0 2 1 0 0 0 0 0 0 0
1 2 3 1 1 2 1 3 1 1 1 1 1 1 1
2 2 3 1 1 2 1 3 2 2 2 2 2 2 2
3 2 3 1 1 2 1 3 3 3 3 3 3 3 3
4 2 3 1 1 2 1 3 4 4 4 4 4 4 4
5 2 3 1 1 2 1 3 5 5 5 5 5 5 5
2 3 1 1 2 1 3 6
1 1 1 1 1 1 y y h y y
y y y y y y y
y y y y y y y
y y y y y y y
y y y y y y y
y y y y y y y
y y y y y y y
OALibJ | DOI:10.4236/oalib.1102603 7 April 2016 | Volume 3 | e2603
Matricizing Equations (2.7), we derive as follows:
2 1 1 0
1 0
2 2 2 2
1 1 1 2 2 1 2 4
1 0 1 0
0
7
2 1 3 2 2 1
2 2 2 2 2 2 2 2 2
1 2 4 8
1 2 1 2 1
9
3 2 4 3 3 2
3 3 3 2 2 2 2 2 2
1 2 4
2 3 2 3 2
2
2
2
y y y y
y y
y y y
h h h h
h
y y y y y y
y y y
h h h h h
y y y y y y
y y y
h h h h h
λ λ λ − − − − + − − − ⋅ += − − − − − + (2.10)
Similarly, for Equation (2.8), we have,
2 1 1 0
1 0
3 3 3 3
1 1 1 3 3 1 3 5
1 0 1 0
0
10
2 1 3 2 2 1
2 2 2 3 3 3 3 3 3
1 3 5 11
1 2 1 2 1
12
3 2 4 3 3 2
3 3 3 3 3 3 3 3 3
1 3 5
2 3 2 3 2
2
2
2
y y y y
y y
y y y
h h h h
h
y y y y y y
y y y
h h h h h
y y y y y y
y y y
h h h h h
λ λ λ − − − − + − − − ⋅ += − − − − − + (2.11)
Therefore, the basic model (2.5) which has been transformed to the matrix equations (2.9)-(2.11), satisfies the vector properties and each can be written as a vector form
Aλ =b (2.12)
Equation (2.12), justify that our model is described by quantifiable magnitude and has direction of purpose. Furthermore, it is observed that Equation (2.5) contains twelve unknown parameters, i.e. the variables λi,
1, 2, ,12
i= , with which all the parameters of the basic model (2.1) can be calculated. A case study of some of the parameter estimation as in basic model (2.1) can be found in [4]. Therefore, to determine these parameters, it becomes necessary to generate a minimum of 12 equations based on Equation (2.5). This can be achieved by differentiating Equation (2.5), more times, resulting in derivatives of y y y y1, 2, 3, 4 and y5, up to the order of measurement . In coping with these orders of derivatives, we need at least
0 1 2 3 4 0 1 2 3 4 0 1 2 3 4 0 1 2 3 4 1, 1, 1, 1, 1; 2, 2, 2, 2, 2; 3, 3, 3, 3, 3; 4, 4, 4, 4, 4
y y y y y y y y y y y y y y y y y y y y and 0 1 2 3 4 5, 5, 5, 5, 5
y y y y y ,
(where the superscripts denote sample numbers) measurements for the complete determination of all the HIV/AIDS parameters in the five-dimensional model (2.1), [1] [4] [5].
Then, from Equation (2.5), the identifiability of λi, means that all the parameters of our model (2.1) can be
[image:7.595.91.537.574.720.2]determined from the output of the CD4+ T cell count, viral load, parasitoid pathogen, HI-virus infected CD4+ T cells and pathogen infected CD4+ T cells. Thus, we establish (as inTable 3) below, the available measurement for the count of CD4+ T cells, viral load and pathogens, HI-virus infected CD4+ T cells and pathogen infected CD4+ T cells at varying time intervals:
Table 3. Obtained values for parameters of basic model (2.1).
Time (t) CD4
+ T cell
count (y1)
Viral load (y2) Pathogen (y3)
Infected CD4+ T
cell by HIV (y4)
Infected CD4+ T
cell by HIV (y5)
i t 1 i y 2 i y 3 i y 4 i y 5 i y 1 i
t +h 1
1
i
y+ 1
2
i
y+ 1
3
i
y+ 1
4
i
y+ 1
5
i y+
1 2
i
t + +h h 2
1
i
y+ 2
2
i
y+ 2
3
i
y+ 2
4
i
y+ 2
5
i y+
1 2 3
i
t + + +h h h 3
1
i
y+ 3
2
i
y+ 3
3
i
y+ 3
4
i
y+ 3
5
i y+
1 2 3 4
i
t + + + +h h h h 4
1
i
y+ 4
2
i
y+ 4
3
i
y+ 4
4
i
y+ 4
5
OALibJ | DOI:10.4236/oalib.1102603 8 April 2016 | Volume 3 | e2603
Then using a number of these measurements, we investigate if the matrix A, of Equation (2.12) is nonsingular (not equal to zero); a condition for unique solution for the coefficients λ =i,i 1, 2,,12 and hence, a prime modality for estimation of the model parameters bp, , , , , ,σ α µ β δ e c k dp, v, , , ,τ τ1 2. Furthermore, this investiga- tion is prompted by the fact that, at long asymptomatic stage (set point) and at the short period after administra-tion of chemotherapy, when either of the y ii, =1,, 5, is constant, the matrix A, can never be nonsingular for any choice of number of measurements. Therefore, a complete determination of the model parameters is impera-tively impossible due to these two periods of time [5]. To compute the values for the parameters λ =i,i 1,,12, of our model system, we need to compute each of the determinants of Equations (2.9)-(2.11). We see that the determinants of Equations (2.9)-(2.11) are not equal to zero, but very small, in the range of detA=10−8- 10−14 Therefore, applying Equation (2.12), that is, we need from Equation (2.12), λ=A b−1 to solve Equations (2.9)-(2.11), for the parameters λ =i,i 1,,12. The following results were obtain
(
)
1 2 3 4 5
6 7 8 9
5
10 11 12
0.00715; 0.35614; 0.47971; 0.00302; 0.57668;
0.11045; 20583.34808; 7026.42057; 44223.36626;
492.02446; 5.66259.10 ; 68172.44521 .
λ λ λ λ λ λ
λ λ λ λ
λ λ λ
= = = − = = =
= − = − = = −
= = − = −
Here, the solution, 1
{
}
1, 2, , 12
A b
λ= − = λ λ λ
, implies 1 2 3 4 5 6 0.00715, 0.35614, 0.47971, 0.00302, 0.57668, 0.11045, p b λ σ λ α λ µ λ β λ δ λ = = = = = = = = = = − = = 3 5 12 3 9 2 3 7 5
68.171 10 ,
23.949 10 ,
25.692 10 ,
p v e c k λ λ λ λ λ λ = − − = × = − = × = = × 4 5
8 5 7
1
7 5
1
4
4
1 5 7
2 10 5 3.56 0.00 9 10 524, ,
3.503 10 .
d λ
λ
λ λ λ
τ
λ λ
λ λ λ
τ λ λ = = ⋅ = − = ⋅ × = − = ×
So we see that as a result of the significantly small determinant, the computation of the coefficients , 1, ,12
i i
λ = , all yields large error derivative when compared with the parameter values of our optimal control as in Table 2, above. Whence, compatibility of optimal control strategy via discretization for a 5-D mathemati-cal model is seemingly elusive. Non-the-less, other possible options include:
a) Application of derived formula for high order of accuracy;
b) Carrying out interpolation followed by computation of the derivative of the interpolating polynomials; c) Since the regions of the coefficients are all non-negative, we account for the estimation of the model
para-meters by stepwise variation of the parameter values in order to study their respective behavior to viral load replication and pathogen resistivity.
In general, for options (a) and (b), we need small time interval range of 3 - 4 years and require calculating the derivative in the middle of the steps, resulting to complex procedures. In this case, patients are likely to die without waiting for simulation results. Therefore, option (c), is convenient for the estimation of model parame-ters. Thus by option (c), we return to Equation (2.1), from which we define the coefficients of our set-point. This criteria is of essence for the simple fact that, it a process to overcome indistinguishability nature of the infected cells and the uninfected cells immediately after asymptomatic stage. It also aid in the definition of treatment time limits and as an overall check to our earlier assumptions. Furthermore, chemotherapy has a certain desig-nated time for allowable treatment, since HIV is able to build up resistance after finite time frame due to its mu-tation ability and its potential hazardous side effects [17].
Keeping the parameters values of Table 2 in view, we determine the solution of the model (2.1) for the set-point, with the initial values of the coefficients generated as: T0( )u =0.6, I0( )v =0, I0( )p =0, V0( )v =0.2,
( ) 0p 0.2
P = , using well-known numerical method like RK4 in a Mathcad environment, we presents the graphical
simulations as inFigures 2 (a)-(e).
OALibJ | DOI:10.4236/oalib.1102603 9 April 2016 | Volume 3 | e2603
(a) (b)
(c) (d)
[image:9.595.107.527.81.550.2](e)
Figure 2. Graphical simulation of basic model (2.1) at set-point without treatment. (a) Simulation of uninfected CD4+ T cells for Tu=0.6; (b) Simulation of HI-virus infected CD4
+
T cells for Iν=0; (c) Simulation of pa-thogen infected CD4+ T cells for Ip=0; (d) Simulation of viral load in the blood plasma for Vν=0.2;
Simula-tion of pathogen in the blood plasma for Pp=0.2.
the initial sharp inclination of HI-virus infected CD4+ T cells (i.e.
( )
33 7.5 10
v
I = × − ) and pathogenic-infected
CD4+ T cells (i.e.
( )
43 9.0 10
p
I = × − ) and then experience steady decline in population due to the influence of the viruses. Also observed, are the decrease in the numbers of free viruses which has become replicated in the blood plasma (CD4+ T cells), as indicated by Vv
( )
3 =0.192 and Pp( )
3 =0.075 respectively. This gives a lead way in our investigation following the initiation of chemotherapy.3. Numerical Illustrations and Discussion
ac-OALibJ | DOI:10.4236/oalib.1102603 10 April 2016 | Volume 3 | e2603
tivation of the adaptive immune system, which act against parasitoid-pathogen. Specifically, RTI is responsible for the prevention of uninfected lymphocyte cells from infection by viral load and as well, the elimination of in-fected pathogen cells [18]. Consistent and cogent application of RTI by HIV infected patients insulate replica-tion of viruses (i.e. direct reduction in model parameters, k and d). In the exact circumstance, CD4+ T cells be-coming infected by viruses diminish in rate (i.e. decrease in δ and β ). Therefore, the behaviors of these pa-rameters afford the desired investigation of the model papa-rameters, which predicts the outcome of the healthy CD4+ T cells.
Illustratively, keeping in view other parameter values as in Table 2, together with the outcome ofFigure 2
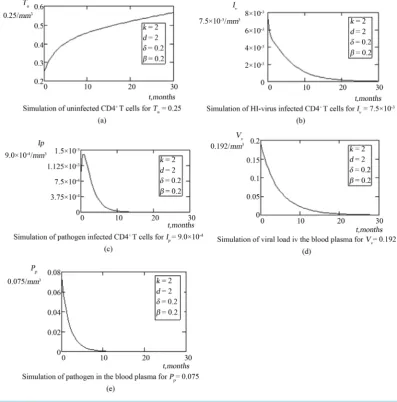
(set point values) above, we investigate the treatment for which k= =2 d and δ =0.5=β, the simulation of which are presented inFigures 3(a)-(e).
We see from Figures 3(a)-(e), that with intensive commencement of chemotherapy for t∈
[
3, 30]
months, when k= =2 d and δ =0.5=β ; Tu( )
3 =0.25, increases sharply to Tu( )
30 =0.495 in Figure 3(a). This in-Figure 3.(a)-(e): Simulation of model (2.1); at initiation of chemotherapy for k= =2 d and δ=0.5=β . (a) Simulation of uninfected CD4+ T cells for Tu=0.25; (b) Simulation of HI-virus infected CD4+ T cells for 3
7.5 10
Iν = × − ; (c)
Simula-tion of pathogen infected CD4+ T cells for Ip 9.0 104 −
OALibJ | DOI:10.4236/oalib.1102603 11 April 2016 | Volume 3 | e2603
crease in healthy CD4+ T cells is evident by the drastic decline in the rate of HI-virus infected CD4+ T cells from
( )
3 7.5 103v
I = × − to
( )
30 1.3 103 vI = × − in Figure 3(b)and parasitoid-pathogen infected CD4+ T cells from
( )
43 9.0 10
p
I = × − to near zero after 14 months in Figure 3(c). Also, we observe that the de-replication progress of infected CD4+ T cells, adversely attribute to sharp decline (suppression) of viral load in blood plasma from
( )
3 0.192v
V = to Vv
( )
30 =0.021 in Figure 3(d). Pathogen parasite is seen eliminated to near zero after 11 months of drug application in Figure 3(e).Furthermore, observing the same model coefficients as in Figures 3(a)-(e), but with reduced rate of CD4+ T cells becoming infected by both viral load and pathogen, following adherent administration of chemotherapy (i.e.
2
k= =d and δ =0.2=β), the simulated results are as presented in Figures 4(a)-(e).
Analysis from Figure 4(a)shows that a more enhanced outcome for healthy CD4+ T cells was experience at
( )
30 0.558u
T = with constant inflow of bp and accompanied by tremendous decline of both infected HI-virus
CD4+ T cells and parasitoid-pathogen infected CD4+ T cells. Figure 4(b), showed decline of Iv from
[image:11.595.114.512.259.662.2]3 7.5 10× −
Figure 4.(a)-(e): Simulation of model (2.1) persistent chemotherapy for k= =2 d and δ=0.5=β. (a) Simulation of un-infected CD4+ T cells for Tu=0.25; (b) Simulation of HI-virus infected CD4+ T cells for
3
7.5 10
v
I = × − ; (c) Simulation of
pathogen infected CD4+ T cells for 4
9.0 10
p
I = × − ; (d) Simulation of viral load in the blood plasma for Vv=0.192; (e)
OALibJ | DOI:10.4236/oalib.1102603 12 April 2016 | Volume 3 | e2603
to near zero after 24 months; while from Figure 4(c), Ip which showed initial increase at the first month, de-cline thereafter to near zero in the 11 month of chemotherapy administration. FromFigure 4(d) andFigure 4(e), the non-replications of infected T-cells invariably had de-transmuted into the decline and elimination of both viral load and parasitoid pathogen to near zero after 22 months and 9 months respectively.
4. Conclusion
In this paper, nonlinear 5-Dimensional mathematical models had been formulated with which the compatibility of optimal control strategy for parameter estimation of dual infectivity (HI-virus and parasitoid-pathogen) was investigated. Using discretization technique, it was established that optimization control strategy were incom-patible with the particular model, following the insignificant non-singularities of the model coefficients, which led to varying error derivatives. The study further explored predominant parameters to investigate the maximi-zation of healthy blood plasma and the trend of the viruses, following coherent chemotherapy. Time limit for chemotherapy was established with which simulation was conducted. Analysis of results showed that restoration and increase of healthy blood plasma were achieved with the administration of chemotherapy from set point. Furthermore, with the distortion of viruses’ replication and de-transmutation of healthy blood plasma by viruses from the point of chemotherapy application, eradication of dual HI-virus and parasitoid-pathogen were achieved within the ambit of chemotherapy time validity. The study therefore suggested the extension of model in the evaluation of other related dual infectious diseases. Furthermore, a more improved 5-Dimensioanl model com-patible with the application of optimal control strategy is thereof recommended.
Acknowledgements
The authors (Bassey B. E, Lebedev, K. A), acknowledge with thanks, the support of the Department of Math and Computer Science; and Galina Govorova-Head of International Relation, Kuban State University, Krasnodar, Russia, for their immense contributions.
References
[1] Shirazian, M. and Farahi, M.H. (2010) Optimal Control Strategy for a Fully Determined HIV Model. Intelligent
Con-trol and Automation, 1, 15-19. http://dx.doi.org/10.4236/ica.2010.11002
[2] Wei, X., Ghosh, S.K., Taylor, M.E., Johnson, V.A., Emini, E.A., Deutsch, P. and Lifson, J.D. (1995) Viral Dynamics in HIV-1 Infection. Nature, 273, 117-122. http://dx.doi.org/10.1038/373117a0
[3] Nowak, M.A. and Bangham, C.R.M. (1996) Population Dynamics of Immune Responses to Persistent Viruses. Science, 272, 74-79. http://dx.doi.org/10.1126/science.272.5258.74
[4] Xia, X. (2003) Estimation of HIV/AIDS Parameters. Automatica, 39, 1983-1988. http://dx.doi.org/10.1016/S0005-1098(03)00220-6
[5] Xia, X. (2007) Modelling of HIV Infection: Vaccine Readiness, Drug Effectiveness and Therapeutical Failures.
Jour-nal of Process Control, 17, 253-260. http://dx.doi.org/10.1016/j.jprocont.2006.10.007
[6] Badakhshan, K.P. and Kamyad, A.V. (2007) Numerical Solution of Nonlinear Optimal Control Problems Using Non-linear Programming. Applied Mathematics and Computation, 187, 1511-1519.
http://dx.doi.org/10.1016/j.amc.2006.09.074
[7] Grégio, J.M., Caetano, M.A.L. and Yoneyama, T. (2009) State Estimation and Optimal Long Period Clinical Treat-ment of HIV Seropositive Patients. Anais da Academia Brasileira de Ciências, 81, 3-12.
http://dx.doi.org/10.1590/S0001-37652009000100002
[8] Wein, L.M., Zenios, S.A. and Nowak, M.A. (1997) Dynamic Multidrug Therapies for HIV: A Control Theoretic Ap-proach. Journal of Theoretical Biology, 185, 15-29. http://dx.doi.org/10.1006/jtbi.1996.0253
[9] Badakhshan, K.P., Kamyad, A.V. and Azemi, A. (2007) Using AVK Method to Solve Nonlinear Problems with Un-certain Parameters. Applied Mathematics and Computation, 189, 27-34. http://dx.doi.org/10.1016/j.amc.2006.11.172 [10] Ouattara, D.A. (2005) Mathematical Analysis of the HIV-1 Infection: Parameter Estimation, Therapies Effectiveness
and Therapeutical Failures. Proceedings of the 2005 IEEE, Engineering in Medicine and Biology 27th Annual
Confe-rence, Shanghai, 1-4 September 2005, 821-824.
OALibJ | DOI:10.4236/oalib.1102603 13 April 2016 | Volume 3 | e2603
Preventive Measures for the Spread of HIV/AIDS. Proceedings of XVIII-th International Scientific Conference “
Mod-ern Science: Actual Problems and Ways of Their Solution”, Lipetsk, 20 July 2015, Ed. by M. Y. Levin, Lipetsk: OOO
Max Information Technology. 18, 5, 47-56. (In Russian)
[13] Bassey, B.E. and Lebedev, K.A. (2015) On the Mathematical Modeling of the Impact of Numerical Stability of the Treatment of Vertical Transmitted HIV/AIDS Infections. Proceedings of XVI-th International Scientific Conference
“Scientific Potential of Contemporary Russia”, Lipetsk, 10 August 2015, Ed. by M. Y. Levin, Lipetsk: OOO Max
In-formation Technology. 16, 5, 7-19. (In Russian)
[14] Bassey, B.E. and Lebedev, K.A. (2015) On Global Convergence and Impact of Multistageand Padѐ Techniques for Iterative Methods in Nonlinear HIV/AIDS Preventive Chain Model. Proceedings of the XIX-th International Scientific
Conference “Modern Science: Current Problems and Solutions”, Lipetsk, 14 September 2015, Ed. By M. Levin,
Li-petsk: LLC Maximal Information Technologies. 19, 6, 17-27. (In Russian)
[15] Wikipedia (2015) The Free Encyclopedia, Immune System. https://en.wikipedia.org/wiki/Immune_system/
[16] Pattman, R., Snow, M., Handy, P., Sankar, K.N. and Elawad, B. (2005) Oxford Handbook of Genitourinary Medicine, HIV and AIDS. Oxford University Press, USA.
[17] Fister, K.R. and Lenhart, S. (1998) Optimizing Chemotherapy in an HIV Model. Journal of Differential Equations, 1998, 1-12.
[18] Joshi, H.R. (2002) Optimal Control of an HIV Immunology Model. Optimal Control Applications and Methods, 23, 199-213. http://dx.doi.org/10.1002/oca.710
[19] Kirschner, D. and Webb, G.F. (1998) Immunotherapy of HIV-1 Infection. Journal of Biological Systems, 6, 71-83. http://dx.doi.org/10.1142/S0218339098000091