Munich Personal RePEc Archive
Spend more today: Using behavioural
economics to improve retirement
expenditure decisions
Blake, David and Boardman, Tom
Pensions Institute
October 2010
Online at
https://mpra.ub.uni-muenchen.de/34234/
DISCUSSION PAPER PI-1014
Spend More Today: Using Behavioural
Economics to Improve Retirement Expenditure
Decisions
David Blake and Tom Boardman
October 2010
ISSN 1367-580X
The Pensions Institute
Cass Business School
City University
106 Bunhill Row London
EC1Y 8TZ
UNITED KINGDOM
Spend More Today:
Using Behavioural Economics to Improve Retirement
Expenditure Decisions
David Blake,
Director
(d.blake@city.ac.uk)
and
Tom Boardman,
Visiting Professor
(tvboardman@gmail.com)
Pensions Institute
Cass Business School
106 Bunhill Row
London, EC1R 1XW
United Kingdom
27
thOctober 2010
Abstract
This paper examines how behavioural economics can be used to improve the expenditure
decisions of retirees. It identifies how accumulated assets can be used optimally throughout
retirement to produce life-long income when required, to make provision for contingencies –
such as unanticipated spikes in expenditure – and to optimize the size and timing of bequests.
We do this using a SPEEDOMETER (or Spending Optimally Throughout Retirement) retirement expenditure plan which employs defaults within a choice architecture. At its simplest, the plan
involves just four key behavioural nudges: (1) First,make a plan – ideally with, but if necessary
without, an adviser; (2) automatic phasing of annuitization which is designed to tackle the
aversion to large irreversible transactions and losing control of assets and so allows the greatest
possible degree of flexibility in managing the run-down of retirement assets; (3) capital
protection in the form of ‘money-back’ annuities which deals with loss aversion, i.e., the fear of
losing your money if you die early; and (4) the slogan ‘spend more today’ which utilizes
hyperbolic discounting to satisfy the human trait of wanting jam today and to reinforce the idea
Spending Optimally Throughout Retirement:
Using Behavioural Economics to Improve Retirement
Expenditure Decisions
1. Introduction
In 2004, Shlomo Benartzi and Richard Thaler (2004) came up with the brilliantly simple idea of
SAVE MORE TOMORROW (SMART) plans which exploited behavioural traits such as inertia, hyperbolic discounting1 and money illusion2 to increase retirement savings using automatic deferred
salary sacrifice.3 The concept worked and has been implemented, with certain modifications, in a
number of countries. For example, in the UK, a new national pension system called NEST (the
National Employment Savings Trust) is being introduced in 2012 (Pensions Acts 2007 and 2008).
This will use auto-enrolment, rather than auto-salary sacrifice, to increase retirement savings.
Younger employees can therefore overcome a potential problem facing many of their older
colleagues, namely insufficient pension savings leading to poverty in old age, a phenomenon that is
inconsistent with the predictions of the Life Cycle Model (LCM).4
Behavioural economists have identified some of the limitations of conventional economic theory
caused by the failure to take human behaviour into account. Richard Thaler and Cass Sunstein in
their best selling 2008 book Nudge: Improving Decisions about Health, Wealth and Happiness
define two very different types of consumers – ‘econs’ and ‘humans’. In a retirement expenditure
context, ‘econs’ are fully rational life-cycle financial planners. ‘Humans’, by contrast, try to make the
best decisions for themselves, but are subject to behavioural traits that limit their ability to implement
their plans. Thaler and Sunstein believe that very few people are ‘econs’ and their book provides
examples of how to nudge ‘humans’ into making optimal choices.5
1
This means that individuals use higher discount rates for more distant cash flows than they do for nearer cash flows, with the consequence that distant cash flows are relatively much less highly valued today than nearby cash flows.
2
This is where individuals fail to recognize the difference between nominal and real (i.e., inflation-adjusted) values.
3
This is where a portion of future pay rises is diverted to the employee’s pension plan.
4
The LCM was introduced by Ando and Modigliani (1963) and is still the dominant model used by conventional economists. In the LCM, individuals are assumed to have the skills to allocate their lifetime income and assets over their life cycle in order to maximize the expected lifetime utility of the consumption stream that can be purchased with the income and assets, taking account of attitude to risk. In the absence of a bequest motive, accumulated savings are run down to zero at the time of death: individuals die clutching their last penny and never run out of money while still alive.
5
In simple terms, the aim of this paper is to look at how ‘econs’ would optimize their financial plans in
retirement and then to find ways to nudge ‘human’ retirees into making optimal choices. Is there
something akin to SMART plans to help retirees spend the money that they have saved during their working lives by being optimally ‘smart’ through retirement?
As the Baby Boomers begin to retire, a different set of behavioural issues confront them, reluctance
to save is replaced by a reluctance to annuitize and the possible suboptimal drawdown of retirement
assets. This paper examines ways in which behavioural economics can be used to overcome the
so-called ‘annuity puzzle’, the reluctance of retirees to voluntarily annuitize sufficient of their assets
to adequately hedge their longevity risk.6 We do this by introducing SPEEDOMETER (or Spending
Optimally Throughout Retirement) retirement expenditure plans. We use the term SPEEDOMETER
to reflect the fact that spending optimally is related to the speed with which assets are drawn down
and a SPEEDOMETER is a useful device both for measuring and influencing speed.
A SPEEDOMETER retirement expenditure plan helps retirees pace their spending throughout retirement in order to optimize their lifetime income to cope with retirement income shocks and their
ability to make intended bequests by: (1) first, making a plan, either by using an on-line or
telephone-based service providing generic financial advice or if wealth permits, involving a financial
adviser whose role is to assist with making and implementing the plan and conducting annual
reviews;7 (2) managing all assets and income sources holistically to secure, as a minimum, a core inflation-protected income sufficient to meet the retiree’s ‘essential’ needs for the remainder of their
life;8 (3) using insurance solutions, when available and cost effective, to cover contingencies, and,
where possible, maintaining flexibility by holding sufficient assets to meet uninsurable shocks (i.e., a
‘rainy day’ fund); (4) using automatic, phased annuitization into ‘money-back’,9 inflation-linked, fixed
benefit (DB) pension entitlements, housing equity and greater inheritance (again due to the increases in the value of their parents’ houses); see, e.g., Willetts (2010). However, it can be argued that much of this is due to luck rather than skill. In contrast, it is widely recognized that both Generation X (born between 1965 and 1980) and Generation Y (born after 1980) are undersaving.
6
In the UK, until the June 2010 Budget, there was a mandatory requirement for a defined contribution (DC) pension plan member to secure pension income by age 75 at the latest with at least 75% of the fund; for 99% of retirees this was achieved by the use of a lifetime annuity. But there is a widespread view that this is not a ‘smart’ purchase. There is minimal annuitization of non-pension assets.
7
SPEEDOMETER plans need to take account of the taxation implications on income, capital gains and
inheritance. They also need to take account of the interaction with means-tested state benefits. For example, in the UK, the state provides some insurance against shocks, e.g., incapacity benefits, which reduces the need for private insurance. Similarly, in the UK, if the ‘rainy day’ fund is too high, this would remove the entitlement to means-tested benefits such as Housing and Council Tax Benefits.
8
We define ‘essential’ income as the income required to cover the plan member’s minimum basic expenditure needs.
9
or investment-linked lifetime annuities or into variable annuities – depending on the degree of risk
aversion and wealth of the plan member – to secure an ‘adequate’ level of life-long income10 above
the minimum if there is sufficient wealth to do so; and (5) offering a simplified choice architecture for
managing any residual wealth with the aim of achieving a ‘desired’ standard of living in retirement,11
while allowing part of the remaining wealth to be bequested at a time of the retiree’s choosing.
We believe the plan is suitable for all members of society, except the super-rich, although the size of
the minimum income level will differ depending on circumstances (e.g., health status) and the
socio-economic group to which the retiree belongs. Part 2 will be the most important part of the plan for
the mass market with limited bequestable assets. The remainder of the plan is designed primarily
for the mass affluent, although it might also have some relevance both for members of the mass
market with some housing equity and for the high net worth segments of society.
A SPEEDOMETER plan is one that we believe an ‘econ’ would choose. But we also need to recognize explicitly that most of us are ‘humans’ and need an appropriate choice architecture, as
well as some advice and nudging, along the lines of Thaler and Sunstein (2008), towards the
optimal solution provided by the SPEEDOMETER plan. The plan recognizes that it is not a question of whether retirees should annuitize some of their wealth, but when they should do so.12 Retirees with modest wealth in excess of the optimal ‘rainy day’ fund cannot really afford to take on
investment and longevity risks and therefore need to annuitize sooner rather than later in order to
secure at least an adequate lifetime income. Those with more wealth can use annuitization to insure
against their income falling below what they consider to be an adequate or even a desired level and
to reduce the variability around the level and timing of the inheritance they pass on to their heirs; in
particular, annuitization enables bequests to be made prior to death.13 It is optimal for couples to
annuitize later than singles. In short, a SPEEDOMETER plan with its optimal use of annuitization, allows retirees to ‘spend more today’, safely. In fact, it is analogous in the distribution phase of the life cycle to a SMART plan in the accumulation phase, although it is considerably more sophisticated, since it also deals with the optimal investment and longevity risk strategies in later
life. Planning retirement income is complex, given the unknown and effectively uncontrollable time
period over which consumption has to be spread. By contrast, in the accumulation phase,
net of any tax. The guaranteed payment schedule with a ‘money-back’ annuity involves a decreasing death benefit to ensure that the sum of the overall payments is at least equal to the original purchase price.
10
We define ‘adequate’ income as the income required to achieve a minimum lifestyle to which the plan member aspires in retirement.
11
We define ‘desired’ income as the income required to achieve the full lifestyle to which the plan member aspires in retirement.
12
Income from defined benefit schemes is recognized within the SPEEDOMETER plan and typically viewed
as similar to an index-linked annuity. Retirees who are members of DB pension schemes are likely to have less flexibility around phasing and when they can start receiving their pension income.
13
individuals can influence, at least to a degree, when they exit the labour market and are able to
adjust their savings rate.
While the paper focuses on how to spend wealth optimally, it is important to recognize that the key
foundation of any successful retirement expenditure plan is accumulating sufficient savings prior to
retirement. In the UK, annuities are often blamed for poor retirement incomes when the root cause
is not annuities – which recent studies14 have shown offer good value (in the sense of having
relatively high money’s worth15) in the competitive UK market – but rather an inadequate retirement
fund as well as reductions in the real value of state and private pensions.
The outline of the paper is as follows. In section 2, we examine needs, risks and financial resources
in retirement. Section 3 reviews the range of retirement income products available. Section 4
discusses the optimal use of these products for different market segments – the low affluent, the
mass market, the mass affluent and the high net worth – considering how, if retirees were behaving
optimally, they would determine their optimal investment portfolio and their optimal age to annuitize,
taking into account the desire to retain flexibility to allow for uninsurable shocks. Section 5 looks at
the barriers that need to be overcome in getting to the optimal level of annuitization, while Section 6
discusses the choice architecture required to ‘nudge’ retirees to make better financial planning
decisions. Section 7 concludes.
Throughout, it is important to bear in mind the following definition of a pension plan: it provides
retirement income security for however long the plan member lives (Bodie (1990)). If a plan does
not do this, it should be classified as a wealth management plan, but not a pension plan. We believe that a SPEEDOMETER plan is more general than a simple pension plan, because it looks at all of a retiree’s assets and income sources, and uses them optimally to maximize the expected utility or
welfare of retirement expenditure. We also believe that a SPEEDOMETER plan is more useful than a typical wealth management plan for two key reasons: (1) it explicitly uses annuitization and its
timing to meet expenditure needs and to make bequests more effectively and (2) it actively uses
behavioural economics to nudge retirees to make the best decisions for their circumstances.
14
2. Needs, Risks and Financial Resources in Retirement
2.1 Needs
Consumption needs in retirement are neither smooth nor certain. Consumption expenditure in
retirement typically exhibits a U-shaped pattern (see Figure 1). First, there is a period of active
retirement in which retirees do the things they promised to do, but did not have the time to do, while
they were in work. Then, there is a period of inactive retirement: aches and pains become more
prominent and eventually people cannot even be bothered to go out and buy a daily newspaper.
Finally, medical, care and possibly nursing home expenses come to dominate expenditure. For
[image:9.595.130.473.279.507.2]some, maximizing inheritance is an important consideration.
Figure 1: Income needs in retirement are not smooth or certain
Age
Income
Active life
-Higher income
Less active
-Lower income
Residential care
-Higher income
2.2 Risks
There are many events that can impact even a well-structured retirement expenditure plan. Living
through retirement can be a bit like the snakes and ladders game that we played in our childhood.
Many events are unpredictable and essentially random or at least the timing of their occurrence is
random. They typically impact single people and couples in different ways: couples often benefit
from two incomes and can support each other.
15
There are many snakes or adverse events:
Failure of private pension plans, with the prospect of a reduced pension if a plan falls into the
Pension Protection Fund.16
Poor (i.e., low or negative) investment returns on household financial assets, leading to a
depletion of wealth. Investment and reinvestment risks are present if retirement assets are
held in anything other than conventional lifetime annuities. Stock market indices can fall by
10% or more in a single day – as we witnessed in 2008, in response to the 2008-09 Global
Financial Crisis.17 Such falls can seriously damage wealth if a fixed income is still drawn
from it.
Low interest rates. Not only does this affect the income received from bank and building
society deposits – the only financial assets held by a large percentage of retirees – there is
interest-rate risk when an annuity is purchased. If interest rates are low at the time of
purchase, the annuitant will be locked into a permanently low annuity income.
Period of high inflation: the purchasing power of money is reduced by half in 14 years with
5% inflation, in 7 years with 10% inflation. An index-linked annuity can protect against
inflation, however.18
Changes in taxation and state benefit rules.
Debts that have not been paid off whilst in work (consumer loans, outstanding mortgage,
etc).
Loss of or inability to find post-retirement work.
Unexpected expenditure, such as a major repair bill.
Unexpected needs of dependants or relatives.
Ill health: this can affect not only the retiree, but the need to care for a partner can also have
a major impact on retirement plans.
Funding for term care: 1 in 5 retirees in the UK will have to find the means to fund
long-term care, which ranges between £329 per week for stays in residential homes to £455 per
week for stays in nursing homes.19
Divorce: this is on the rise for retired couples.
16
The UK Pension Protection Fund is a statutory fund run by the Board of the Pension Protection Fund, a statutory corporation established under the provisions of the Pensions Act 2004 to protect the benefits of members of private-sector defined benefit pension plans – up to certain limits – in the event that plan sponsors become insolvent. It is financed by a compulsory levy on all private-sector DB pension plans.
17
On 10 October 2008, the S&P500 index fell 10.7%, while the FTSE100 index fell 8.9%; the banks Morgan Stanley and HBOS fell by 25% and 19%, respectively.
18
There could still be inflation risk even if an index-linked annuity is purchased, since retiree inflation might differ from the inflation index underlying most index-linked annuities (typically the retail price index (RPI) or the consumer price index (CPI) in the UK).
19
Death of a partner: this can also have a major impact on retirement plans, especially if it
results in a significant reduction in pension income.
Longevity risk. This has two extremes: the risk of outliving one’s resources and hence the
failure to leave an intended bequest, but also the risk of underspending in retirement and
hence leaving unintended bequests. Individuals find it difficult to appreciate the variability of
actual lifetimes around the expectation of life. Figure 2 shows that for typical 65-year old
males in the UK today, life expectancy is 87.8, but 25% will reach 94 and 8% will reach 100.
A male aged 85 today can expect to live another 7.1 years to 92.1, 26% can expect to reach
95 and 7% to reach a 100.
0 1 2 3 4 5 6 7 8 9
85 90 95 100 105 110
% d eat h s a t each ag e Age 0 1 2 3 4 5
65 70 75 80 85 90 95 100 105 110
% d eat h s at each ag e Age 25% 25% Life expectancy = 87.8 Most likely age at death =
91
Expected distribution of deaths: male 65
Idiosyncratic risk
Expected distribution of deaths: male 85
Life expectancy = 92.1 Most likely age
at death = 85
26% will reach 95 and 7% will
[image:11.595.129.467.328.478.2]reach 100 Figure 2: Variability in life expectancy
Idiosyncratic risk
Source: 100% PNMA00 2010 plus improvements in-line with CMI_2009_M [1.00%]
Regrettably, there are fewer ladders, or favourable events, to help boost long-term retirement
income. The main resources in retirement will be state benefits and allowances – both means-tested
and non-means-tested – and private pensions, but some retirees will also benefit from:
Significant non-pension financial assets.
Housing equity release: this is probably the most important potential ladder for most
owner-occupiers in retirement.
Part-time working.
Additional state benefits and allowances which can help offset some of the additional
expenditure increases due to ill health, care needs or higher fuel costs in old age.20
Life, critical illness, health and long-term care insurance.
20
Inheritance from parents.
Lower inflation.
Higher investment returns.
Marriage: marriage or re-marriage after the divorce or death of a spouse is, of course, a major event which should be a big ladder, because couples typically benefit from joint
income and can support each other.
Of course, the analogy of the snakes and ladders game is not quite right. Snakes and ladders is
essentially a game of chance with very limited tactical or strategic options. However, with
appropriate retirement planning, retirees can be helped by advisers to prepare in advance to
mitigate the impact of many of the shocks.
2.3 Financial resources
Retirement planning needs to take account of all of a retiree’s assets: state pensions and any
benefit entitlements, defined benefit (DB) and defined contribution (DC) pensions, non-pension
assets and housing wealth. For those with a number of sources of wealth, holistic retirement
planning is essential to optimize income and tax.
0 250 500 750 1000 1250
[image:12.595.135.446.466.685.2]Financial wealth Housing wealth Physical wealth Pensions
Figure 3: Total wealth for ages 55 to 64 in 2005
Annuities Equity release
Income
DB pension DC pension Pension in payment
Source: Wealth and Assets Survey 2006-2008, Office for National Statistics
£bn
As Figure 3 shows, many of the Baby Boomers approaching retirement in the UK have
accumulated significant wealth. The 7.1 million people aged between 55 and 64 who represent the
pensions wealth, £900bn of housing wealth, £265bn of financial wealth and £208bn of physical
wealth. £557bn of the pension wealth is already in payment, with £459bn of DB pension wealth and
£87bn of DC pension wealth still to be converted into retirement income. Clearly, some of the
housing wealth could be converted into income by using equity release and an income could also
be generated from the assets that make up financial wealth. The pension wealth figure makes no
allowance for Basic State and Second State pensions but does include public sector employee
pensions even though they are largely unfunded.
The wealth profile of the Baby Boomers is highly skewed and, in addition to earnings and
inheritance, depends significantly on whether they participated in a DB pension scheme for a large
proportion of their working life and also bought a house in the 1970s and 1980s. 79% of this age
group have a private house giving average (median) housing wealth for those with a house of
some £270,000 (£200,000). Almost a third of the group have no pension wealth, while the two
thirds with some pension wealth have a mean pension wealth of £250,300.
Clearly with such a skewed distribution of wealth, it is useful to segment the pre-retirement market.
According to the FSA Baseline Survey,21 there were some 8.8m people over 50 in the UK in 2005
who had not yet retired. This cohort can be broken down into: 3 million (35%) low affluence (net
income below £10,000 and mean financial wealth £2,200); 4 million (45%) mass market (net
income between £10,000 and £30,000, with mean financial wealth of £13,300); and 1.8 million
(20%) mass affluent and high net wealth (net income over £30,000 and mean financial wealth of
£71,400). Even within this last category, financial wealth is highly skewed with median financial
wealth equal to just over one half of the mean at £37,400).22
Figures 4 and 5 show the key sources of income in retirement by quintiles of the gross income
distribution for retirees in the UK in 2006-07 in absolute and relative terms, respectively. What is
clear is how much retirees depend on the state for retirement income,23 especially once earnings
cease, and how it is really only the top 40% or even top 20% of pensioner household units that have
the luxury of worrying about funding an ‘adequate’ income level, let alone a ‘desirable’ one.
21
FSA Baseline Survey of Financial Capability (2006).
22
The wealth figures here ignore the value of Basic and Second State pensions and other state benefits.
23
Figure 4: Components of mean gross income per pensioner unit by quintiles of the net income distribution: 2006-2007
Source: Department for Work and Pensions
Pensioner unit = all single pensioners + couples 0
200 400 600 800 1000
1 2 3 4 5
Benefit income Occupational pension Personal pension income Investment income Earnings Other income £/week
0% 20% 40% 60% 80% 100%
1 2 3 4 5
Benefit income Occupational pension Personal pension income Investment income Earnings Other income
Figure 5: Percentage contribution to mean gross income per pensioner unit by quintiles of the net income distribution:
2006-07
Source: Department for Work and Pensions
Pensioner unit = all single pensioners + couples
3.Retirement Income Products
3.1Annuitization
Before discussing retirement income products in detail, we need to define annuitization. We use the
term annuitization to cover all products that can guarantee a minimum lifetime income however long
[image:14.595.170.401.424.567.2]provide this guaranteed lifetime income either by operating a cross-subsidy or by making an explicit
charge.
With conventional lifetime annuities, the retiree’s capital is put at risk in exchange for a mortality
cross-subsidy. This is the transfer of wealth within a pool of annuitants from those who die earlier
than their life expectancy – and hence lose their residual capital – to those who live longer: an
earlier-than-expected death creates a mortality release which the annuity provider uses to fund
income for those who live longer than expected. In effect, the mortality cross-subsidy generates
survivor credits which increase with age and which continue as long as the annuitant is alive;
thereby ensuring the lifetime income guarantee.
With variable annuities, extra fund charges are made for the lifetime guarantee and these
accumulate the longer the policyholder lives. The result is that those dying early provide only a
modest cross-subsidy to those living longest. Those living longest pay the most charges and this is
reflected in a lower lifetime income than available under the conventional annuity’s cross-subsidy
approach, all other things being equal.
As we have already commented, many of the Baby Boomers in the UK are retiring with a significant
proportion of their pension wealth in the form of a DB pension. This effectively results in automatic
annuitization of DB pension wealth. The focus in this paper is, accordingly, on the optimal use of DC
and non-pension wealth.
3.2 Defined contribution pension products
The principal retirement income products available from DC pension plans in the UK are:
Conventional lifetime annuities, such as fixed and index-linked annuities.
Income drawdown (also known as systematic, programmed, or phased withdrawal): the retiree’s assets remain fully invested, but some of the assets are sold each year to pay anincome to the retiree (in addition to any income the assets themselves produce).
Investment-linked annuities – such as with-profit annuities, unit-linked annuities, flexibleannuities – and variable annuities.
Figure 6 shows that the UK DC retirement income market was worth £12.4bn in 2009, of which 80%
was in the form of conventional annuities, 15.5% in drawdown and just 4.5% in investment-linked
annuities. The market share of conventional annuities grew from 59% in 2000 to 80% in 2009 by
0 200 400 600 800 1,000 1,200 1,400 1,600
2000 2001 2002 2003 2004 2005 2006 2007 2008 2009
[image:16.595.123.460.132.290.2]Conventional annuities Investment-linked annuities Income drawdown
Figure 6: Sales of UK retirement income market products: 2000-2009 £ m 80% 15.5% 4.5% 59% 28% 13%
Source: ABI new business market data
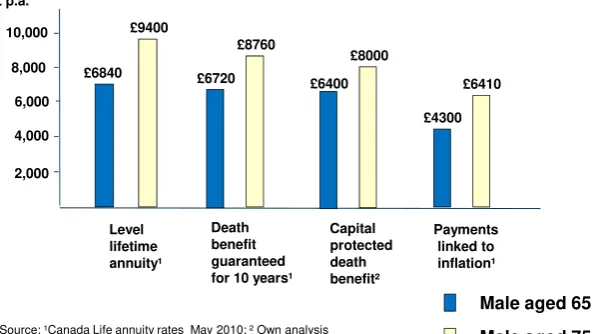
Figure 7: Lifetime annuities in the UK
2,000 4,000 6,000 8,000 10,000
Source: ¹Canada Life annuity rates May 2010; ² Own analysis
£ p.a.
Male aged 65
Male aged 75
Death benefit guaranteed for 10 years¹
Typical annuity rates for £100,000 premium
£6840 £9400 £6720 £8760 £4300 £6410 Level lifetime annuity¹ Payments linked to inflation¹ Capital protected death benefit² £6400 £8000
3.2.1 Conventional lifetime annuities
Conventional lifetime annuities provide a guaranteed income for life, either in nominal or real terms.
In their simplest form, there is no death benefit and the income is a fixed monetary amount which
[image:16.595.146.445.465.632.2]65-year-old male a fixed annuity for life of £6,840 per annum. Guaranteeing that the annuity
payments are made for at least 10 years reduces the annual payment by 2% to £6,720. A
capital-protected annuity24 reduces the annual payment by 6.4% to £6,400.25 An index-linked annuity starts
at £4,300 and will increase in line with increases in the RPI.
The purchaser of a conventional lifetime annuity removes two key risks, longevity risk and
investment risk. Longevity risk is removed by the insurance company guaranteeing to pay income
however long the pensioner lives. The Global Financial Crisis has highlighted the importance of the
investment guarantee that insurance companies give to a retiree when they buy an annuity. From
an investment perspective, retirees gain in four ways:
First, because annuitants give up control over their assets, insurance companies can invest in illiquid investments such as long-dated corporate bonds to match their liabilities.
Insurance companies pass on a significant portion of the liquidity premium to retirees
resulting in higher annuity rates.
Insurance companies are able to manage re-investment risk within their annuity portfolios much more efficiently than individuals.
Insurance companies take on credit risk, again typically in the form of corporate bonds, and pass on some of the credit risk premium to annuitants, since they can diversify the credit
risk against longevity risk which has low correlation with credit risk.26
Finally, annuitants benefit from the ability of insurance companies to pool the funds of
annuitants which allows them to invest in fixed-interest or inflation-linked investments that
would not be directly available to individuals. For example, insurance companies can
participate in infrastructure projects or large commercial property investments.
3.2.2 Income drawdown
Figure 8 shows the situation with income drawdown and the same £100,000 premium. Suppose the
individual decides to withdraw £6,840 each year and that the investment return on the fund is 4.5%
after charges.27 This enables the same income as the annuity to be drawn each year, so long as
there are sufficient funds remaining. The bars in Figure 8 show the depletion of the fund, while the
line shows the percentage of lives expected to still be alive at each age. The fund is exhausted by
24
Pension schemes are currently not permitted to offer capital-protected annuities, although this restriction will shortly be removed.
25
The reduction in income on a joint-life capital-protected annuity for a couple both aged 65 would be much smaller at around 1%.
26
Longevity risk is not completely uncorrelated with credit risk, since the holders of corporate bonds in companies with deficits in their pension funds arising from increased longevity face an increase in credit risk.
27
age 90 and there is a 48% chance that the retiree will outlive his assets, maybe by many years. The
advantage of drawdown, however, is that if the retiree dies before age 90 – and over half will – his
estate will receive the balance of the fund, whereas with a standard annuity without any death
benefit, the estate gets nothing.
0 10 20 30 40 50 60 70 80 90 100 0 10000 20000 30000 40000 50000 60000 70000 80000 90000 100000
[image:18.595.133.474.224.408.2]65 67 69 71 73 75 77 79 81 83 85 87 89 91 93 95 97 99 101 103 105
Figure 8: Drawdown from age 65: Income of £6,840 yearly in arrears with a 4.5% fund growth rate
Source: Own analysis using 100% PNMA00 2010 plus improvements in-line with CMI_2009_M [1.00%]
Drawdown: Male aged 65
48% will outlive their assets
Fund £ Percentage
alive
£6,840 4.5% Percentage still alive
Age 0 10 20 30 40 50 60 70 80 90 100 0 10000 20000 30000 40000 50000 60000 70000 80000 90000 100000
65 67 69 71 73 75 77 79 81 83 85 87 89 91 93 95 97 99 101 103 105
£6,840 5.5% Percentage still alive
Figure 9: Drawdown from age 65: Income of £6,840 yearly in arrear with a 5.5% fund growth rate
Source: Own analysis using 100% PNMA00 2010 plus improvements in-line with CMI_2009_M [1.00%]
Drawdown: Male aged 65
22% will outlive their assets
Fund £
Age Percentage
alive
Some retirees might believe they can generate higher returns in retirement by investing a greater
[image:18.595.134.468.513.704.2]annual income drawn remains at £6,840, but an investment return of 5.5% after charges is
generated. In this case, the fund would be exhausted by age 96 and some 22% of retirees would
still outlive their assets. However, equity prices are more volatile than those of bonds. If income is
taken when asset prices are depressed, the fund can run down very quickly particularly when a
significant income relative to the fund size is being withdrawn at older ages. The purchasers of
income drawdown products retain all risks, particularly longevity and investment risks, and, in
addition, do not benefit from survivor credits.
3.2.3 Investment-linked annuities and variable annuities
The survivor credits can operate within investment-linked annuities, such as with-profit annuities,
unit-linked annuities and flexible annuities (Wadsworth et al. (2001)).
In the case of with-profit annuities, the pension fund is invested in a risk-graded managed fund. The
annuity payment is based on an anticipated smoothed investment return. The initial income
generally starts at a similar level to the fixed annuity and, if investment performance is good, income
increases. However, the annuity payment could be reduced if the assumed smoothed return turns
out to be lower than the actual return.
With unit-linked annuities, the capital sum is invested in a unit-linked fund and each year a
guaranteed number of units are sold to provide the annuity payment. The initial payment is typically
lower than with an equivalent level annuity. The annuity fluctuates in line with the unit-linked fund’s
price. Income equal to the value of the units is guaranteed to be paid however long the annuitant
lives.
With flexible annuities, the annuity payment can be varied within limits at the annuitant’s option.
Income is dependent on investment performance; if investment performance is lower than expected
this impacts the level of future income. The pension fund is invested in a risk-graded managed or
unit-linked fund. A variation on this is to purchase a sequence of 5-year limited period annuities to
provide the income, at each stage retaining sufficient wealth to fund future purchases in the
sequence.
US-style variable annuities (VAs) have recently been introduced into the UK. While VAs can operate
pension regulations. VAs can be thought of as drawdown with guarantees, and, as a result of the
guarantees, will provide a lower income than a lifetime annuity.28
3.3 Non-pension products
As highlighted in Section 2, mass affluent and high net wealth retirees have considerable
non-pension wealth. With non-non-pension products, there is a wider choice of investments. Options include:
Cash-based products and guaranteed bonds from National Savings, banks, building
societies and insurance companies.
Life bonds, with-profits bonds, US-style variable annuities and mutual funds offering
exposure to equities, corporate bonds and property are also available.
Insurance companies also offer purchased life annuities (PLA)29 and immediate-needs
annuities30 which provide a guaranteed lifetime income.
Direct property investments ranging from own residence, buy-to-let and commercial
property.
More specialist investments often with tax incentives and which typically offer a higher
reward in exchange for higher risk.
4. TheOptimal Use of Products and the Optimal Investment Strategy
4.1 The optimal use of products
The optimal use of the products discussed in the previous section will depend on the source of the
retiree’s wealth and the segment of the market to which the retiree belongs.
Retirement expenditure planning is about tradeoffs:
● Higher income and expenditure today v higher income and expenditure later. ● Higher income and expenditure v higher inheritance.
● Protecting against future inflation v higher immediate income. ● More investment risk v more certainty in retirement income. ● Buying longevity insurance v assuming longevity risk.
28
For more details of the UK annuity market, see Wadsworth et al. (2001), Boardman (2006) and Cannon and Tonks (2008).
29
Purchased life annuities is the name given to annuities that are voluntarily purchased in the UK. Part of the annuity payment is a return of capital and this part of the annuity payment is not taxed. This contrasts with pension annuities which are also known as compulsory purchase annuities. Since the pension fund at retirement benefitted from generous tax breaks during the accumulation stage of the pension plan, the whole of a pension annuity payment is subject to tax.
30
Personal circumstances will influence the appropriate decisions for an individual. Nevertheless,
these tradeoffs are hard even for professional financial planners, economists and actuaries to make,
let alone members of the general public. Most people typically have limited planning skills, a very
limited understanding of inflation, investment and longevity risks, and find it difficult to make choices
that impact outcomes some time into the future. Planning retirement finances in the context of the
level of uncertainty surrounding the length of life depicted in Figure 2 is difficult and shows the
importance of a guaranteed lifetime income.
In general terms, successful retirement expenditure planning can be defined as ensuring a
dependable post-tax income stream for life to meet expected needs, with insurance strategies to
cover the key risks that could significantly upset the plan together with a ‘rainy day’ fund to provide
the flexibility for when insurance is either unavailable or uneconomic. It is important to ensure that
first ‘essential’ and then ‘adequate’ income levels are as secure as possible. Adequate income is an
income which better reflects a retiree’s needs taking account of past living standards. Some
flexibility can be retained initially around how and when income between an ‘essential’ level and a
‘adequate’ level is secured. The closer the cost of securing ‘adequate’ income is to total wealth, the
more important it is to use annuitization products as soon as possible. Much more flexibility can
apply to wealth beyond the ‘adequate’ level, as ‘desirable’ spending tends to be more ad hoc (e.g.,
a world cruise) and is likely to compete with the wish to make bequests.
Planning and associated budgeting become particularly important in retirement on account of the
difficulty, if not impossibility, of returning to employment in order to generate additional income. The
first task in retirement is therefore to make a plan starting by comparing projected essential
expenditures against projected total after-tax income, including any DB pension, state pensions and
means-tested benefits, making allowance for any inflationary uprating. If there is an expenditure
deficit, the retiree needs to consider how the gap can be filled; this may require a reassessment of
adequate and essential expenditure. If there is an expenditure surplus – current as well as
projected in future years – the retiree can plan for some desirable expenditures. The retiree also
needs to assess potential risks and changes to both projected essential expenditures and projected
post-tax income arising from, say, tax changes or changes in circumstances (see snakes and
ladders above).
Turning to the different market segments, we begin with the low affluent and the mass market. Low
affluent retirees have very little savings, pension or housing wealth and therefore will be very reliant
on state support throughout their retirement. Most mass market retirees also have limited means:
£20,000.31 Since state pensions and benefits are the dominant source of retirement income for the
majority of these retirees (see Figure 5), mass market households are likely to have to accept a
relatively simple strategy. Their primary focus will be on achieving the optimal balance between the
size of their ‘rainy day’ fund and their level of guaranteed retirement income, taking into account any
implications of the size of the ‘rainy day’ fund on their entitlement to means-tested state benefits.32
A conventional annuity-based solution is probably going to be the best option for most of the mass
market. In practice, the mass market will rely heavily on the state and any housing equity will be
used to provide for health care and other retirement contingencies. Bequests, mainly in the form of
residual housing equity, will be typically left more by chance than design.
The position of the 20% minority fortunate enough to be in the mass affluent and high net worth
segments is different. For these retirees, retirement income and expenditure planning needs to be
looked at holistically.
The first point to recognize is that it is a very complex task to optimize the controlled rundown of a
retiree’s assets throughout their retirement, especially in the early years of retirement. Optimization
is particularly difficult for retirees in their 60s who are looking forward to a retirement of 20 years or
more. The investment strategy needs to be far more sophisticated in decumulation than in
accumulation. This is because of the lack of uncertainty around the duration of the payments and
the difficulty of recovering from adverse investment conditions if, at the same time, the retiree
needs to sell assets to provide income. Unlike mass market retirees who can rely on the majority of
their income being inflation protected by the state, the mass affluent need to take account of and
manage their inflation risk. Given the considerable doubt and uncertainty in the early years of
retirement, it generally makes sense for retirees to be as flexible as possible and retain control over
their assets if they can afford to do so.
Mass affluent pensioners should take early steps to top up their essential income and secure an
adequate base income using an index-linked annuity. They should also look to use insurance, if
available and cost effective, to reduce the uncertainty from adverse events. Housing equity has a
key role in any optimization strategy: it could provide a source of additional income utilizing equity
release. In addition, housing equity allows greater investment risk to be taken and it will often be
the main funding source for any bequests.
31
Association of British Insurers.
32
Fortunately, as people get older or, more strictly, as their remaining life expectancy decreases, the
optimization task becomes simpler. When life expectancy is less than 5 years, investment
considerations become easier as bonds or annuities and cash become the optimal core holding.
Also if and when people go into a nursing home, income expenditure becomes less volatile and
more predictable. Overall, there is a narrowing funnel of uncertainty based on life expectancy.
4.2 The optimal investment strategy including optimal age to annuitize
4.2.1 Males
The optimal investment and longevity strategy is complex and impossible to implement without
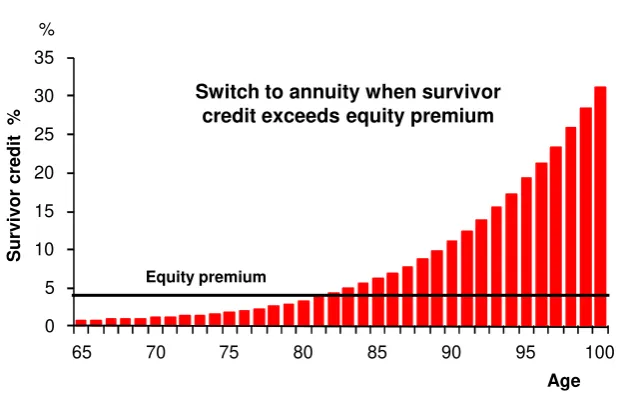
sophisticated stochastic dynamic programming software. Milevsky (1998) proposed a simple rule of
thumb for deciding when to switch from risky equity-linked assets to an annuity: this is when the
[image:23.595.137.448.430.629.2]survivor credit resulting from the mortality cross-subsidy exceeds the equity premium as shown in
Figure 10. The survivor credit for a particular age (x) can be thought of as the excess return on a level annuity over a risk-free investment: it is equal to the ratio of the proportion of the annuitants
aged x who die during a particular year (having survived to the beginning of that year) to the proportion of the annuitants aged x who survive the particular year. The equity premium is the excess return of equities over a similar risk-free investment.
0 5 10 15 20 25 30 35
65 70 75 80 85 90 95 100
Age Figure 10: The Milevsky switching rule
Su
rv
iv
or credit
%
Switch to annuity when survivor credit exceeds equity premium
%
Equity premium
Source: 100% PNMA00 2010 plus improvements in-line with CMI_2009_M [1.00%]; Survivor credit = qx/ (1-qx)
In the early years after retirement, the equity premium exceeds the survivor credit and, all other
things being as expected, the retiree receives a higher average return from investing in an
equity-dominated portfolio than investing in a fixed annuity. However, the level of the survivor credits
increases each year and eventually exceeds the equity premium. Figure 10 shows that the
This approach has been a popular rule of thumb used by advisers to determine when retirees
should annuitize. However, Wadsworth et al (2001) argue that investment-linked annuities fully
hedge longevity risk, while also benefiting from both survivor credits and higher average returns
than fixed annuities. Boardman (2006) showed that death benefits can be built into the annuity. In
simple terms, all contracts trade off death benefits against higher income. Ultimately optimization
comes down to what risk of a reduction in future lifetime income a retiree is prepared to accept for
retaining control over their assets.
If a retiree decides not to annuitize his retirement pot at the beginning of a year, then, all things
being equal, he will secure a lower income if he annuitizes at the end of the year.33 As Figure 10
shows, the survivor credits also increase exponentially as age increases, thereby, from a longevity
risk perspective, making annuitization essential for anyone without extensive wealth.
In the early years of retirement, it is investment risk, rather than the longevity risk, that is likely to be
more significant. The loss of survivor credits in the early years can result in a reduced income of a
few percent, but investment risk can have a much bigger impact. If annuitization is delayed a year,
then the fund can suffer significant investment losses, particularly if a large proportion of the fund is
held in equities. There could be some mitigation if the interest rates used in calculating annuity
prices increase to reflect a fall in equity values,34 but the impact can still be very significant. Of
course, if we believe in mean reversion, the retiree could delay annuitizing and wait for equity values
to recover. However if the retiree needs to continue to withdraw income when investment values are
depressed, the fund can run down rapidly. Depending on the scale of other wealth, the retiree might
not be able to delay annuitization and hence might be forced to buy an annuity with the proceeds
from a depleted pension fund. As the retiree gets older, the impact of any investment losses also
grows in importance, because the percentage of the fund that needs to be withdrawn each year to
maintain the desired income increases as the fund is run down.
For the vast majority, it is not a question of if, but when they should annuitize. The key questions
are: what is the optimal asset allocation and when should assets be annuitized? Increasingly
33
This occurs because if a retiree aged x (with life expectancy ex) lives to the end of the year, his life
expectancy at age x+1 (ex+1) will be greater than his life expectancy at the beginning of the year minus the
year he has survived (i.e., ex+1 > ex– 1). An approximation for the reduced income that the retiree will be able
to secure at the year end is (ex– 1) /ex+1. This yearly reduction factor decreases as x increases, so the impact
of not annuitizing grows exponentially as the retiree ages. The actual loss from a longevity risk perspective will be higher or lower depending on any changes that are made during the year to longevity assumptions around current levels and future improvements.
sophisticated stochastic dynamic programming models are being developed to attempt to answer
these questions.
The optimal investment strategy will be the one that maximizes the retiree’s expected utility or
welfare of expenditure over their expected remaining lifetime (Merton (1971), Blake et al. (2003)).
This requires knowledge of the retiree’s relative risk aversion (RRA)35 and bequest intensity36
parameters. These influence both the optimal weighting of risk assets (principally equities) in the
post-retirement investment portfolio and the optimal age to annuitize.
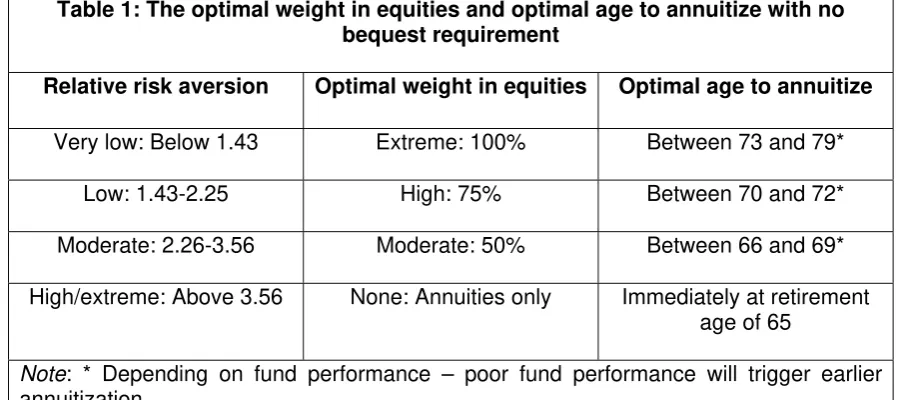
Table 1 shows typical ranges for four broad categories of risk aversion and the corresponding
optimal weight in equities and optimal age to annuitize for a UK male when there is no desire to
leave a bequest, according to a study by Blake et al. (2003) which used stochastic dynamic
programming to work out the optimal strategy over time under the assumption that the only assets
are pension assets. When risk aversion is low, a high equity exposure is optimal, and can even go
as high as 100% in the case where risk aversion is very low (i.e., close to being risk neutral). On the
other hand, when risk aversion is extreme, the optimal strategy is to purchase annuities and have
[image:25.595.72.523.416.616.2]no equity exposure at all.
Table 1:The optimal weight in equities and optimal age to annuitize with no bequest requirement
Relative risk aversion Optimal weight in equities Optimal age to annuitize
Very low: Below 1.43 Extreme: 100% Between 73 and 79*
Low: 1.43-2.25 High: 75% Between 70 and 72*
Moderate: 2.26-3.56 Moderate: 50% Between 66 and 69*
High/extreme: Above 3.56 None: Annuities only Immediately at retirement age of 65
Note: * Depending on fund performance – poor fund performance will trigger earlier annuitization
Source: Blake et al. (2003, Tables 5 and 6)
35
RRA determines the size of the risk premium that an investor would be willing to pay (as a percentage of
wealth) to avoid risk or volatility, where the risk premium = RRA x volatility and volatility measures the
standard deviation of the return on wealth (Pratt (1964)). Increasing RRA increases the risk premium and also implies that the percentage of wealth willingly exposed to risk decreases with the level of wealth. Blake (1996) reports studies which indicate that RRA can differ widely across individuals, ranging between 1 and 48.
36
In terms of deciding the best age to annuitize, the optimal dynamic strategy operates as follows. At
the beginning of each year, the retiree decides to annuitize immediately, or wait one more year,
taking into account the expected return on the fund, the probability of surviving the year and the
value, if any, attached to a bequest (of the remaining fund) if the retiree happened to die during the
year (Blake et al. (2003, Section 4.6)). If investments are performing well, it is more likely that
annuitization will be delayed.37 However, if the fund size is small, say as a result of very poor
performance over the preceding year, this is likely to bring forward the annuitization decision,
because the bequest value of the fund is small and the retiree can start to enjoy the maximum
possible secured lifetime income by electing to receive survivor credits.
When risk aversion is very low, it does not become optimal to annuitize until some age between 73
and 79, with the precise age depending on the individual’s actual RRA; at this age, it becomes
optimal to annuitize all remaining assets. For those who are extremely risk averse, it is optimal to
annuitize immediately on retirement. For those with low or moderate risk aversion, it is optimal to
annuitize some time between the ages of 66 and 72, depending on fund performance. Larger fund
sizes will delay the optimal age to annuitize.38
At each level of risk aversion, any value attached to the bequest delays annuitization. It also
increases the optimal equity weighting if the degree of risk aversion is already high, but has no
effect on the optimal equity weighting if the degree of risk aversion is moderate or low. These
[image:26.595.72.523.495.639.2]findings are shown in Table 2.
Table 2:The optimal weight in equities and optimal age to annuitize with a bequest requirement
Relative risk aversion Optimal weight in equities Optimal age to annuitize
Very low: Below 1.43 Extreme: 100% Between 75 and 80*
Low: 1.43-2.25 High: 75% Between 71 and 74*
Moderate: 2.26-3.56 Moderate: 50% Between 68 and 71*
High: 3.57-4.50 Low: 25% Between 66 and 67 *
Extreme: Above 4.50 None: Annuities only Immediately at retirement age of 65
Note: * Depending on fund performance – poor fund performance will trigger earlier retirement
Source: Blake et al. (2003, Tables 5 and 6)
37
The bequest motive considered above focused on ensuring capital in pension funds is not lost
prematurely. However, it is important to recognize that both pension and purchased life annuities
can be useful to the high net worth segment to secure the bequests they wish to make. By
annuitizing sufficient wealth to live comfortably in old age, the wealthy can ring fence assets that
they wish their children to inherit. In this sense, annuities are valuable in reducing the variability in
the amount of wealth to be inherited as well as the timing. With sufficient annuitization and long-term
care insurance in place, wealthy people can chose when the desired bequest takes place and can
minimize the tax consequences.
4.2.2 Females and couples
The analysis above was based on a single male life. It is interesting to consider the position for
females and couples. Figure 11 shows the distribution of deaths from age 65 for males, females and
couples. As expected, the ranges are greater for females and couples than males and the chances
of dying are lower at younger ages. The shape of the distribution curves becomes more skewed as
[image:27.595.137.441.447.624.2]age increases and variability increases, as shown in Figure 12.
Figure 11: Expected distribution of deaths from age 65 for males, females and couples
Source: 100% PNMA00 2010 plus improvements in-line with CMI_2009_M [1.00%]
0% 1% 2% 3% 4% 5% 6% 7%
65 70 75 80 85 90 95 100 105 110
Males Females Last survivor
Age
Pe
rc
e
n
ta
ge
dy
ing
38
0% 1% 2% 3% 4% 5% 6% 7% 8% 9%
85 90 95 100 105 110
Males Females Last survivor
Age
Pe
rc
e
n
ta
ge
dy
[image:28.595.139.445.134.305.2]ing
Figure 12: Expected distribution of deaths from age 85 for males, females and couples
Source: 100% PNMA00 2010 plus improvements in-line with CMI_2009_M [1.00%]
These lower early death rates are reflected in the level of the survivor credits as indicated in Figure
13 for males and females aged 65 in 2010. In particular, the level of the survivor credit in joint-life
cases is very small in the earlier years and while both individuals are still alive. The chances of all
of the annuity fund being released for redistribution to others is very low, as this will only occur if
both lives die during the year. The more likely scenario is that one of the lives will die and this will
allow the annuity provider to reduce the reserves it is holding on the contract, since it will now only
have to hold capital sufficient to pay a single life annuity. The release of reserves will be credited to
the survivor credit account to be shared across all the active annuities. However, in the early years
of the contract, both the chances of one of the lives dying and the level of the resultant release of
reserves is still small, hence the significantly lower survivor credits shown for joint lives compared
with either male or females separately.
This has a significant impact on the value of couples annuitizing early, a point which perhaps has
not been fully appreciated to date. For many mass affluent couples who are prepared to take
investment risk, it might well make sense not to be fully annuitized until they are well into their 80s if
regulations allow. Clearly, the age of annuitization should be brought forward if one partner dies, but
the key point is that the loss of benefit from the survivor credit will have been insignificant while both
partners are alive. The bottom line is that females and couples would, other things being equal,
0 4 8 12 16
65 67 69 71 73 75 77 79 81 83 85 87 89 AGE
0 4 8 12 16
65 67 69 71 73 75 77 79 81 83 85 87 89 AGE
0 4 8 12 16
65 67 69 71 73 75 77 79 81 83 85 87 89 AGE
Survivor credit Male life aged 65
Survivor credit Female life aged 65
[image:29.595.131.476.122.308.2]Survivor credit - Joint lives aged 65
Figure 13: Optimal age to annuitize is later for females and couples
% %
%
Source: 100% PNMA00 2010 plus improvements in-line with CMI_2009_M [1.00%]; Survivor credit = qx/ (1-qx)
4.3 The optimal level of annuitization
Although a lifetime annuity hedges longevity risk, there are some rational reasons for not fully
annuitizing retirement wealth with a conventional level annuity, the type that most people buy and
the only type that might be available in certain countries. A conventional level annuity does not:
Have the flexibility to change the pattern of income payments made in response to a changein circumstances after the annuity has been purchased.
Allow for bequests other than through limited death benefit options (Dynan et al. (2002), Davidoff et al. (2005)).
Hedge post-retirement inflation.
Allow for post-retirement investment opportunities and differing attitudes to risk.
Allow for poor health at retirement or long-term care costs.Now in developed annuity markets, such as the UK, annuities have been introduced to deal with
some of these issues. For example, it is possible to purchase a value-protected annuity,39 an
index-linked annuity, an investment-index-linked annuity, and an impaired life annuity. Indeed, those with
impaired lives, such as individuals with cancer, get higher guaranteed income levels to reflect this,
so the selection effect is minimized.40
39
Value-protected annuities currently provide capital protection on death up to age 75. The Coalition Government elected in May 2010 has indicated that it will allow lump sum death benefits beyond age 75.
40
Although the design of annuities has improved, they still lack flexibility once purchased and this is
an important weakness, given the length of time people live after retirement. A lifetime annuity does
not allow for precautionary expenditures, such as major repairs to home or car or lumpy medical
expenses. Credit markets are imperfect and it is difficult, if not impossible, to borrow against future
annuity payments, since they cannot be assigned. As a result, individuals tend to retain large
holdings of non-annuitized assets until very late in life to allow for such expenses (Sinclair and
Smetters (2004), Turra and Mitchell (2004), De Nardi et al. (2006)).
It is also important to examine other income sources in retirement and consider how these might
rationally influence the demand for annuities. For individuals who have significant DB pensions and
other sources of disposable wealth, being able to invest the fund directly, rather than annuitize,
might be a more rational option. Risk sharing within the family reduces the demand for joint-life
annuities (Kotlikoff and Spivak (1981), Brown and Poterba (2000)). Finally, annuities might be poor
value due to adverse selection and cost loadings (Friedman and Warshawsky (1990)). The money’s
worth of an annuity typically lies in the range 90-94% in competitive annuity markets and these cost
loadings are not large enough to offset the welfare gains from annuitization (Mitchell et al. (1999)).
In particular, the scale of the market in the UK has allowed individual life expectancies to be taken
into account, with the result that annuities have become much fairer.
‘All-or-nothing’ annuitization is likely to be suboptimal (Milevsky and Young (2002), Horneff et al.
(2008)). The phased purchase of annuities over time might be a better option, since it deals with
interest-rate risk (by helping to hedge the interest-rate cycle),41 the possibility that investment
returns might be higher in the phasing-in period, and the possibility, however unlikely, that expected
mortality rates might be higher in future.
4.4 Summary
To sum up, the key issues relating to the optimal timing and level of annuitization of DC pension
wealth are:
The value to securing the survivor credit which will be a function of remaining life expectancy and marital status.
either too high or too low – compared with the average annuitant. If the return offered to these individuals is too high, this can reduce the annuity provider’s profit. If the return offered to these individuals is too low, this reduces the value of the annuity they receive, i.e., its money’s worth.
41
The value of locking into a guaranteed lifetime income which will be a function of wealthincluding entitlement to state and DB pensions, required income level and expectations
concerning future inflation.
Attitude to risk.
The value attached both to bequests and to their timing.
The money’s worth of the annuity and hence the fairness of annuity pricing, taking account of the retiree’s health and life expectancy. If the money’s worth of available annuities is verypoor, it might be rational not to annuitize, despite the loss of longevity risk protection.
5. Why do people not behave optimally?
In the previous section, we discussed what people would do if they were behaving optimally in
retirement. But there is a lot of evidence to indicate that people do not behave optimally. For
example, retirees do not annuitize sufficiently, at least according to economic theory (Yaari (1965),
Davidoff et al. (2005)). Yet, as we have seen, conventional lifetime annuities provide the maximum
lifetime income, for a given amount of capital, to protect retirees from outliving their resources
however long they remain alive.42 Economists call this reluctance to annuitize the ‘annuity puzzle’.
Even individuals with shorter expected lifetimes, such as the low paid, would benefit from
annuitization (Brown (2003)).
A related issue is that, again according to economic theory, retirees do not dis-save sufficiently
during retirement. In the US, only 30% of assets are ‘life-cycle assets’, intended for decumulation
during the current working generation’s lifetime; the rest were inherited (Kotlikoff and Summers
(1981)). It is hard to believe that previous generations of US citizens planned to bequest so much of
their wealth to future generations: it is much more likely that these bequests were unintentional with
retirees’ spending too little for fear of running out of money.
In the previous section, we put forward some powerful rational reasons for not annuitizing all wealth,
e.g., it is optimal to retain flexibility if contingent spikes in expenditures cannot be insured against or
can only be insured at excessive cost. However, there are a whole range of behavioural reasons
why retirees do not annuitize a sufficient proportion of their retirement wealth:
● Inertia and procrastination: people have to make the active decision to start a retirement expenditure plan or purchase an annuity.
● Poor financial literacy: many, if not most, people do not recognize the importance of securing a basic understanding of retirement income provision and planning and, as a consequence,
42