Munich Personal RePEc Archive
Loan Officer Authority and Small
Business Lending.Evidence from a
survey.
benvenuti, m. and casolaro, l. and del prete, s. and mistrulli,
p. e.
September 2010
Online at
https://mpra.ub.uni-muenchen.de/26475/
Loan Officer Authority and Small Business Lending. Evidence from a Survey
Michele Benvenuti
Bank of Italy-Florence Branch
Luca Casolaro
Bank of Italy-Livorno Branch
Silvia Del Prete
Bank of Italy-Florence Branch
Paolo Emilio Mistrulli
Bank of Italy-Potenza Branch
Abstract
A vast literature has emphasized that small banks are at a comparative advantage in small business lending. In this paper, we show that apart from size, which is negatively correlated with bank specialization in small business lending, organizational characteristics affect bank loan portfolio choices. By using a unique dataset based on a recent survey of Italian banks, we find that after having controlled for bank size, a branch loan officer’s authority has a key role in explaining bank specialization in small business lending. In particular, banks which delegate more decision-making power to their branch loan officers are more willing to lend to small firms than other banks. We approximate loan officers’ authority by controlling for several factors which shape their incentives: loan officer turnover, the amount of money up to which they are allowed to lend autonomously, their role in loan approval and in setting loan interest rates, the kind of information (soft
versus hard information) used for screening and monitoring borrowers, and the structure of their compensation schemes.
JEL Classification: G21, L15, L22.
Keywords: Bank organization, Small business lending, Loan officer authority.
1. Introduction1
A large body of the literature has highlighted how large banks are less prone to lend to small
firms (e.g. Berger et al., 2005). An interpretation of the reluctance of large banks to lend to small firms
is that these borrowers are opaque and can only be screened and monitored on the basis of soft
information (Stein, 2002).
Soft information has two main characteristics that would make large banks less able to lend to
opaque borrowers than small intermediaries. Firstly, soft information is gathered by a face-to-face
interaction between lenders and borrowers which requires physical proximity. In principle, the
proximity to borrowers may be achieved by both large and small banks by means of their branch
networks. Banks would only need to delegate the acquisition of soft information to their branch managers.
However, the second key characteristic of soft information – i.e. poor verifiability – gives rise to
principal-agent problems when the production of information is delegated. According to Stein (2002), agency
problems are particularly severe in complex organizations where the information has to be passed on
through many hierarchical layers. By assuming that the size of the bank and the complexity of its
organization are closely linked, Stein’s model also predicts that large banks are less able than small
banks to produce soft information and thus to lend to opaque borrowers.
The model proposed by Stein (2002) is based on the intuition that the ability of branch managers
to credibly transfer soft information– i.e. the efficiency of the communication technology – depends on
the organizational complexity of the bank. Therefore the efficiency of the communication technology is
crucial for the functioning of the so-called internal capital market, by means of which internal financial
resources are allocated by bank headquarters among branches. Loan officers collect information, both
soft and hard, about potential borrowers and then compete for funds on the internal capital market.
Naturally, bank headquarters can assess the quality of the projects that branch officers want to finance
only on the base of verifiable information. This implies that, insofar as branch managers are unable to
harden it, soft information is useless for capital budgeting purposes. Thus, branch manager incentives
to exert effort in the production of soft information are positively related to their ability to show their
headquarters that the projects they want to finance are creditworthy. The efficiency of the
communication technology, by means of which information is passed on from branches to higher
organizational layers, is then strictly related to the level of the loan officer’s authority, that is the degree
of control over lending decisions that branch loan managers have.
1
Most of the extant empirical literature, investigating bank specialization in small business lending,
is based on the hypothesis that organizational complexity is directly related to bank size. In particular,
these contributions2 assume that large banks are more hierarchical (i.e. the head office is less prone to
delegate) and branch loan officers have less authority compared with small banks’ loan officers.
However, Albareto et al. (2008), by exploiting a very unique dataset on the organizational characteristics
of Italian banks recently surveyed by the Bank of Italy, showed that there is some heterogeneity in bank
organization even within banks of similar size. As a result, even if size is probably an important driver
affecting bank organizational design, it is not the only influence and it is also important to look at the
nature of the loan officer’s authority.
In this paper, we test whether the branch loan officer’s authority affects bank specialization in
small business lending. Differently from previous contributions, we do not proxy the branch loan
officer’s authority with the size of the bank. Indeed, we exploit the recent Bank of Italy survey which
has provided us with detailed information about the number of hierarchical layers involved in small
business lending approvals, loan officer turnover, the use of credit-scoring techniques, the amount of
money up to which branch loan officers are entitled to lend, and the type of loan officer compensation
schemes. Furthermore, the availability of detailed and new information on the organizational structure
of a very large sample of Italian banks gives us the opportunity to shed light on how the various
characteristics of bank organization interact among themselves.
While the relation between the loan officer’s authority and small business lending specialization is
clearly stated in Stein’s model (2002), it is not an easy task to test that link empirically. Firstly, following
Aghion and Tirole (1997), one has to be aware that there is a distinction between formal authority (the
right to decide) and real authority (the effective control over decisions), and econometricians may, at
best, reasonably observe the formal authority of a loan officer while, if they want to test Stein’s
predictions, they need to observe the real authority. Secondly, loan authority and effort depend on many
factors, such as: the maximum amount loan officers are entitled to lend on their own, their discretion in
setting rates, the kind of loan officer compensation scheme, and so on. On the one hand, these factors
interact among themselves in shaping the organizational design of the loan approval process within a
bank; on the other hand, formal organizational features may impinge on the real authority of a loan
officer in quite a complex way. For these reasons, instead of focusing on a specific organizational
characteristic, we adopt an holistic approach and we include in the estimation different organizational
variables which are presumably related to the real authority of the loan officer in order to investigate –
bank size being equal - how different organizational solutions in modelling local officers incentives can
affect bank portfolio choices. Thus, we contribute to the literature investigating the role of organization
2
for bank lending specialization in two main ways. Firstly, by using a unique dataset including
information about bank organizational features and lending techniques, we are able to go beyond the
comparison between large and small banks. Secondly, we show that small business lending
specialization is positively correlated with many bank organizational characteristics linked to a loan
officer’s authority; moreover, we support the idea that the link between formal and real authority may
be quite complex.3 In other terms, by using the survey on bank organization we are able to shed light
on some features of the organizational “black box”. However, we are aware that this is only the first
step to understanding the way that box may actually work.
Another insight of the paper is that we verify how the distance between the borrower and bank
headquarters (functional distance)4 interacts with the organizational scheme, especially with the loan
officer’s authority, and then affects bank willingness to lend to opaque borrowers. Following
Dell’Ariccia and Marquez (2004) and Hauswald and Marquez (2006), we argue that the ability of a
branch loan officer to transfer soft information to higher hierarchical layers – which is closely related to
the loan officer’s authority – depends not only on the organizational complexity of the bank, as put by
Stein (2002), but also on functional distance.5
Finally, we exploit geographical and sector heterogeneity across banks to compute our measure of
specialization in small business lending for each bank at the province/sector level. This allows us to
disentangle supply (bank organization characteristics) and demand factors (firm characteristics) and to
control also for some lending relationship features, like the functional distance between bank
headquarters and borrowers.
The main results of the analysis are the following. Firstly, our analysis confirms that large banks
are generally less prone to lend to small firms than other banks. This is in line with previous empirical
contributions, supporting the view that small banks are better able to lend to opaque borrowers
compared with larger intermediaries.
Secondly, we show that bank size is only part of the whole story since, even after having
controlled for it, bank organizational features help to explain differences across banks in small business
lending. In particular, our analysis suggests that loan officer authority is positively related to small
business lending activity. Indeed, we find the more loan officers are involved in loan approval decisions
and/or in setting loan pricing, the more the bank is specialized in small business lending.
3
Our econometric specification is not able to avoid endogeneity problems and our results cannot therefore be interpreted as causal effects.
4
To the best of our knowledge, Alessandrini et al. (2005 and 2008) were the first to use this definition, in opposition to the physical proximity between borrowers and bank branches (the so-colled operationaldistance).
5
Conversely, the amount of money up to which loan officer may lend autonomously is negatively
correlated with bank specialization in small business finance. This result is due to the fact that the
amount of money loan officers are entitled to lend does not necessarily entail a greater authority for
loan officers. Indeed, this result is consistent with the hypothesis that loan officers gain private benefits
by expanding the overall amount of money they lend (the so-called empire-building hypothesis).
Consequently, they can more easily expand their lending portfolio when they are entitled to grant a
larger amount of money per each contract. In this way, they obtain the same overall branch target by
lending to a smaller number of borrowers. Furthermore, by assuming that bank debt is a good proxy
for firm size and opaqueness they can save on soft information-gathering efforts.
We also find that, banks which give greater importance to soft information in lending decisions are
more willing to lend to small businesses, consistently with the view that small firms are opaque
borrowers and that their creditworthiness assessment is largely based on proprietary information. Small
business lending specialization is also negatively affected by loan officers’ turnover. This result suggests
that loan officers’ efforts to gather soft information are less if they stay at a given branch for a shorter
time.
In the same direction, our econometric analysis indicates that the distance between bank
headquarters and borrowers (functional distance) affects the availability of lending to small businesses: the
shorter the distance between dealing partners, the higher the bank specialization in small business
finance. This is consistent with the hypothesis that functional distance lowers the capability of branch
loan officers to credibly pass on soft information to higher hierarchical layers of the bank, reducing
their ability to compete for internal resources and, as a consequence, the specialization of banks in
lending to opaque borrowers too.
The rest of the paper proceeds as follows. Section 2 describes the data and the econometric
methodology. Section 3 presents the empirical findings. Section 4 concludes.
2. Data and methodology
2.1 Sources of data
In 2007 the Bank of Italy surveyed the lending practices in use by Italian banks at the end of
2006. More than 300 banks participated in the survey, accounting for 83 per cent of the overall Italian
banking system’s lending to firms. Leasing and factoring companies, branches of foreign banks, and
consumer credit banks were not included in the survey since these intermediaries are highly specialized
in specific segments of the credit market. The sample covers almost all Italian banks, except for the
bankers allowed the questionnaire to be designed so as to avoid potential misunderstandings; secondly,
ex-post interviews helped fill missing information and clarify erratic answers.
Banks participating in the survey were questioned about lending to small enterprises: the
number of hierarchical layers involved in the decision to grant a loan, the kind of information required
in order to make a lending decision (soft versus hard information), and information about branch loan
officers, such as the amount of money up to which they are allowed to lend autonomously, the speed
of their turnover, and their compensation schemes (see Albareto et al., 2008).6
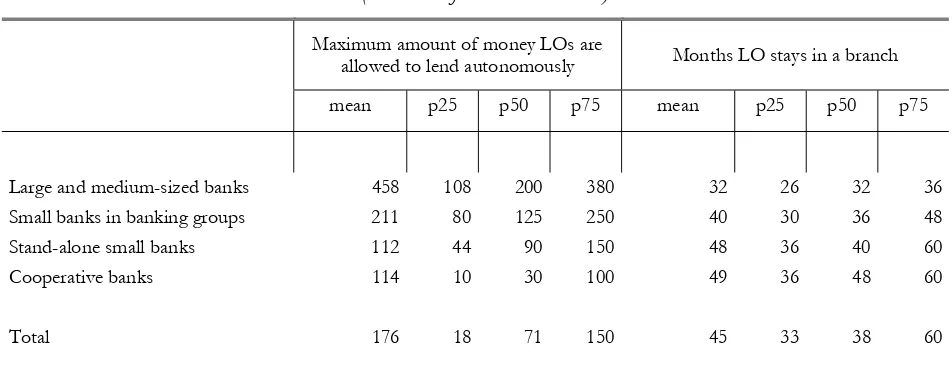
Initial evidence for bank organization suggests that loan officer power delegation and turnover
generally increase with bank size (Table 1), but a certain variability in these organizational features
persists within homogenous groups of banks sharing a similar governance scheme. Furthermore, the
adoption of different lending techniques (e.g. soft information or rating systems) also shows mixed
solutions across groups of banks (Table 2).
We then match the information obtained from the survey with bank Supervisory Reports
allowing us to compute a measure of specialization in lending to small businesses at both sector (23
sectors) and geographical level (103 provinces) for each bank participating in the survey. We also use
bank balance sheet data to compute control variables to take into account bank-level characteristics
affecting portfolio composition. After a cleaning procedure to detect outliers, 239 banks remain.
Since the main obstacle of the econometric exercise is to proxy the local officer’s real authority,
because this is not directly observable, we adopt a pragmatic approach. In particular, it is reasonable to
assume that both loan officers’ decisional power and their efforts depend crucially on organizational
design (in term of decentralization and control). Thus, we use a set of bank organizational controls to
capture local officers’ authority.
2.2 The research question and the econometric set-up
The main aim of the econometric analysis is to verify whether banks which delegate more real
authority to their loan officers (that we approximate with various bank organizational features) are
more oriented to small business lending, as suggested by Stein (2002).
Our baseline regression is a cross-section of the following type:
i i i iz i j z
ijz f Organization SoftInformation CreditScoring Disth Bank Sector Geography
SHSE , , , , , ,
6
The dependent variable (SHSE), which ranges between 0 and 1, is the outstanding amount of
loans, granted by bank i to small businesses (with less than 20 employees) of sector j and headquartered
in province z, as a share of the overall amount of lending to non-financial firms of sector j
headquartered in province z, granted by bank i.
We have computed bank specialization in small business finance separately for each
province/sector pair to which a bank lends. In this way we are able to disentangle loan demand factors
– which vary at both sector and geographical level – and supply factors and in particular bank
organizational characteristics – which vary at the bank level. To avoid eventual bias due to minimal
amounts of lending, we drop all bank/sector/province observations accounting for less than 0.002 per
cent of bank-level total loans.7 Since the bank organizational characteristics are observed at the end of
2006, our measure of bank specialization in small business finance has been computed as the average of
the four 2007 quarters. In this way we mitigate both endogeneity and seasonality problems. The
econometric exercise is carried out by an OLS estimation and the results are checked with a tobit
regression since our dependent variable is bounded between 0 and 1.
We investigate the impact of different factors on bank specialization in small firm finance.
Firstly, Organizationi is our key set of variables, controlling for bank organization
characteristics related to a loan officer’s real decision-making power (see Table 3 for more details). In
particular, we include in the estimation variables focusing on:
- the scope of the power delegated (i.e. the amount of finance up to which loan officers may
autonomously lend, their discretion in setting interest rates or asking for collateral);
- the turnover policy adopted by banks;8
- whether loan officers play a relevant role in the loan approval process or not;
- the kind of reward scheme: some bank headquarters may place a greater emphasis on branch
profitability, while others may be more oriented to pursue a loan volume target or risk mitigation.
Bank lending specialization could also be affected by the type of lending technologies adopted
(Berger and Udell, 1995 and 2002). In order to control for their impact we use two dummy variables.
On the one hand, SoftInformationi is a dummy that is equal to 1 if, according to the survey, bank i
considers soft information as “crucial”, “very important” or “important” in lending decisions. Since this
kind of information is difficult to verify, if banks require loan officers to base their lending decisions on
7
The value corresponds at the 10th percentile of the bank level total loan distribution. Alternative thresholds do not affect
our main results.
8
qualitative information or on personal knowledge, this implies that loan officers are largely
autonomous. On the other hand, CreditScoringi is a dummy that is equal to 1 if a bank has
introduced a rating system mainly to monitor and control borrowers’ creditworthiness.
Moreover, we also take into account that the distance between borrowers and bank
headquarters can affect the ability of loan officers to pass information along the hierarchy, which then
lowers the ability of loan officers to compete in the internal capital market. To this aim we compute a
dummy variable (DISTh) that is equal to 1 if the province9 where borrowers are headquartered is the
same province where the lending bank i has its headquarters. We have adopted a discrete measure for
functional distance since most of lending relationships are concentrated within the province where both
the lender and the borrower are located.
Finally, Banki is a vector of variables taking into account other bank-level characteristics, such as
size, risk and cost efficiency, potentially correlated with portfolio composition, while Sectorj and
Geographyz are respectively firm sector and province dummies, controlling for loan demand factors.
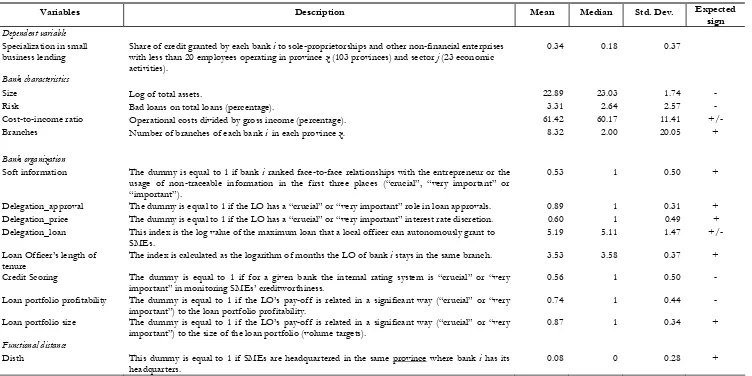
Descriptive statistics are reported in Table 3, which shows further information on the definition
of variables employed in the econometric analysis.
3. Results
3.1 Basic regressions
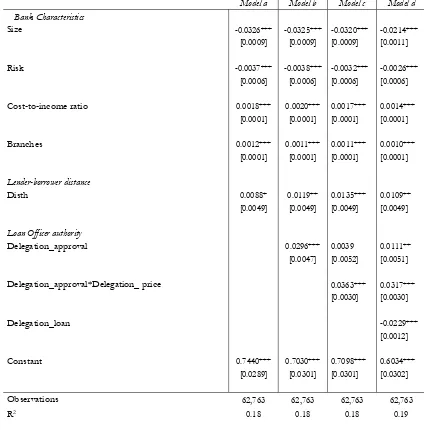
Results are reported in Table 4. In the first model (model a) we have regressed our measure of
bank specialization in small business finance over some bank and firm characteristics. In particular,
after having controlled for loan demand factors, i.e. for the sector of activity and the province where
the firm is headquartered (sector and province dummies), we find evidence supporting the view that
bank size (Size) affects lending portfolio choices. In line with many other papers (e.g. Berger et al.,
2005), our results show that large banks are less prone than small banks to lend to small firms. In
particular, moving from the 25th percentile of the bank size distribution to the 75th percentile, the share
of lending to small firms decreases by about 9 percentage points. In the first model, we also control for
the number of branches a bank has in the province where the borrowers are headquartered (Branches).
We find that, other things being equal, banks are more prone to lend to opaque borrowers in local
markets where their network of branches is larger. Our interpretation is that, since lending to small
firms is mostly based on soft information and this information may be gathered only at a local level, a
9
large branch network helps banks to collect soft information, thus making easier to screen and monitor
opaque firms.
We also control for the functional distance between the borrower’s and the lender’s
headquarters. In particular, Disth is a dummy which equals 1 if the firm is headquartered in the same
province where the bank has its headquarters, 0 otherwise. We find that bank specialization in small
business lending is higher when the lender and the borrower are functionally close.
The following equations add controls for loan officer authority. The main aim is to verify
whether or not bank size fully captures all relevant organizational characteristics of banks affecting loan
officer authority and then banks’ lending choices. Briefly, we investigate whether, for any given bank
size, additional controls for loan officer authority have some explanatory power for bank specialization
in small business lending. If this is the case, that would imply that there is some heterogeneity in terms
of organizational structure among banks of the same size and that bank size does not capture all the
significant characteristics of bank organization.
First of all we control for the scope of loan officer delegation (model b). In particular,
delegation_approval is a dummy variable which is equal to 1 if banks participating in the survey reported
that the role of branch officers in loan approval is “important”,10 and 0 otherwise. We find that
compared with banks which delegate less power to their loan officers, banks reporting that loan officer
power is “large” are more prone to lend to small businesses; in particular, their share is 2.9 percentage
points greater. We consider this variable as crucial to capture the scope of the power delegated to loan
officers that, within reason, goes beyond the strict approval decision. Indeed, it is reasonable to think
about loan approval delegation as a pre-requisite for delegating the decision about specific loan contract
covenants. For example some banks may place more emphasis than others on the discretion loan
officers may have to set loan interest rates, while others may stress more the quantity of money loan
officers are entitled to lend on their own initiative. Model c) then adds a measure of loan officers’
discretion in setting interest rates. The dummy delegation_price equals 1 if price discretion is
“important”,11 0 otherwise. We then interact this variable with
delegation_approval. Results suggest that,
conditional on having being delegated the power to approve loans, branch officers’ incentives in
gathering soft information and then in lending to small business are even greater when they have some
discretion to set interest rates. In particular, the share of small business lending is on average 4.2 per
cent greater for banks which delegate significant decision-making power to loan officers both in
approving loan requests and setting interest rates.
Another component of loan officer authority might be the amount of finance up to which
he/she is entitled to lend on his/her own initiative to each borrower. We then plug into the equation
10
See Table 3 for many details on variable definition.
11
(model d) another control variable which is defined as the logarithm of the maximum amount of money
loan officers are entitled to lend to any single borrower (delegation_loan). We get a negative sign for the
coefficient of delegation_loan, which means that the specialization of banks in small business lending is
decreasing in terms of the amount of money loan officers are entitled to lend on their initiative. To
interpret this result one has to take into account three aspects of lending. First, there is a strict positive
correlation between firm size and the size of the loan. Second, firm opaqueness correlates positively
with the firm size. Third, the effort loan officers have to exert in order to screen and monitor firms is
positively correlated with firm opaqueness. Thus, when loan officers are able to choose among a wider
set of loan contracts – because their headquarters have defined a higher threshold for the amount loan
officers may lend on their own initiative – they tend to finance a set of larger firms which therefore
allows them to lend the same amount of money overall while exerting less effort in screening and
monitoring borrowers compared with the case in which they lend to a set of smaller firms.12 The
negative coefficient for delegation_loan indicates that loan officers tend to switch to less opaque
borrowers when the amount they can lend to each of them increases.
3.2 Loan officer tenure and lending technologies
In this section, we test whether banks’ specialization in small business lending depends on loan
officer turnover and the lending technologies adopted. We argue that both sets of variables may affect
loan officer incentives: the tenure of loan officers at a given branch may affect their ability to benefit
from efforts to gather soft information, which requires a prolonged interaction with borrowers.
Lending technologies may differ in the use of soft or hard information. When a bank puts more
emphasis on hard information (e.g. by adopting credit scoring techniques), this may entail a reduction
in the capability of loan officers to have control over lending decisions (i.e. loan officer’s real authority)
thus deterring soft information acquisition.
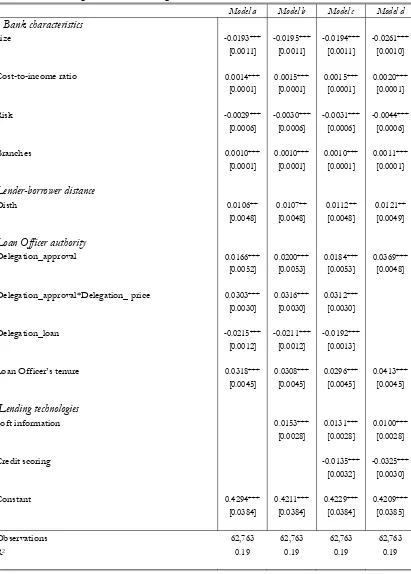
Model a) in Table 5 includes a control for the time spent by loan officers at a branch (Loan
Officer Tenure). The coefficient for this regressor is positive and statistically different from zero,
showing that banks which are more prone to lend to small firms allow a longer interaction of loan
officers with the local credit market.13 This result is consistent with the hypothesis that the investment
in soft information requires a longer time to yield some return. As a consequence, loan officers have
greater incentives to invest in soft information if their stay at the same branch is expected to be longer,
otherwise their efforts will mostly benefit incoming loan officers.
12
Note that, even if the variable delegation_loan refers to SMEs, there is a positive and strong correlation between the maximum amount of money loan officers may lend to SMEs and the amount they may lend to larger firms.
13
Another aspect which may affect loan officer authority is the kind of information considered
more important within the bank. Equation b) includes a dummy variable (Soft Information), which is
equal to 1 if banks make greater use of soft information than hard information and 0 otherwise. We find that
the coefficient for the prevalence of soft information is positive and significant too (the relevance of soft
information increases the share of small business lending by more than 1 per cent), reinforcing the
interpretation that small business lending requires relationship lending technology. Similarly, by adding
a control for the use of credit scoring techniques (credit scoring), we get a negative coefficient (the impact
on small business lending ranges between 1 and 3 per cent) for this variable (model c), indicating that
the use of hard information is negatively related to the specialization of banks in small business lending.
Finally, model d) includes only one measure of loan officer power delegation (delegation) while it
keeps the control for loan officer tenure and the use of soft information. This more parsimonious
specification is used in the rest of the paper as a benchmark (baseline) equation.
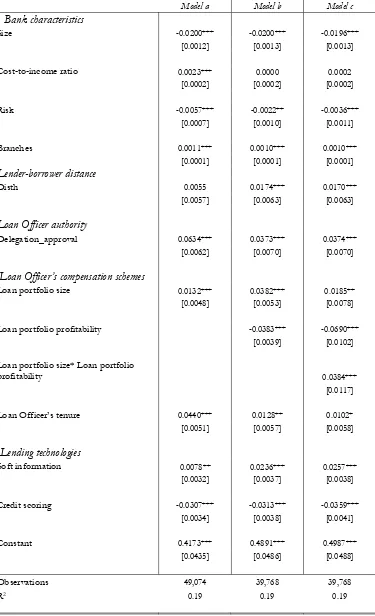
3.3 Loan officer compensation schemes
In this section we take into account the characteristics of the loan officer compensation
schemes (Table 6). In particular, we add some variables which are related to the variable component of
loan officer pay-off. Since in general loan officers get a bonus on the base of short-run portfolio
performance, one has to keep in mind when interpreting the relative coefficients that these variables are
short-run constraints. First, we plug a dummy variable (loan portfolio size) that equals 1 if the size of the
loan portfolio held by loan officers is a stringent constraint, and 0 otherwise. In other words, we
compare banks which put great emphasis on lending portfolio size targets (loan portfolio size =1) with
other banks which do not. Model a) shows that if loan portfolio size is a stringent constraint then loan
officers are more prone to lend to small firms. For those banks, the share of business lending is 1.3 per
cent greater. This result is consistent with the view that when loan officers are rewarded for the
expansion of a loan portfolio per se, they are less worried about lending to opaque borrowers whose
ex-post profitability may depend on information which has been observed by them but that could not be
transferred in a credible way to headquarters.
Model b) includes another control for the loan officer compensation scheme. In particular, the
dummy loan portfolio profitability equals 1 if the profitability of the overall loan portfolio held by the
branch manager is a stringent constraint, 0 otherwise. We find that the coefficient for profitability
targets is negative (the impact on small business specialization is more than 3 per cent) indicating that
lending to opaque firms requires an investment in soft information which yields some return in the
By interacting loan portfolio profitability and loan portfolio size (model c) we may also check whether
the effect of loan portfolio profitability differs among banks which put a higher emphasis on the size of
loan portfolio than other banks. The coefficient for this interaction term (model c) is positive, signalling
that the effect of profitability constraints is smoothed by the quantity constraint. In other terms, the
profitability constraint is less stringent when banks also emphasize quantity targets. Loan officers are
therefore less concerned with generating returns in the short-run since they are also rewarded better if
they expand their lending overall.
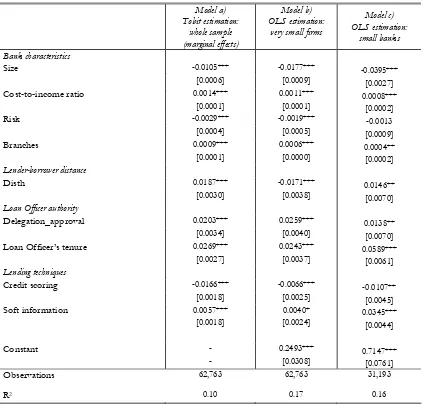
3.4 Robustness checks
In order to check the robustness of our main findings, we run some alternative econometric
exercises on our baseline specification (Table 5, model d).
First, since our measure of bank specialization in small business lending is computed as a share
(defined between 0 and 1), it can be considered as censored variable. Under this assumption, it would
be more feasible to estimate our parameters using a tobit methodology. Secondly, we verify how our
results are robust to a more severe measure of bank specialization in small business lending (e.g. firms
with less than 5 employees). Table 7 (respectively, models a and b) shows that our baseline results are
mostly confirmed and that findings are not affected by a different definition of our dependent variable
or by different estimation techniques. In particular, the more important the role of the loan officer in
loan approval process, the higher the bank specialization in small business finance. Moreover, banks
which put much emphasis on the use of soft information in lending to opaque borrowers or which
invest in loan officer tenure show a higher orientation towards small business finance.14
Even within banks of comparable size we observe wide heterogeneity in terms of organizational
characteristics. Looking at Tables 1 and 2, it is possible to note some meaningful differences in
organization and lending techniques between large and small banks, especially for banks not belonging
to groups. In particular, large banks exhibit on average higher loan officer turnover and delegation in
lending to small firms; furthermore, large intermediaries usually assign less importance to soft
information and make greater use of credit scoring systems in loan approvals. We then investigate
whether our results are driven by some non-linear effect related to bank size. In order to confirm that
our results, once we have controlled for size, are capturing this “within group” heterogeneity, we run
our baseline regression only for the sub-sample of small banks. Table 7 (model c) shows that our results
14 It is important to point out that when we consider bank orientation towards very small firms (those with less than 5
are robust also in a more homogenous group of banks by size; this evidence allows us to be confident
that our main results are not just driven by a non linear-size effect.
4. Conclusions
In this paper we investigate whether bank organization characteristics affect bank specialization
in lending to small firms. By using a unique dataset based on a survey of Italian banks, we are able to go
beyond the traditional large versus small banks comparison. We also exploit detailed data on lending
activity at province level to investigate how the “functional distance” between bank headquarters and
borrowers affects bank specialization.
Our main findings are the following. In line with previous results, we support the idea that bank
size negatively affects bank specialization in small firm finance due to small banks’ comparative
advantage in investing in soft information gathering and assessing opaque borrowers’ creditworthiness.
Moreover, we argue that, apart from size, a bank’s organizational features (loan officer-specific ones)
play an important role in explaining its orientation to small business lending.In particular, we show that
the higher the real involvement of the branch officer in the loan approval process, as well as in setting
interest rates, the higher the bank specialization in financing small and opaque firms. In the same
direction, we find that the longer the local officer stays at the same branch, the more banks are focused
on small business finance; experience gained over time can improve a loan officer’s ability to establish
long-lasting and informative relationships with opaque borrowers. We also find that the amount of
money up to which loan officer may lend autonomously is negatively correlated with bank
specialization in small business finance. This result is consistent with the hypothesis that loan officers
gain private benefits by expanding the overall amount of money they lend (the so-called empire
building hypothesis). In this way, they obtain the same overall branch target by lending to a smaller
number of borrowers, thus saving soft information gathering effort.
Bank specialization in small business lending depends crucially on lending technologies, too.
Banks more involved in soft information gathering exhibit a greater share of credit granted to small firms,
while the improvement of internal rating systems (mainly to monitor borrowers’ creditworthiness)
negatively affects small business lending orientation, giving a prominent role to hard information.
Finally, we show that banks are less prone to finance small firms in those provinces that are far
from their headquarters. This is in line with Hauswald and Marquez’s study (2006) and Mistrulli and
Casolaro’s (2008) findings, showing that functional distance is a proxy for lender-borrower asymmetric
information problems.
All in all, our results suggest that, consistently with Stein’s model (2002), an increase in a loan
officer’s authority is positively correlated with bank specialization in small business lending. However,
authority (the right to decide) and real authority (the effective control over decisions). Indeed, we control
for a rich set of formal rules (loan officer’s tenure, the power delegated to loan officers, both in terms
of the size of the loan and the interest rate charged, the structure of loan officers’ compensation
References
Aghion P. and Tirole J. (1997), “Formal and Real Authority in Organizations”, Journal of Political
Economy, 1, 1-29.
Albareto G., Benvenuti M., Mocetti S., Pagnini M. and Rossi P. (2008), “L’organizzazione dell’attività
creditizia e l’utilizzo di tecniche di scoring nel sistema bancario italiano: risultati di un’indagine
campionaria”, Questioni di Economia e Finanza, Banca d’Italia, n. 12.
Alessandrini, P., M. Croci and Zazzaro A. (2005), “The Geography of Banking Power: the Role of
Functional Distance”, BNL Quarterly Review, 235, 129-67.
Alessandrini P., Presbitero F. and Zazzaro A. (2008), “Banks, Distances and Financing Constraints for
Firms”, Review of Finance, forthcoming.
Berger A. and Udell G. (1995), “Relationship Lending and Lines of Credit in Small Firm Finance”,
Journal of Business, July.
Berger A. and Udell G. (2002), “Small Business Credit Availability and Relationship Lending: The
Importance of Bank Organizational Structure”, The Economic Journal, 112, February, pp. 32-53.
Berger A., Miller N., Petersen M., Rajan R., Stein J. (2005), “Does Function Follow Organization
Form? Evidence from the Lending Practices of Large and Small Banks”, Journal of Financial
Economics, 76, 237-70.
Cerquiero G., Degryse H. and Ongena S. (2007), “Distance, Bank Organizational Structure and Credit”,
mimeo, Tilburg University.
Degryse H., Laeven L. and Ongena S. (2007), “The Impact of Organizational Structure and Lending
Technology on Banking Competition”, Tilburg, CentER-Tilburg University.
Dell’Ariccia G. and Marquez R. (2004), “Information and Bank Credit Allocation”, Journal of Financial
Economics, 72, 185-214.
Ferri G. (1997), “Branch manager turnover and lending efficiency: local vs. national banks”, BNL
Quarterly Review, Special issue, March.
Hauswald R. and Marquez R. (2006), “Competition and Strategic Information Acquisition in Credit
Markets”, Review of Financial Studies, 3, 967-1000.
Jimenez G., Salas-Fumas V. and Saurina J. (2008), “Organizational Distance and Use of Collateral for
Business Loans”, Documento de Trabajo, 0816, Banco de España.
Mistrulli P. E. and Casolaro L. (2008), “Distance, Lending Technologies and Interest Rates”, Bank of
Scott J. (2006), “Loan officer turnover and credit availability for small firms”, Journal of Small Business
Management, 44, 544-62.
Stein J. (2002), “Information Production and Capital Allocation: Decentralized versus Hierarchical
Firms”, Journal of Finance, 5, 1891-1921.
Udell G. (1989), “Loan Quality, Commercial Loan Review and Loan Officer Contracting”, Journal of
Table 1 – Bank size, delegation and loan officer (“LO”) turnover (1)
(thousand of euros and months)
Maximum amount of money LOs are
allowed to lend autonomously Months LO stays in a branch
mean p25 p50 p75 mean p25 p50 p75
Large and medium-sized banks 458 108 200 380 32 26 32 36 Small banks in banking groups 211 80 125 250 40 30 36 48 Stand-alone small banks 112 44 90 150 48 36 40 60 Cooperative banks 114 10 30 100 49 36 48 60
Total 176 18 71 150 45 33 38 60
(1) According to the size classification provided by the Bank of Italy, small banks have total assets of less than 7 billion euros.
Table 2 – Bank size, loan pricing and lending technology (1)
(units)
Loan officers allowed to lower interest rate by
more than 25 b.p.
Importance of soft information (2)
Credit scoring crucial in lending decision (3)
YES NO YES NO YES NO
Large and medium-sized banks 2 12 20 17 30 6 Small banks in banking groups 3 38 38 36 32 19
Stand-alone small banks 0 14 10 10 8 9
Cooperative banks 12 91 108 76 45 41
Total 17 155 176 139 115 75
[image:18.595.58.527.354.582.2]
Table 3 – Descriptive statistics on the estimation sample
Variables Description Mean Median Std. Dev. Expected
sign
Dependent variable Specialization in small business lending
Share of credit granted by each bank i to sole-proprietorships and other non-financial enterprises with less than 20 employees operating in province z (103 provinces) and sector j (23 economic activities).
0.34 0.18 0.37
Bank characteristics
Size Log of total assets. 22.89 23.03 1.74 -
Risk Bad loans on total loans (percentage). 3.31 2.64 2.57 -
Cost-to-income ratio Operational costs divided by gross income (percentage). 61.42 60.17 11.41 +/- Branches Number of branches of each bank i in each province z. 8.32 2.00 20.05 +
Bank organization
Soft information The dummy is equal to 1 if bank i ranked face-to-face relationships with the entrepreneur or the usage of non-traceable information in the first three places (“crucial”, “very important” or “important”).
0.53 1 0.50 +
Delegation_approval The dummy is equal to 1 if the LO has a “crucial” or “very important” role in loan approvals. 0.89 1 0.31 + Delegation_price The dummy is equal to 1 if the LO has a “crucial” or “very important” interest rate discretion. 0.60 1 0.49 + Delegation_loan This index is the log value of the maximum loan that a local officer can autonomously grant to
SMEs.
5.19 5.11 1.47 +/-
Loan Officer’s length of tenure
The index is calculated as the logarithm of months the LO of bank i stays in the same branch. 3.53 3.58 0.37 +
Credit Scoring The dummy is equal to 1 if for a given bank the internal rating system is “crucial” or “very important” in monitoring SMEs’ creditworthiness.
0.56 1 0.50 -
Loan portfolio profitability The dummy is equal to 1 if the LO’s pay-off is related in a significant way (“crucial” or “very important”) to the loan portfolio profitability.
0.74 1 0.44 -
Loan portfolio size The dummy is equal to 1 if the LO’s pay-off is related in a significant way (“crucial” or “very important”) to the size of the loan portfolio (volume targets).
0.87 1 0.34 +
Functional distance
Disth This dummy is equal to 1 if SMEs are headquartered in the same province where bank i has its headquarters.
Table 4 Loan Officer authority and small business lending: basic regressions
The dependent variable, ranging between 0 and 1, is the outstanding amount of loans granted by bank i to small businesses (firms with less than 20 employees) of sector j and headquartered in province z, as a ratio of the overall amount of lending to non-financial firms of sector j headquartered in province z, and granted by bank i. Sector and province dummies are always included. Robust standard errors are reported in brackets. * significant at 10%; ** significant at 5%; *** significant at 1%.
Model a Model b Model c Model d Bank Characteristics
Size -0.0326*** -0.0325*** -0.0320*** -0.0214*** [0.0009] [0.0009] [0.0009] [0.0011]
Risk -0.0037*** -0.0038*** -0.0032*** -0.0026*** [0.0006] [0.0006] [0.0006] [0.0006]
Cost-to-income ratio 0.0018*** 0.0020*** 0.0017*** 0.0014*** [0.0001] [0.0001] [0.0001] [0.0001]
Branches 0.0012*** 0.0011*** 0.0011*** 0.0010*** [0.0001] [0.0001] [0.0001] [0.0001]
Lender-borrower distance
Disth 0.0088* 0.0119** 0.0135*** 0.0109**
[0.0049] [0.0049] [0.0049] [0.0049]
Loan Officer authority
Delegation_approval 0.0296*** 0.0039 0.0111** [0.0047] [0.0052] [0.0051]
Delegation_approval*Delegation_ price 0.0363*** 0.0317***
[0.0030] [0.0030]
Delegation_loan -0.0229***
[0.0012]
Constant 0.7440*** 0.7030*** 0.7098*** 0.6034*** [0.0289] [0.0301] [0.0301] [0.0302]
Observations 62,763 62,763 62,763 62,763
Table 5 Loan Officer authority and small business lending:
Loan Officer turnover and lending technologies
The dependent variable, ranging between 0 and 1, is the outstanding amount of loans granted by bank i to small businesses (firms with less than 20 employees) of sector j and headquartered in province z, as a ratio of the overall amount of lending to non-financial firms of sector j headquartered in province z and granted by bank i. Sector and province dummies are always included. Robust standard errors are reported in brackets. * significant at 10%; ** significant at 5%; *** significant at 1%.
Model a Model b Model c Model d Bank characteristics
Size -0.0193*** -0.0195*** -0.0194*** -0.0261*** [0.0011] [0.0011] [0.0011] [0.0010]
Cost-to-income ratio 0.0014*** 0.0015*** 0.0015*** 0.0020*** [0.0001] [0.0001] [0.0001] [0.0001]
Risk -0.0029*** -0.0030*** -0.0031*** -0.0044*** [0.0006] [0.0006] [0.0006] [0.0006]
Branches 0.0010*** 0.0010*** 0.0010*** 0.0011*** [0.0001] [0.0001] [0.0001] [0.0001]
Lender-borrower distance
Disth 0.0106** 0.0107** 0.0112** 0.0121**
[0.0048] [0.0048] [0.0048] [0.0049]
Loan Officer authority
Delegation_approval 0.0166*** 0.0200*** 0.0184*** 0.0369*** [0.0052] [0.0053] [0.0053] [0.0048]
Delegation_approval*Delegation_ price 0.0303*** 0.0316*** 0.0312*** [0.0030] [0.0030] [0.0030]
Delegation_loan -0.0215*** -0.0211*** -0.0192*** [0.0012] [0.0012] [0.0013]
Loan Officer’s tenure 0.0318*** 0.0308*** 0.0296*** 0.0413*** [0.0045] [0.0045] [0.0045] [0.0045]
Lending technologies
Soft information 0.0153*** 0.0131*** 0.0100***
[0.0028] [0.0028] [0.0028]
Credit scoring -0.0135*** -0.0325***
[0.0032] [0.0030]
Constant 0.4294*** 0.4211*** 0.4229*** 0.4209*** [0.0384] [0.0384] [0.0384] [0.0385]
Observations 62,763 62,763 62,763 62,763
Table 6 Loan Officer authority and small business lending:
Loan Officer compensation schemes
The dependent variable, ranging between 0 and 1, is the outstanding amount of loans granted by bank i to small businesses (firms with less than 20 employees) of sector j and headquartered in province z, as a ratio of the overall amount of lending to non-financial firms of sector j headquartered in province z, and granted by bank i. Sector and province dummies are always included. Robust standard errors are reported in brackets. * significant at 10%; ** significant at 5%; *** significant at 1%.
Model a Model b Model c Bank characteristics
Size -0.0200*** -0.0200*** -0.0196***
[0.0012] [0.0013] [0.0013]
Cost-to-income ratio 0.0023*** 0.0000 0.0002 [0.0002] [0.0002] [0.0002]
Risk -0.0057*** -0.0022** -0.0036***
[0.0007] [0.0010] [0.0011]
Branches 0.0011*** 0.0010*** 0.0010***
[0.0001] [0.0001] [0.0001]
Lender-borrower distance
Disth 0.0055 0.0174*** 0.0170***
[0.0057] [0.0063] [0.0063]
Loan Officer authority
Delegation_approval 0.0634*** 0.0373*** 0.0374*** [0.0062] [0.0070] [0.0070]
Loan Officer’s compensation schemes
Loan portfolio size 0.0132*** 0.0382*** 0.0185** [0.0048] [0.0053] [0.0078]
Loan portfolio profitability -0.0383*** -0.0690***
[0.0039] [0.0102]
Loan portfolio size* Loan portfolio
profitability 0.0384***
[0.0117]
Loan Officer’s tenure 0.0440*** 0.0128** 0.0102* [0.0051] [0.0057] [0.0058]
Lending technologies
Soft information 0.0078** 0.0236*** 0.0257***
[0.0032] [0.0037] [0.0038]
Credit scoring -0.0307*** -0.0313*** -0.0359*** [0.0034] [0.0038] [0.0041]
Constant 0.4173*** 0.4891*** 0.4987***
[0.0435] [0.0486] [0.0488]
Observations 49,074 39,768 39,768
Table 7 Loan Officer authority and small business lending:
robustness checks
In the tobit estimation (model a) the dependent variable, ranging between 0 and 1, is the outstanding amount of loans granted by bank i to small businesses (firms with less than 20 employees) of sector j and headquartered in province z , as a ratio of the overall amount of lending to non-financial firms of sector j headquartered in province z, and granted by bank i. In the OLS estimation in model b the dependent variable, ranging between 0 and 1, is the outstanding amount of loans granted by bank i to very small businesses (firms with less than 5 employees) of sector j and headquartered in province z,as a ratio of the overall amount of lending to non-financial firms of sector j headquartered in province z, and granted by bank i. In the OLS estimation in model c the dependent variable, ranging between 0 and 1, is the outstanding amount of loans granted by small bank i to small businesses (firms with less than 20 employees) of sector j and headquartered in province z, as a ratio of the overall amount of lending to non-financial firms of sector j headquartered in province z, and granted by bank i. Sector and province dummies are always included. Robust standard errors are reported in brackets. * significant at 10%; ** significant at 5%; *** significant at 1%. Model a) Tobit estimation: whole sample (marginal effects) Model b) OLS estimation:
very small firms
Model c) OLS estimation:
small banks
Bank characteristics
Size -0.0105*** -0.0177*** -0.0395***
[0.0006] [0.0009] [0.0027]
Cost-to-income ratio 0.0014*** 0.0011*** 0.0008***
[0.0001] [0.0001] [0.0002]
Risk -0.0029*** -0.0019*** -0.0013
[0.0004] [0.0005] [0.0009]
Branches 0.0009*** 0.0006*** 0.0004**
[0.0001] [0.0000] [0.0002]
Lender-borrower distance
Disth 0.0187*** -0.0171*** 0.0146**
[0.0030] [0.0038] [0.0070]
Loan Officer authority
Delegation_approval 0.0203*** 0.0259*** 0.0138**
[0.0034] [0.0040] [0.0070]
Loan Officer’s tenure 0.0269*** 0.0243*** 0.0589***
[0.0027] [0.0037] [0.0061]
Lending techniques
Credit scoring -0.0166*** -0.0066*** -0.0107**
[0.0018] [0.0025] [0.0045]
Soft information 0.0057*** 0.0040* 0.0345***
[0.0018] [0.0024] [0.0044]
Constant - 0.2493*** 0.7147***
- [0.0308] [0.0761]
Observations 62,763 62,763 31,193