The Effects of Future Climate Change on Energy
Consumption in Residential Buildings in China
D. H. C. Chow, M. Kelly, J. Darkwa
Centre for Sustainable Energy Technologies (CSET), University of Nottingham, Ningbo, China. Email: David.Chow@nottingham.edu.cn
Received August 2013
ABSTRACT
China is currently going through a phase of rapid mass urbanisation, and it is important to investigate how the growing built environment will cope with climate change, to see how the energy consumption of buildings in China will be af-fected. This is especially important for the fast-growing cities in the north, and around the east and south coasts. This paper aims to study the effects of future climate change on the energy consumption of buildings in the three main cli-mate regions of China, namely the “Cold” region in the north, which includes Beijing; the “Hot Summer Cold Winter” region in the east, which includes cities such as Shanghai and Ningbo; and the “Hot Summer Mild Winter” region in the south, which includes Guangzhou. Using data from the climate model, HadCM3, Test Reference Years are generated for the 2020s, 2050s and 2080s, for various IPCC future scenarios. These are then used to access the energy perform-ance of typical existing buildings, and also the effects of retrofitting them to the standard of the current building codes. It was found that although there are reductions in energy consumption for heating and cooling with retrofitting existing residential buildings to the current standard, the actual effects are very small compared with the extra energy consump-tion that comes as a result of future climate change. This is especially true for Guangzhou, which currently have very little heating load, so there is little benefit of the reduction in heating demand from climate change. The effects of retro-fitting in Beijing are also limited, and only in Ningbo was the effect of retroretro-fitting able to nullify the effects of climate change up to 2020s. More improvements in building standards in all three regions are required to significantly reduce the effects of future climate change, especially to beyond 2020s.
Keywords: Climate Change; Energy Consumption; Residential Buildings; Retrofitting; Urbanisation
1. Introduction
Over the last 30 years, the rapid growth in the Chinese economy has led to a drastic increase in energy con-sumption, where the building sector is responsible for around 27.5% of the national total energy consumption [1-3]. Zhong has shown that this percentage could to rise to 40% over the next 20 years as more buildings will be constructed [4]. This together with occupants demanding a higher level of indoor comfort will lead to a steeper increase in heating and cooling loads. At the end of 2010, the whole of China has over 43 billion square metres of constructed area, however, only 4% - 5% meet the na-tional building energy standards, and the other 95% - 96% are classified as “intensive energy consumers” [5, 6].
In China, the lifespan of most buildings is short even by modernist standards. This high turnover rate, along with the recent construction boom, has resulted in an existing building stock that is fairly young. Zhu and Lin [7] project that by 2015, half of China’s existing building
stock will have been built after 2000. Chen Huai, director of the policy research centre at the Ministry of Housing and Urban-Rural Development, stated himself in 2010 that “Only those homes built after 1999 are likely to be preserved in the longer term” due to perceived safety and functionality deficits in older buildings [8].
cli-mer and Warm Winter” zone with the city of Guangzhou.
2. Climates in Beijing, Ningbo and
Guangzhou
The cities of Beijing, Ningbo and Guangzhou were se-lected to represent situations in the three different climate zones in China. The buildings in each zone have very different heating and cooling needs. For example, Guang-zhou in the “Hot Summer Warm Winter” zone has very little heating demand, as its winters are relatively mild. Ningbo, on the other hand, has significant heating and cooling loads, but overall, it can be considered relatively mild over the whole year. Beijing also has hot summers, especially around August and early September. Winter temperatures can be very cold. The changes in the next 100 years due to climate change for the three climate zones are also significantly different.
2.1. Current Climates
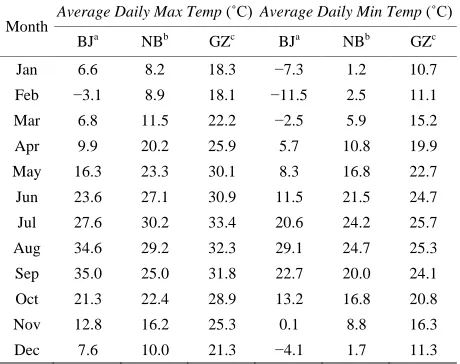
[image:2.595.309.539.114.296.2]Long running series of real observed data from weather stations in the three cities were not available for this study, so in-depth study of the characteristics of different weather parameters could not be conducted. However, data can be extracted from the existing Test Reference Years, from the Energy Plus program. Table 1 shows the average monthly values for daily maximum and mini-mum temperatures for the three selected cities.
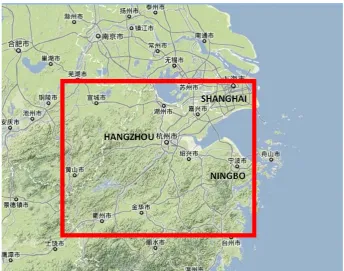
Figure 1. Climate zones in China.
Sep 35.0 25.0 31.8 22.7 20.0 24.1
Oct 21.3 22.4 28.9 13.2 16.8 20.8
Nov 12.8 16.2 25.3 0.1 8.8 16.3
Dec 7.6 10.0 21.3 −4.1 1.7 11.3
aBJ denotes Beijing; bNB denotes Ningbo; cGZ denotes Guangzhou.
2.2. Future Climate Change
The Hadley Centre model (HadCM3) [10] is used to pro-vide future climate data for this study. HadCM3 is a global climate model developed at the Hadley Centre of the Met Office in the UK. It is a Coupled Atmosphere- Ocean General Circulation Model (AOGCM), in which the globe is divided into grid boxes, each measuring 2.50˚× 3.75˚. The gridboxes used in this paper are grid-box numbers 1952 (which encloses the area with latitude from 38.75˚N to 41.25˚N, and longitude from 114.375˚E to 118.125˚E, and includes the city of Beijing), 2337 (which encloses the area with latitude from 28.75˚N to 31.25˚N, and longitude from 118.125˚E to 121.875˚E, and includes the city of Ningbo and Shanghai), and 2623 (which encloses the area with latitude from 21.25˚N to 23.75˚N, and longitude from 110.625˚E to 114.375˚E. and includes the city of Guangzhou). Figure 2 shows the extent of the gridbox for Ningbo. Unlike weather data from typical weather years, HadCM3 only provide daily values for parameters such as maximum, minimum and average temperatures, humidity, wind speed and down-ward short-wave flux (solar radiation), based on 4 main future scenarios on carbon emissions, A1F, A2, B2 and B1 [11]. For example, the A2 scenario describes a very heterogeneous world where slow and fragmented eco-nomic growth is assumed, together with a continuation of population growth and continued increase in CO2 emis-sion into the twenty-first century [12].
2.3. Compilation of Future Test Reference Years
[image:2.595.84.262.585.717.2]Figure 2. Area covered by gridbox 2337 of HadCM3.
onto existing Test Reference Year. For this study, data from HadCM3 are separated into four periods: 2000s (which includes all data from 1990-2009); 2020s (which includes data from 2010-2039); 2050s (which includes data from 2040-2069) and 2080s (which includes data from 2070-2099), and the average monthly temperatures under the A2 scenario from resulting TRYs for Ningbo is shown in Figure 3.
2.4. Changes in Temperature and Solar Radiation
For the three selected gridboxes from HadCM3, the in-creases in temperature are steady from 2000s to 2020s, and then subsequent increases to 2050s and 2080s. How-ever, there are significant differences in the changes be-tween the gridboxes. For the Beijing gridbox, the in-creases are more rapid for daily maximum temperature values, and also faster for the summer months than the winter months. The opposite is true for the Guangzhou gridbox, where rises for daily minimum temperatures are faster, and increases are also bigger for the winter months. For the Ningbo gridbox, the rises are similar between months and also between daily maximum, average and minimum values.
For future changes in solar radiation, there are reduc-tions in all three gridboxes, particularly during the winter period. For the Guangzhou gridbox, there is also signifi-cant and continuing decrease in solar radiation in the summer months. For the Beijing and Ningbo gridboxes,
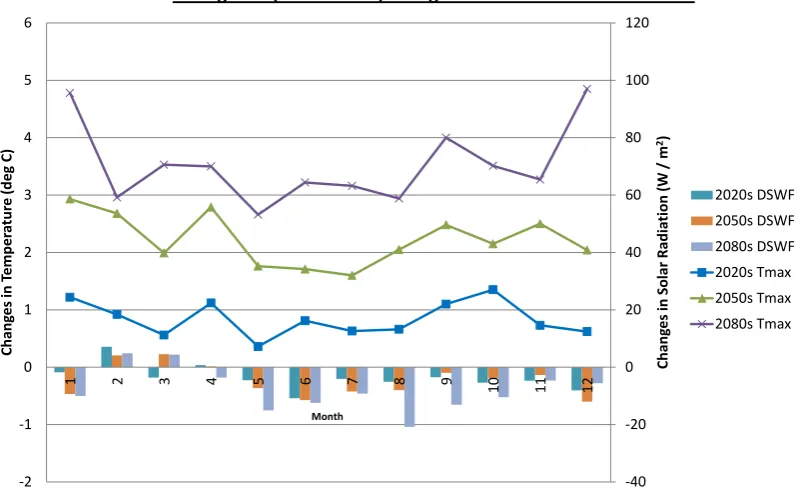
there are slight increases in summer, but the increases are lower than the decreases in winter. The general increases in summer could be explained by a possible reduction in cloud cover in the future. However, as the future atmos-phere becomes more turbid, the general trend of solar radiation in the future is one that is decreasing. Figure 4 shows the changes in daily maximum temperature and solar radiation changes in the Guangzhou gridbox from 2000s to 2020s, 2050s and 2080s.
3. Methodology
The study used a typical residential building in the three cities and ran the whole year heating and cooling de-mands for the existing building specifications as well as standards complying with the latest building codes. This was conducted for current Test Reference Years and also Test Reference Years for 2020s, 2050s and 2080s, under various future scenarios.
3.1. Typical Building Used for Study
Figure 3. Average monthly temperature for current and future TRYs for Ningbo (A2 scenario).
Figure 4. Changes in daily maximum temperature and solar radiation under the A2 scenario for Guangzhou.
value—although lacking in the prestige of historic struc-tures or the glamour of new designs, they form the foun-dation for daily urban life for many people.
Although not the worst-performing building type, the early building codes within which these buildings were constructed are quite low compared even to current codes
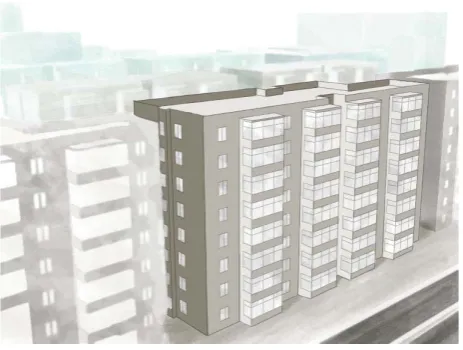
a decade later, and they are likely to be inadequately prepared for future climate change. Additionally, build-ings constructed in the midst of the construction boom, which focused on speed over quality, are now showing severe maintenance problems which require refurbish-ment and repair. Figure 5 shows an isometric view of the
0.0 5.0 10.0
1 2 3 4 5 6 7 8 9 10 11 12
Av
er
ag
Month
2080s
-40 -20 0 20 40 60 80 100 120
-2 -1 0 1 2 3 4 5 6
1 2 3 4 5 6 7 8 9 10 11 12 Ch
an
ge
s in
S
olar
R
ad
ia
tio
n
(W
/
m
2)
Ch
an
ge
s in
Te
m
pe
ra
tu
re
(d
eg
C
)
Month
Guangzhou (A2 Scenario) changes in Tmax and Solar Radiation
[image:4.595.99.498.380.629.2]Figure 5. Isometric view of the study building.
building type being studied.
The building and project site are both designed to be as generic as possible to facilitate high levels of compar-ison between the three study cities. The buildings sur-rounding the project site are a composite of similar sites in each of the three cities, and represent a primarily-res- idential neighbourhood with buildings of different ages. The apartment complex itself, located on the corner of the main streets, consists of nine identical buildings with a north-south orientation. Each building is eight stories tall and contains sixty-four apartments. Based on the av-erage values from surveys of similar apartment buildings conducted by Chen etal. [14,15], Gu etal. [16], and Hu
etal. [17], each apartment has 85 m2 of floor space, in-cluding two bedrooms, a bathroom, and a living room. For realism, it is assumed that the balcony space was originally designed as a balcony, and was later enclosed to provide additional living space in the apartment and raise its marketability; this is a common refurbishment strategy [18]. One building in the apartment complex, highlighted in blue in Figure 6 was used for the evalua-tion of retrofitting opevalua-tions.
3.2. Specification for “Current” Buildings
[image:5.595.58.290.87.262.2]Although Rousseau and Chen [19] describe older apart-ment buildings as having solid brick construction with concrete floors, bricks were banned for construction in 1999 due to the increasing environmental impacts asso-ciated with their demand. Fernández [20] and Huang, et al. [21] report that most multi-family residential build-ings constructed in the past two decades are made from reinforced concrete. The demand for concrete in China’s building sector in general [22] also lends confidence that reinforced concrete is the most representative material for this building type. Generally, the assemblies selected for the study building are adapted directly from the ma-terial intensities for residential buildings compiled by
Figure 6. Theoretical site for the study building.
Fernández [20], with confirmation or modifications as needed from other studies and based on building code requirements for each city. Wang, etal. [23], Aden, etal. [24], and Chen, etal. [25] report on the use of expanded polystyrene (XPS) insulation in buildings, and where in-sulation is required to meet the building code, XPS insu-lation was added in 10 mm increments until the maxi-mum compliant U-value was reached. All material prop-erties were adapted from Anderson [26].
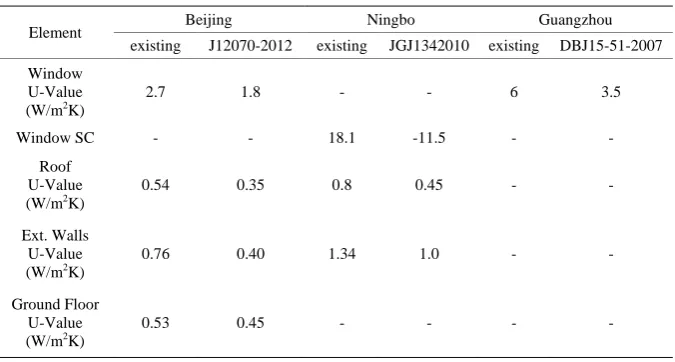
For windows and the glazed balcony doors, double- paned glazing with aluminium frames were assumed for Beijing and Ningbo, as single-glazed panes do not meet the building codes. Guangzhou’s residential building code does not specify an insulation level for glazing, but in-stead mandates shading coefficients as solar gains are more important than thermal losses in its warmer climate. Thus, for Guangzhou, single-pane reflective glass was assumed for all glazing. Figure 7 summaries the con-struction specifications for the building in each city.
3.3. Specification for Renovated Buildings
Figure 7. Construction specifications for the study building in each city.
Table 2. Updated envelope element requirements in the most recent building codes.
Element Beijing Ningbo Guangzhou
existing J12070-2012 existing JGJ1342010 existing DBJ15-51-2007
Window U-Value
(W/m2K)
2.7 1.8 - - 6 3.5
Window SC - - 18.1 -11.5 - -
Roof U-Value
(W/m2K)
0.54 0.35 0.8 0.45 - -
Ext. Walls U-Value
(W/m2K)
0.76 0.40 1.34 1.0 - -
Ground Floor U-Value
(W/m2K)
0.53 0.45 - - - -
the “Hot Summer Warm Winter” region, the most recent public building standard is used as a substitute represen-tation of current practices.
The comfort range where no heating and cooling would be supplied to the building was set as 18˚C to 26˚C for all three cities.
4. Results
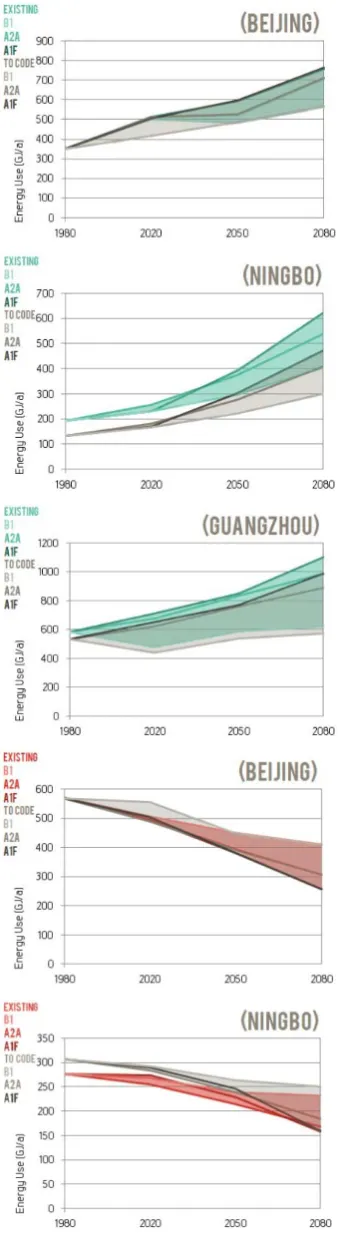
Figure 8 shows the monthly space conditioning (heating and cooling) requirements for the residential building under the current climate, and also for 2020s, 2050s and 2080s under the A2 scenario. Figure 9 shows a compar-ison between the predicted heating and cooling energy consumption of the existing and equivalent code-com- pliant buildings, under the A2 scenario, together with the most severe A1F and the least severe B1 scenarios. While the new code results in some stabilization, ulti-mately the underlying patterns of increasing risk are pre-served. In Guangzhou, the code improvements lower cooling loads by 6.2%, rising to a maximum of 10.7% by 2080 in the A1F scenario and 8.5% in the A2 scenario. For the building in Beijing, the results are mixed, with a
less than 1% reduction in heating loads under the A1F and A2 scenarios. In the B1 scenario, heating loads are predicted to increase compared to the existing building. Cooling loads follow an opposite pattern, with a decrease in cooling energy under the B1 scenario and little effect otherwise. The effect of reducing direct solar gains in the most recent “Hot Summer Cold Winter” zone code in-creases heating loads by 9.7% in 1980. However, as ex-isting cooling loads are reduced by 46.1% and 2080 cooling loads are reduced by 31.0% - 34.0%, the result is largely positive when viewed over the entire century.
5. Conclusions
[image:6.595.130.468.275.456.2]Figure 8. Predicted monthly heating and cooling energy consumption at each horizon year under the A2 scenario.
enough to counter the effects of future climate change, regardless of which scenario the world follows in the future. For the case of Beijing, the differences between existing and retrofitted buildings are not great, for both heating and cooling demands, and there is greater in-crease in cooling load than the reduction in heating load, meaning that future energy consumption in the future will increase significantly, even with retrofitted buildings. As for Ningbo, this showed the biggest reduction in energy consumption with retrofitting. For both heating and cooling loads, a retrofitted building will have lower energy demands in 2020s compared with the existing building standard under the current climate. Depending on the scenario, this benefit may even extend to the 2050s for cooling demands.
[image:7.595.340.510.84.702.2]With all three cases, it is clear from the results that the current building standards will not be able to nullify the effects of future climate change, and more studies are
[image:7.595.75.270.86.482.2][1] Y. Wu, “China Building Energy Efficiency: Current Sta- tus, Issues, and Policy Recommendations,” China Minis- try of Construction, 2003.
[2] N. Zhou, “Energy Use in Commercial Buildings in China: Current Situation and Future Scenarios” 8th ECEEE Sum- mer Study, Lawrence Berkeley National Laboratory, 2007, pp. 1065-1071.
[3] D. G. Fridley, N. Zheng and N. Zhou, “Estimating Total Energy Consumption and Emissions of China’s Commer- cial and Office Buildings,” IBNL-248E, Lawrence Ber- keley National Laboratory, 2008.
[4] J. Zhong, “Development Approach of Renewable Energy and Building Integration Technology,” Solar Energy, Vol. 5, 2007, pp. 40-43.
[5] Y. Zheng, “Energy-Efficiency in Buildings: An Imminent Task,” Environmental Economy, Vol. 11, 2007, pp. 23- 24.
[6] T. Hong, “A Close Look at the China Design Standard for Energy Efficiency of Public Buildings,” Energy and Buildings, Vol. 41, No. 4, 2009. pp. 426-435.
[7] X. Zhu and B. Lin, “Sustainable Housing and Urban Construction in China,” Energy and Buildings, Vol. 36, 2004, pp. 1287-1297.
[8] Y. Qian, “China Daily: ‘Most Homes’ to Be Demolished in 20 Years,’” 2010.
http://www.chinadaily.com.cn/china/2010-08/07/content_ 11113982.htm
[9] G. Heggelund, A. Meier, S. Ohshita and S. Wiel, “Coop- erative Climate,” International Institute for Sustainable Development, 2008, Chapter 5.
[10] C. Gordon, et al., “A Simulation of SST, Sea Ice Extents Ocean Heat Transports in a Version of the Hadley Centre Coupled Model without Flux Adjustments,” Climate Dy- namics, Vol. 16, 2000. pp. 147-168.
[11] N. Nakicenovic, “Emissions Scenarios,” Intergovernmen- tal Panel on Climate Change, Cambridge University Press, 2000.
[12] WMO, UNEP, “IPCC Climate Change 2001, Summary for Policy Makers and Technical Summary of the Work-
dential Buildings in Some Cities of China,” Energy and Buildings, Vol. 42, 2010, pp. 136-146.
[16] Z. Gu, Q. Sun and R. Wennersten, “Impact of Urban Residences on Energy Consumption and Carbon Emis- sions: An Investigation in Nanjing, China,” Sustainable Cities and Society, Vol. 7, 2013, pp. 52-61.
[17] T. Hu, H. Yoshino and Z. Jiang, “Analysis on Urban Residential Energy Consumption of Hot Summer & Cold Winter Zone in China,” Sustainable Cities and Society, Vol. 6, 2013, pp. 85-91.
[18] H. Zhang and S. L. Lei, “An Assessment Framework for the Renovation of Existing Residential Buildings Re- garding Environmental Efficiency,” Procedia Social and Behavioural Sciences, Vol. 68, 2012. pp. 549-563.
[19] D. Rousseau and Y. Chen, “Sustainability Options for China’s Residential Building Sector,” Building Research & Information, Vol. 29, No. 4, 2001, pp. 293-301. [20] J. E. Fernández, “Resource Consumption of New Urban
Construction in China,” Journal of Industrial Ecology, Vol. 11, No. 2, 2007, pp. 99-115.
[21] T. Huang, et al., “Materials Demand and Environmental Impact of Buildings Construction and Demolition in China Based on Dynamic Material Flow Analysis,” Re- sources, Conservation and Recycling, Vol. 72, 2013, pp.
91-101.
[22] Y. Chang, R. J. Ries and Y. Wang, “The Embodied Energy and Environmental Emissions of Construction Projects in China: An Economic Input-Output LCA Mod- el,” Energy Policy, Vol. 38, 2010, pp. 6597-6603.
[23] Y. Wang, Z. Huang and L. Heng, “Cost-Effective As- sessment of Insulated Exterior Walls of Residential Bui- ldings in Cold Climate,” International Journal of Pro- ject Management, Vol. 25, 2007, pp. 143-149.
[25] S. Chen, et al., “Statistical Analyses on Winter Energy Consumption Characteristics of Residential Buildings in Some Cities of China,” Energy and Buildings, Vol. 43, 2011. pp. 1063-1070.