ORIGINAL RESEARCH ARTICLE
SIMULATION ANALYSIS AND EXPERIMENTAL RESEARCH
ON STRESS CONCENTRATION OF TEST TECHNIQUE
BASED ON INITIAL PERMEABILITY
*Ren Shangkun, Ren Xianzhi and Guo Feng
Key Laboratory of Nondestructive Testing (Ministry of Education), Nanchang Hangkong University,
Nanchang 330063
,
China
ARTICLE INFO ABSTRACT
Initial permeability measurement is an early evaluating method of micro-structure changes such as stress concentration and fatigue damage by measuring the change of initial permeability. The detection principle of permeability testing technology for ferromagnetic material was studied and analyzed. The ANSYS finite element simulation model was established, the excitation frequency parameters were optimized, and the changing law of the detection signal with the initial permeability of ferromagnetic material was analyzed. At same time testing platform for permeability testing have been built. Then use the optimized testing platform to complete the tensile testing of 45 steel, and the relationship between detection signal and the tensile stress was studied in further. The experimental result compare to simulating result, which are approximately the same. It indicates that the permeability testing technique is a new, feasible method, which with high testing sensitivity, has a broad application prospect.
*Corresponding author:
Copyright ©2017, Ren Shangkun et al.This is an open access article distributed under the Creative Commons Attribution License, which permits unrestricted use, distribution, and reproduction in any medium, provided the original work is properly cited.
INTRODUCTION
Ferromagnetic metal component, such as steel, is widely used in various industries, which have bored different forms of external loads, high temperature and high pressure for a long time, then the internal organizational structure will change, and then leading to the formation of stress concentration and microscopic damage. So efficient and reliable nondestructive testing (NDT) technology is vital for the early diagnosis of engineering equipment (Gao, 2011). However,the normal NDT methods, such as ultrasonic method, permeation method and eddy currents method, are sensitive to macroscopic volume defects of ferromagnetic component, instead of the stress concentration and early fatigue damage. X-ray testing only can detect surface residual stress by inspecting material lattice distortion, and its equipment is very complex and expensive (Li Xiao-meng, 2014 and Rabung, 2014). The initial permeability is expressed as the initial stage of the magnetizing process property, which is the ratio of the
magnetic induction intensity to the magnetic field strength, and which expressed the magnetic conductivity ability of the material. The initial permeability μ of ferromagnetic material varies with the intensity of magnetic field H. According to the initial permeability change under low field condition, the sensitivity of measuring stress concentration and fatigue damage condition will be more sensitive(Ren Shangkun and Xu Zhenhan, 2014). Under the condition that the external magnetic field strength H remains unchanged, the change of initial permeability of ferromagnetic material will lead to the change of magnetic induction intensity in the magnetic circuit and cause the change of the detection signal in the detection coil (Tomáš, 2004). By extracting and detecting the voltage signals in the induction coil, the initial permeability of ferromagnetic material can be reflected (Tomáš, 2004; Stupakov et al., 2004). Detection technology based on the initial permeability is a new non-destructive evaluation method, the micro-structure damage changes of ferromagnetic specimen can be detected by the and change of initial permeability, stress concentration, fatigue damage and
micro-ISSN: 2230-9926
International Journal of Development Research
Vol. 07, Issue, 09, pp.15373-15378, September, 2017
Article History:
Received 24thJune, 2017
Received in revised form 08thJuly, 2017
Accepted 29thAugust, 2017
Published online 30thSeptember, 2017
Available online at http://www.journalijdr.com
RESEARCH ARTICLE
OPEN ACCESS
Key words:
Non-destructive testing; Ferromagnetic material; Permeability;
ANSYS Simulation.
structural changes of the component can be evaluated in early (Tomáš, 2006; Ren, 2009 and Ren, 2010).
Principle of stress concentration detection based on initial permeability
Relationship model between stress and permeability
Polycrystalline ferromagnetic material is positive magnetostrictive, (λ>0). When the ferromagnetic material is subjected to stress, the deformation occurs and the initial permeability of the material changes. By measuring the variation of initial permeability, the stress concentration of the material can be inverted and deduced. When there is no applied tensile stress, assuming under the action of applied weak magnetic field of H, the ferromagnet was magnetized, the magnetic induction intensity express as B1, and the initial
permeability express as 1B1/H. The magnetic field energy per unit volume of a ferromagnetic material can be expressed as
1 1 / 2
W B H ;When exist applied tensile stress, assuming the magnetic induction intensity of ferromagnetic material is B2,and the initial permeability can be expressed as
2 B2/H
. The magnetic field energy per unit volume of a ferromagnetic material can be expressed as /2
2 2 BH
W .The
increment of magnetic field energy per unit volume of a ferromagnetic material caused by stress can be expressed as:
2 1 2 1
(
)
2
B
B H
W
W
W
………(1)The increment of magnetic field energy per unit volume caused by external stress also can be expressed as
W
(12). By the energy transformation theory,
W
W
,then,2 1
(
)
2
B
B H
2 1
(
H
H H
)
2
2
2 1
2
/ H
……….( )2It can be seen from the formula (2) that the initial permeability of ferromagnetic medium is closely related to the stress. The initial permeability decreases with the increase of stress, and variation of the initial permeability decreases with the increase of magnetic field. The coefficient of magnetostriction is related to the microstructure of the material and decreases slightly with the increase of stress, and the actual relationship between the initial permeability and the variation of stress deviates from the linear function. It shows that under low field conditions, stress will lead to a greater change in initial permeability and a higher sensitivity。It can be seen that when ferromagnetic material is subjected to load deformation, it can sensitively reflect the stress concentration degree and structural change state of the material by measuring the change of initial permeability.
Relationship model between initial permeability and detection signal
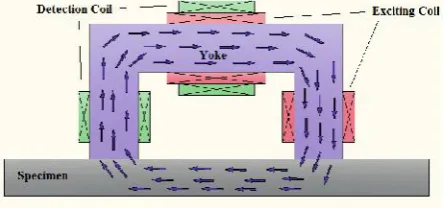
The sensor structure of the initial permeability detection technique is shown in figure 1. The magnetic yoke is wound
[image:2.595.324.547.159.263.2]with an exciting coil and a detecting coil, the magnetic induction flux produced by the exciting coil through the magnetic yoke and the test specimen forms a closed magnetic circuit. When the initial permeability of ferromagnetic specimens changes, the reluctance of the closed loop will change, and the magnetic flux of the yoke section will change, which will lead to the change of the induction signal in the test coil.
Fig. 1. Detection probe structure
For the detection sensor structure of the shown in Figure 1, according to Kirchhoff's first law and the second law of magnetic circuit,the change rate of magnetic flux density in the yoke can reflect the change of initial permeability of the specimen to be tested, moreover, the measurement of initial permeability of the test piece has higher detection accuracy. The rate of change in the flux density in the yoke can be output by sensing the coil (Ren Shangkun, 2014; Tomáš, 2004 and Tomáš, 2004). The relationship between the detection signal and the initial permeability is deduced. Set the number of turns of the test coil N, The magnetic flux density of the yoke and the sample are B1and B2respectively, the average equivalent
cross sectional areas of the magnetic yoke and the specimen were S1and S2respectively, the permeability of the magnetic
yoke and the specimen can be expressed µ1 and µ2
respectively,the magnetic flux of the magnetic yoke and the specimen were Φ1 and Φ2 respectively, the yoke forms a
closed magnetic loop with the specimen. The detection signal may be represented as:
dt
dB
NS
dt
d
u
1 1 1
……….(3)By the first law of magnetic circuit,
B
2
B
1S
1/ S
2,dt
dB
NS
dt
dB
NS
u
2 2 1 1
………..( )4Set excitation signal as
i
I
sin
t
, the the magnetic field intensity produced by the excitation signal can be expressed as:H
kI
sin
t
,k
as constant. Since the excitation signal is small, the resulting magnetic field is less intense. Under the condition of smaller magnetic field magnetization, the permeability of ferromagnetic material is initial permeability. formula (4) can be expressed as:dt
dH
NS
dt
dB
NS
u
2 2 22
………( )5The formula (5) indicates that the detection signal u is closely related to the sample to be tested, which can directly reflect the initial permeability of the sample.
15374 Ren Shangkun et al. Simulation analysis and experimental research on stress concentration of test technique based on initial permeability
structural changes of the component can be evaluated in early (Tomáš, 2006; Ren, 2009 and Ren, 2010).
Principle of stress concentration detection based on initial permeability
Relationship model between stress and permeability
Polycrystalline ferromagnetic material is positive magnetostrictive, (λ>0). When the ferromagnetic material is subjected to stress, the deformation occurs and the initial permeability of the material changes. By measuring the variation of initial permeability, the stress concentration of the material can be inverted and deduced. When there is no applied tensile stress, assuming under the action of applied weak magnetic field of H, the ferromagnet was magnetized, the magnetic induction intensity express as B1, and the initial
permeability express as 1B1/H. The magnetic field energy per unit volume of a ferromagnetic material can be expressed as
1 1 / 2
W B H ;When exist applied tensile stress, assuming the magnetic induction intensity of ferromagnetic material is B2,and the initial permeability can be expressed as
2 B2/H
. The magnetic field energy per unit volume of a ferromagnetic material can be expressed as /2
2 2 BH
W .The
increment of magnetic field energy per unit volume of a ferromagnetic material caused by stress can be expressed as:
2 1 2 1
(
)
2
B
B H
W
W
W
………(1)The increment of magnetic field energy per unit volume caused by external stress also can be expressed as
W
(12). By the energy transformation theory,
W
W
,then,2 1
(
)
2
B
B H
2 1
(
H
H H
)
2
2
2 1
2
/ H
……….( )2It can be seen from the formula (2) that the initial permeability of ferromagnetic medium is closely related to the stress. The initial permeability decreases with the increase of stress, and variation of the initial permeability decreases with the increase of magnetic field. The coefficient of magnetostriction is related to the microstructure of the material and decreases slightly with the increase of stress, and the actual relationship between the initial permeability and the variation of stress deviates from the linear function. It shows that under low field conditions, stress will lead to a greater change in initial permeability and a higher sensitivity。It can be seen that when ferromagnetic material is subjected to load deformation, it can sensitively reflect the stress concentration degree and structural change state of the material by measuring the change of initial permeability.
Relationship model between initial permeability and detection signal
The sensor structure of the initial permeability detection technique is shown in figure 1. The magnetic yoke is wound
with an exciting coil and a detecting coil, the magnetic induction flux produced by the exciting coil through the magnetic yoke and the test specimen forms a closed magnetic circuit. When the initial permeability of ferromagnetic specimens changes, the reluctance of the closed loop will change, and the magnetic flux of the yoke section will change, which will lead to the change of the induction signal in the test coil.
Fig. 1. Detection probe structure
For the detection sensor structure of the shown in Figure 1, according to Kirchhoff's first law and the second law of magnetic circuit,the change rate of magnetic flux density in the yoke can reflect the change of initial permeability of the specimen to be tested, moreover, the measurement of initial permeability of the test piece has higher detection accuracy. The rate of change in the flux density in the yoke can be output by sensing the coil (Ren Shangkun, 2014; Tomáš, 2004 and Tomáš, 2004). The relationship between the detection signal and the initial permeability is deduced. Set the number of turns of the test coil N, The magnetic flux density of the yoke and the sample are B1and B2respectively, the average equivalent
cross sectional areas of the magnetic yoke and the specimen were S1and S2respectively, the permeability of the magnetic
yoke and the specimen can be expressed µ1 and µ2
respectively,the magnetic flux of the magnetic yoke and the specimen were Φ1 and Φ2 respectively, the yoke forms a
closed magnetic loop with the specimen. The detection signal may be represented as:
dt
dB
NS
dt
d
u
1 1 1
……….(3)By the first law of magnetic circuit,
B
2
B
1S
1/ S
2,dt
dB
NS
dt
dB
NS
u
2 2 1 1
………..( )4Set excitation signal as
i
I
sin
t
, the the magnetic field intensity produced by the excitation signal can be expressed as:H
kI
sin
t
,k
as constant. Since the excitation signal is small, the resulting magnetic field is less intense. Under the condition of smaller magnetic field magnetization, the permeability of ferromagnetic material is initial permeability. formula (4) can be expressed as:dt
dH
NS
dt
dB
NS
u
2 2 22
………( )5The formula (5) indicates that the detection signal u is closely related to the sample to be tested, which can directly reflect the initial permeability of the sample.
Simulation analysis of test technology based on initial permeability
According to the measuring principle of the initial permeability detection technique, the yoke and ferromagnetic workpiece form a closed magnetic loop. When the ferromagnetic workpiece has structural changes such as stress concentration, the initial permeability changes, which will affect the induction signal in the test coil. With the aid of ANSYS software, a simulation model of initial permeability is established.
Establishment of simulation model
With the aid of ANSYS software, a three-dimensional finite element simulation model of initial permeability is established by using electromagnetic harmonic edge element (Edge) analysis method. In the detecting probe and a ferromagnetic workpiece model for peripheral air modeling, excitation coil and the detection coil of the CIRCUIT124 unit, other regional
selection of SOLID97 model, using the method of triangulation, establishment of the detection model. Set the out space of detection probe and out space of ferromagnetic workpiece are air, and the simulation model is established. The excitation coil and the detecting coil use CIRCUIT124 units, and other regions select SOLID97 units to build models,using the method of subdivision, the whole detection model is established. In loading solution,by changing the parameters of the CIRCUIT124,the number of turns of the coil, the type of excitation source and the excitation frequency can be changed.
The simulation adopts the parameterized command flow modeling method. Through the setting of the corresponding parameters, the metal materials with different initial permeability and different kinds of detection probes can be simulated. Model U probes and ferromagnetic workpieces are shown in Figure 2.
Simulation analysis of optimizating excitation frequency: The excitation frequency has an important influence on the Table 1. The parameters of exciting AC voltage source
Parameters Exciting source
initial permeability coil turns N Resistivity of ferromagnetic unit
1 /Ω·m
Resistivity of air
1/Ω·m
AC voltage source U=2V 2000 300 1.1×10⁻⁷ 2.2×10⁸
[image:3.595.88.508.206.670.2]AC current source I=100mA 2000 300 1.1×10⁻⁷ 2.2×10⁸
Fig. 2. Inspection model diagram
(a) U=2V N=300 (b) I=100mA N=300
Fig. 3. Change relation of detection signal with excitation frequency 15375 International Journal of Development Research, Vol. 07, Issue, 09, pp. 15373-15378, September, 2017
Simulation analysis of test technology based on initial permeability
According to the measuring principle of the initial permeability detection technique, the yoke and ferromagnetic workpiece form a closed magnetic loop. When the ferromagnetic workpiece has structural changes such as stress concentration, the initial permeability changes, which will affect the induction signal in the test coil. With the aid of ANSYS software, a simulation model of initial permeability is established.
Establishment of simulation model
With the aid of ANSYS software, a three-dimensional finite element simulation model of initial permeability is established by using electromagnetic harmonic edge element (Edge) analysis method. In the detecting probe and a ferromagnetic workpiece model for peripheral air modeling, excitation coil and the detection coil of the CIRCUIT124 unit, other regional
selection of SOLID97 model, using the method of triangulation, establishment of the detection model. Set the out space of detection probe and out space of ferromagnetic workpiece are air, and the simulation model is established. The excitation coil and the detecting coil use CIRCUIT124 units, and other regions select SOLID97 units to build models,using the method of subdivision, the whole detection model is established. In loading solution,by changing the parameters of the CIRCUIT124,the number of turns of the coil, the type of excitation source and the excitation frequency can be changed.
The simulation adopts the parameterized command flow modeling method. Through the setting of the corresponding parameters, the metal materials with different initial permeability and different kinds of detection probes can be simulated. Model U probes and ferromagnetic workpieces are shown in Figure 2.
Simulation analysis of optimizating excitation frequency: The excitation frequency has an important influence on the Table 1. The parameters of exciting AC voltage source
Parameters Exciting source
initial permeability coil turns N Resistivity of ferromagnetic unit
1 /Ω·m
Resistivity of air
1/Ω·m
AC voltage source U=2V 2000 300 1.1×10⁻⁷ 2.2×10⁸
AC current source I=100mA 2000 300 1.1×10⁻⁷ 2.2×10⁸
Fig. 2. Inspection model diagram
(a) U=2V N=300 (b) I=100mA N=300
sensitivity of initial permeability measurement. Firstly, the optimum exciting frequency is determined by simulation. Under the condition of the initial permeability remaining unchanged of the ferromagnetic material, the relationship between the frequency and the detected signal is simulated by keeping the exciting voltage/current, keeping the number of turns of the exciting coil and keeping the number of turns of the detecting coil unchanged. According to the setting of the parameters in Table 1, the initial permeability of the ferromagnetic material is set at the same value, that is to say, to simulate different detection schemes for the same ferromagnetic material. U and I are the amplitude of an AC voltage source and an AC current source to be used. According to the different exciting frequencies, the changing laws of the detection signal in the ferromagnetic magnetic circuit and the air magnetic circuit with the exciting frequency were simulated and analyzed respectively. Ferromagnetic magnetic circuit express specimens to be ferromagnetic materials, and air magnetic circuit express the position of specimens to be the air. By analyzing and comparing the difference between the test signal in the ferromagnetic magnetic circuit and the air magnetic circuit, the optimum exciting frequency corresponding to the maximum signal difference can be obtained.
Figure 3 express the relationship of the detection signal with the excitation frequency. Whether it is an exciting voltage source or an exciting current source, the difference between the detection signal of the ferromagnetic magnetic circuit and
the air magnetic circuit always exist extremum, which with the increase of frequency, it increases first and then decreases. For the excitation voltage source, as shown in Fig. 3a, when the excitation frequency is equal to about 300Hz, the difference of two curves is the maximum, which is corresponding optimum frequency, and the detection sensitivity is the maximum. For the exciting current source, as shown in Fig. 3b, when the excitation frequency is equal to about 1000Hz, the difference of two curves is the maximum, which is corresponding optimum frequency. Further simulation analysis shows that for different excitation voltages, the optimum excitation frequency remains the same as long as the turns of the coils are the same. The optimum frequency is independent of the magnitude of the power supply.
Simulation analysis of the relationship between detection signal and excitation source amplitude
Fig.4 expresses the relationship between detection signal and excitation source amplitude. Figures 4a and 4b show that the detection signal varies laws with the magnitude of the excitation voltage source and the magnitude of the excitation current source at the optimum detection frequency.
It can be seen that the detection signal increases linearly with the increasing of the amplitude of the excitation source.
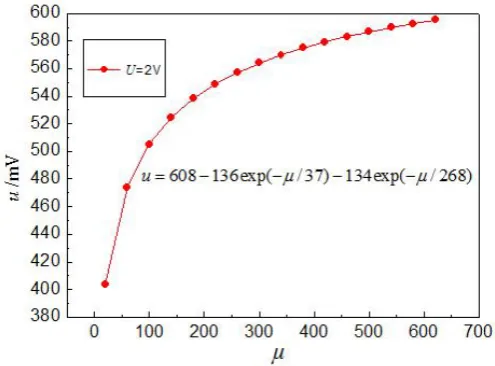
Simulation analysis of relationship between permeability and detection signal: Fig. 5 expresses the changing curve of
[image:4.595.71.526.338.505.2](a) f =300Hz N=300 (b) f=1000Hz N=300
Fig. 4. The relationship between detection signal and excitation source amplitude
Fig. 5. The relation of the detection signal with the initial permeability
[image:4.595.175.423.542.725.2]the detection signal versus the initial permeability of ferromagnetic specimens. In the simulation test, both the exciting coil and the detecting coil take 300 turns, the excitation frequency is 300Hz, and the excitation voltage is 2V. When the permeability of ferromagnetic specimens changes due to stress concentration and fatigue damage, the magnetic induction signals will change. It shows thatThe change law of the detection signal with magnetic permeability can be well fitted to an exponential expression:
)
268
/
exp(
)
37
/
exp(
a
b
c
u
………….(6)a, b,c are the coefficient related to the magnitude of the
exciting source voltage, which is directly proportional to the amplitude of the voltage.
The detection signal increases with the increase of initial permeability of ferromagnetic material. When the permeability is small, the change rate of the detection signal is large, and
the detection signal tends to constant as the permeability increasing.It indicates that the initial permeability is closely related to the detection signal, and the initial permeability of the specimen can be calculated by inversion of the detected signal. As can be seen from the Figure 5, the smaller the permeability, the higher the sensitivity.
Experimental research of test technology based on initial permeability
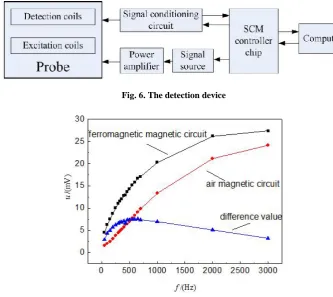
Test platform of test technology based on initial permeability: The testing platform for initial permeability testing technology is demonstrated in Fig.6. The platform consist of probe, signal source, SCM controller chip, signal conditioning circuits, etc.
[image:5.595.122.456.239.536.2]Experimental research of optimum excitation frequency: In this experimental study, the optimum excitation frequency is first determined. The object of test is 45#steel plate, and the Fig. 6. The detection device
Fig. 7. Detection signal as a function of excitation frequency
[image:5.595.188.407.569.732.2]exciting coil and test coil are 300 turns each, keeping the excitation voltage source amplitude U=2V. When the test
piece is an annealed stress free flat plate, is called a ferromagnetic magnetic circuit consisting of magnetic flux; When the position of the test piece is air, that is, when the test piece is taken away, is called a air magnetic circuit consisting of magnetic flux. In the two cases of the ferromagnetic magnetic circuit and the air magnetic circuit, the change of the detected signal with frequency is shown in Figure 7. In either the ferromagnetic magnetic circuit or the air magnetic circuit, the detection signal is frequency dependent and monotonically increases with frequency.The difference between the test signal corresponding to the ferromagnetic magnetic circuit and the air magnetic circuit reflects the sensitivity of the initial permeability measurement. Figure 7 shows, there is an extremum in the relation curve of the difference signal with frequency, and the highest test sensitivity is at the extreme point. The best detection frequency measured in the experiment is basically consistent with the simulation analysis, which is about 300Hz. The change trend of the detection signal with the excitation frequency is the same as the simulation results.
Experimental measuring of the relationship of test signal and tensile stress
The relationship between the tensile stress and the detected signal is studied. By changing the tension, the initial permeability of the specimen being changed, and then the relationship between the detected signal and the tensile stress was studied. After each load, the unloaded specimen is detected and the voltage signal in the detecting coil was extracted, and U=2V, N=300, exciting frequency of f =300 Hz. Fig. 8 shows the change relation of the detection signal with the tensile stress of the specimen. Figure 8 shows that with the increase of tensile stress, the initial permeability decreases, and the detection signal decreases slowly first, and with the increasing of tensile stress further , the detection signal drops rapidly. The detection signal is closely related to the degree of stress concentration, and the stress concentration and damage degree of the specimen can be reflected and evaluated by the detected signal. According to the testing principle, when the ferromagnetic specimen is subjected to tension, its initial permeability decreases with the increase of tensile stress, and the experimental results are in good agreement with the theoretical analysis.
Conclusions
Through the theoretical analysis, ANSYS simulation and experimental research of the initial permeability detection technology, the following conclusions can be drawn:
The model of relationship between stress and permeability is established. It is found that the stress is closely related to permeability, and the stress condition of the component can be determined by testing the initial permeability of the component.
Through the analysis of the principle of the initial permeability detection technology, it can be seen that the initial permeability of ferromagnetic medium is closely related to the stress, the initial permeability of the component can be determined by test.
The measurement sensitivity based on the initial permeability is related to the excitation frequency. The
optimum exciting frequency is studied by means of finite element simulation and experimental test. Optimal excitation frequency is related to the number of turns of the test and excitation coil. The greater the number of turns, the smaller the optimum frequency. The simulation results are in good agreement with the experimental results.
The relationship between the detection signal and the initial permeability is simulated. The detection signal has a corresponding relationship with the initial permeability. The results show that the initial permeability of the component can be effectively measured by experiments.
Experiments show that this technique can be used to detect ferromagnetic material stress concentration, fatigue damage and heat treatment condition. It indicates that the detection signal decreases with the increase of tensile stress, and the stress concentration degree of ferromagnetic component can be evaluated by measuring the change of initial permeability.
REFERENCES
Dai Daosheng, Qian Kunming. 2000. The ferromagnetics. Beijing: Science Press.
Gao, W.X., Hu, Y.H., Mu, X.X., Wu, X.M. 2011. Real-time detection and segmentation of submerged-arc welding defects in X-ray radiography images. Chin J Sci Instrum., 32(2):1215-1224.
Li Xiao-meng, Ding Hong-sheng, Bai Shi-wu. 2014. Research on the stress-magnetism effect of ferromagnetic materials based on three-dimensional magnetic flux leakage testing. NDT&E International 62, 50–54
O Stupakov, I Tomáš,et al. 2004. Traditional, Barkhausen and
MAT magnetic response to plastic deformation of low-carbon steel. Czechoslovak Journal of Physics, 54,(4): D47-D50
Rabung, M., Altpeter, I., Boller, C., Dobmann, G., Herrmann, H. 2014. Non-destructive evaluation of the micro residual stresses of IIIrd order by using micro magnetic methods. NDT&E International 63, 7–10.
Ren Shangkun, Xu Zhenhan. 2014. Sensitive differential permeability evaluation technique for strain damage and microstructure transformation of ferromagnetic specimens .
Journal of Aeronautics, 35:1-5
Ren, S.K., Song. K. 2009. Influences of environmental magnetic field on stress magnetism effect for 20 steel ferromagnetic specimen(J). Insight: Non-Destructive Testing and Condition Monitoring, 51(12) 672-675
Ren. S. K. 2010. Studies on stress-magnetism coupling effect for 35 steel components. Insight: Non-Destructive Testing and Condition Monitoring, 52(6): 305-309
Tomáš, I. 2004. Magnetic Adaptive Testing of Non-magnetic Properties of Ferromagnetic Materials. Czechoslovak Journal of Physics, 54, (4): 23-26
Tomáš, I. 2004. MagneticAdaptive Testing of Non-magnetic Properties of Ferromagnetic Materials. Czechoslovak,
Journal of Physics, 54, (4): 23-26
Tomáš, I., Stupakov, O., Kadlecová, J., O. 2006. Perevertov Magnetic adaptive testing low magnetization,high sensitivity assessment of material modifications. Journal of
Magnetism and Magnetic Materials, 304(2): 168-171 Tomáš. I. 2004. Non-destructive magnetic adaptive testing of
ferromagnetic materials. Journal of Magnetism and Magnetic Materials, 268(1-2): 178-185