3112
A MULTILEVEL PRINCIPAL COMPONENT ANALYSIS
BASED QOS AWARE SERVICE DISCOVERY AND
RANKING FRAMEWORK IN MULTI-CLOUD
ENVIRONMENT
1A V L N SUJITH, 2Dr. A. RAMA MOHAN REDDY, 3Dr. K MADHAVI
1Research Scholar, Department of CSE, JNTUA University, Andhra Pradesh, India 2Professor, Department of CSE, S V University, Andhra Pradesh, India 3Associate Professor, Department of CSE, JNTUA University, Andhra Pradesh, India
1[email protected], 2[email protected], 3[email protected]
ABSTRACT
With the rapid increase in the utilization of the cloud services, various cloud service providers are keeping their efforts in the design and development of the Quality of Service (QoS) aware composite services that satisfy the user preferences. QoS aware cloud service discovery and selection is considered as an NP-hard problem due to the existence of similar cloud services in different cloud environments. Existing cloud service selection mechanisms adopt the procedure of calculating the weighted summation of the QoS attributes to select cloud services. But due to the lack of correlation between the QoS preferences of the cloud service, these approaches may produce inaccurate results. In this paper, a multilevel principal component analysis (PCA) based service selection mechanism is proposed to discover and rank the services based on the user preferences in a multi-cloud environment. Modified PCA based service agent is deployed to select the services on analyzing the QoS correlations if each service. Finally, the experimental results show that our proposed mechanism outperforms the existing service selection techniques in terms of computation time and reduction of discovery overhead.
Keywords: Cloud Computing, Service Ranking, Principal component analysis, cloud service selection, Quality of service
1. INTRODUCTION
Cloud Computing plays a vital role in current generation computing scenario due to its proliferation of services that are made available for the users of both commercial and domestic segments. In general, different cloud service providers are offering similar cloud services to users with the variation in Quality of Service (QoS) parameters. In this context selection of appropriate cloud services based on the user requirement in mult-cloud environment is considered to be NP-Hard problem.
The significant growth in the usage of the IaaS enhances proliferation of the cloud services that improve the economic feasibility in the deployment of the cloud services depending on the request of the client. Service provider selection and service discovery play a vital role in real-time business activity based on the service request from the client. Optimal service
selection from the vast range of similar services offered by different cloud service providers is considered as a major challenge in the context of cloud service composition. Atomic services obtained from various services providers are integrated to develop novel applications based on the client request.
3113 rank the available services based on their matching level towards the service request. Optimal service selection and reducing the discovery overhead, computation time with a significant reduction in the total number of the candidate services are considered as the main objective of this work.
Recent research studies [1-3] indicate that most of the service selection strategies are developed based on the weighted summation, that aggregate various aspect of the QoS parameters of cloud service to identify the best service as per the user preference [6]. Studies in [8-10] specifically address the service composition models in which they demonstrated the quality of service aggregate models to evaluate QoS of each candidate service to form an optimized composite service. It is observed that there is no significant reduction in the number of candidate services and computation time in the context of evaluating the QoS parameters and selecting the best service. To reduce the discovery overhead and a number of candidate services initially QoS values of cloud services are clustered using Principal component analysis (PCA). To the best of our knowledge, none of the work has been carried out based on our proposed work in developing a multilevel model for cloud service selection using modified PCA.
In this work, the term frequency and inverse document frequency (TF-IDF) algorithm are utilized to filter the atomic services obtained from the multi-cloud environment based on the service request and further to evaluate the similarity ratio of the cloud services cosine similarity is performed. The main purpose of the usage of PCA is to identify the correlation among the QoS attributes that not only causes high computational complexity but also leads to computational error. Therefore there is a need for a novel framework that reduces the computational complexity and correlations among the QoS attributes. This work utilizes a modified PCA to analyze the QoS attributes and further rank the selected cloud services based on user preference. The main contributions of this work include the significant reduction in the rate of service discovery overhead and computation time, as the number of the candidate services are reduced this approach ensures the optimality in the selection of the best service based on the service request [13-15].
The rest of the paper is organized as follows. Section 2 provides a glimpse of the related work
in the context of service discovery and selection approaches in a multi-cloud environment. Section 3 details the proposed framework and implementation sequence of the mathematical model. Section 4 illustrates the results and discussions of the proposed mechanism. Finally, Section 5 concludes the work with further directions.
2. RELATED WORK
As the inappropriate cloud service selection may affect the QoS parameters of the composed cloud service, service discovery and selection is considered to be a vital aspect in the context of service composition from many years [16-19]. Several research studies have adopted different strategies in solving the problem of service composition by selecting appropriate services based on user QoS preferences.
In [4] Tasaka et al. proposed a model that make use of the principal component analysis that analyzes the quality of service parameters in terms of a multimedia transmission network. In their studies and experiments, the method is proven to be effective but such method until now has not been used for cloud service selection. Further, in [8] the author proposed an effective and efficient QoS-aware cloud service selection approach for service composition. In this work, the researcher has adopted the cloud model to extract reliable services on calculating the uncertainty value of the pruning redundant cloud services.
In Zeng et al. [7] author has implemented the service selection strategy based on the QoS ratings availed from the cloud service requestors without considering the context. Skoutas et al. in [6] the QoS requirements are clustered and detailed into multiple classes based on their QoS parameters like price, reliability, accessibility and computation time. Arasi et al. in [5] have developed a discriminant analysis model based on the success rate of the services.
Lin et al. [11] in his work made an attempt to enhance the trustworthiness in the service composition model on considering the previous QoS records of the cloud services instead of using the QoS values proposed by the cloud service provider. In specific, this approach is based on the QoS weighted summation.
3114 scenario it is observed that different cloud service providers like Google, IBM blue Mix, Amazon etc. are offering similar cloud services with variation in the QoS parameters like cost, response time and availability this context motivated the researchers towards cloud service composition in multicloud environment. The advances in service computing enable the orchestration of cloud services from various
[image:3.612.183.427.206.490.2]cloud service providers in which the discovery of the appropriate cloud services in different clouds based on user QoS requirements plays a key role. This context motivated the author to propose a hybrid PCA based framework for appropriate service selection. The main objective is to develop a model that discover the best cloud service from available set of similar service based on user QoS constraints.
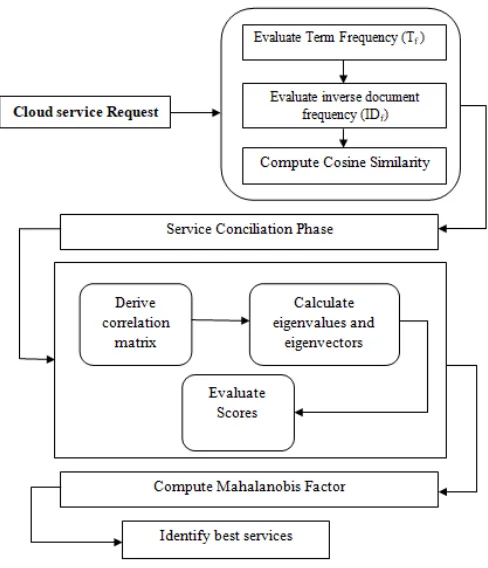
Figure 1: Proposed ML-PCA-SC Framework
3. ML-PCA BASED SERVICE SELECTION MECHANISM
A Multilevel principal component analysis based QoS evaluating framework is developed to analyze the properties of similar cloud services in multi-cloud domain environments. The key phases of the framework include evaluating the term frequency (Tf ) and inverse document
frequency(IDf) of the request generated by the
service requestor and compute the cosine similarity of the same. Further, in the next level, a PCA based QoS selection and the ranking mechanism is employed to rank the services based on their QoS relevance. The framework of the proposed system is shown in Figure 1.
3.1 Service Discovery In A Multi-Cloud Environment
The multi-cloud environment enables the user to select desired services from diverse clouds. To discover similar cloud services based on the service request, the evaluation of the Tf * IDf is
performed along with cosine similarity to calculate the similarity score of the services and generate the filtered service set on applying the thresholds related to the service
request. The steps involved in the service discovery phase are detailed below:
3115 Each service term in the multi-cloud environment is assigned with a weight based on its frequency of the occurrence in the service request generated by the service requester. As a result of evaluating the term frequency, the frequency measure will enlist the services based on the service request but, due to the constraint of variation in the size of web service description language (WSDL) the concept of normalization is employed to normalize the size of the service description.
Step 2: Evaluate Inverse Document Frequency (IDf)
In the context of identifying similar services to the service request, Step 1 is implemented only based on matching the service terms involved in the service request. But in the real-time consequences, few service terms seem to be trivial while matching service request. To overcome such cases there is a need weighing the service terms up and down to retrieve the relevant services from a multi-cloud environment using Equation 1.
𝐼𝐷 𝑆𝑒𝑟𝑣𝑖𝑐𝑒 𝑡𝑒𝑟𝑚 1
𝑙𝑜𝑔
(1)
Aggregate and compute IDf for every service
term in the request from various services collected from a multi-cloud environment using Equation 2 is applied for every cloud service for instance
,
𝑐 𝑠
,
𝑐 𝑠
……..
𝑐 𝑠
to
𝑐 𝑠
.
𝑆𝑒𝑟𝑣𝑖𝑐𝑒 𝑡𝑒𝑟𝑚 𝐼𝐷 𝑆𝑒𝑟𝑣𝑖𝑐𝑒 𝑡𝑒𝑟𝑚
𝐼𝐷 𝑆𝑒𝑟𝑣𝑖𝑐𝑒 𝑡𝑒𝑟𝑚 ⋯
𝐼𝐷 𝑆𝑒𝑟𝑣𝑖𝑐𝑒 𝑡𝑒𝑟𝑚
𝑆𝑒𝑟𝑣𝑖𝑐𝑒 𝑡𝑒𝑟𝑚 𝐼𝐷 𝑆𝑒𝑟𝑣𝑖𝑐𝑒 𝑡𝑒𝑟𝑚
𝐼𝐷 𝑆𝑒𝑟𝑣𝑖𝑐𝑒 𝑡𝑒𝑟𝑚 ⋯
𝐼𝐷 𝑆𝑒𝑟𝑣𝑖𝑐𝑒 𝑡𝑒𝑟𝑚 ⋮
𝑆𝑒𝑟𝑣𝑖𝑐𝑒 𝑡𝑒𝑟𝑚 𝐼𝐷 𝑆𝑒𝑟𝑣𝑖𝑐𝑒 𝑡𝑒𝑟𝑚
𝐼𝐷 𝑆𝑒𝑟𝑣𝑖𝑐𝑒 𝑡𝑒𝑟𝑚 . . 𝐼𝐷 𝑆𝑒𝑟𝑣𝑖𝑐𝑒 𝑡𝑒𝑟𝑚
(2)
Further, Compute Tf * IDf to evaluate optimal
weighting factor for various service term frequency with the inverse service term frequency included in every cloud.
Step 3: Compute Cosine Similarity:
Initially, as the vector quantity is originated from each service, the group of similar services obtained from multiple clouds is considered to be vector space and to quantify the similarity rate
among any two services Equation 3 and 4 can be applied.
𝐶𝑜𝑠𝑖𝑛𝑒 𝑆𝑖𝑚𝑖𝑙𝑎𝑟𝑖𝑡𝑦 𝑐 𝑠 , 𝑐 𝑠
𝐷𝑜𝑡 𝑃𝑟𝑜𝑑𝑢𝑐𝑡 | | ∗ |, |
(3)
Where, 𝑐 𝑠 and 𝑐 𝑠 are the similar cloud services obtained from Clouds 𝑐 and 𝑐
respectively and 𝑐 𝑠 and 𝑐 𝑠 are the service descriptions of the services obtained from 𝑐 and
𝑐.
Evaluation of similarity scores between the services is computed using Equation 4.
𝐷𝑜𝑡 𝑃𝑟𝑜𝑑𝑢𝑐𝑡 𝑐 𝑠 , 𝑐 𝑠 𝑐 𝑠 0 ∗ 𝑐 𝑠 0 𝑐 𝑠 1 ∗ 𝑐 𝑠 1 ⋯ 𝑐 𝑠 𝑛 ∗ 𝑐 𝑠 𝑛 (4)
3.2 Service Conciliation Phase
The main objective of this phase is to identify the candidate cloud service
providers (CSP) depending on the service
request generated by the cloud service
requestor (CSR) that generates an input for
PCA based QoS analysis model. In this context initially, we need to evaluate QoS
dimensions for the service enabled by CSP.
It is to be identified whether the cloud
service enabled by CSP includes all the QoS
parameters enabled by CSR. Equation 5
evaluates the QoS dimensions between the
CSP and CSR.
𝐷 𝐶𝑆 , 𝐶𝑆 | | ∈ ∩ ∈ |
| | ∈ |
(5)
Quantification of the QoS parameters in the context of uniform distribution is necessary to perform numerical conciliation [20]. The obtained QoS parameters are analyzed and classified into positive criteria if there is an increase in the attribute value with the consequent increase in the objective function and negative criteria. Equations 6 and 7 enable to evaluate the positive and negative QoS Parameters respectively.
𝑁 , 𝑖𝑓 𝑄 𝑄 0
1 𝑖𝑓 𝑖𝑓 𝑄 𝑄 0
3116
𝑁 , 𝑖𝑓 𝑄 𝑄 0
1 𝑖𝑓 𝑖𝑓 𝑄 𝑄 0
To evaluate negative QoS parameters (7)
Where 𝑁 , and 𝑁 , is computes the positive
and negative criteria based normalized values for the nth parameter of the mth service.
As 𝑁 is considered as the maximum value of the nthcolumn within the QoS matrix if 𝑄 max 𝑄 and 𝑁 is considered as the
minimum value of the nthcolumn within the
QoS matrix if 𝑄 min 𝑄 . The normalized QoS parameters will be quantified between [0, 1] interval.
Further a parameterized classification function is used to compute the classification score of every service in every class that evaluates the service conciliation to which class it belongs to. Equation 8 implements the parameterized classification function on each service to evaluate its classification factor.
𝐶 𝑆 𝑧 𝑊𝑡 ∗ 𝑥 𝑊𝑡 ∗ 𝑥 ⋯
𝑊𝑡 ∗ 𝑥 (9)
Where 𝐶 𝑆 cloud service ‘n’ that belongs to
ith class in which the subscript ‘i’ notates the
respective class to which the service belongs
to, 𝑧 is considered to be the constant of the
ith class, 𝑊𝑡 is the parametrized weighting
metric to compute the classification score.
3.3 Modified Principal Component Analysis
In the context of evaluating the QoS properties of the cloud services, the similar
services obtained from various CSp have
variations in their QoS criteria. Because of this reason, the most common service quality indicators usually considered by the researchers include the rate of input/output consistency (I/O), Processing Performance, Disk Performance, Memory Performance, Number of the virtual cores and cost of the service. This paper also considers the
above-mentioned parameters for the purpose of experimental analysis.
The mathematical definition of the PCA specifies that it implements the Orthogonal linear transformation in which the obtained data is transformed into a novel coordinate system in which the data with the highest variance is projected to be in the first
coordinate Y1 (first principal component)
further the second, third till nth component
are represented as Y2, Y3 …Yn. There are
two main steps employed in the modified PCA as follows.
Step 1: Derive the Correlation Matrix (CRm) The normalized and classified QoS parameters from Equation 9 are considered
to compute the correlation matrix CRm . The
correlation matrix is computed as follows:
𝐶𝑅
𝑟 𝑟 … 𝑟
𝑟 𝑟 … 𝑟
⋮ ⋮ … ⋮
𝑟 𝑟 … 𝑟
(10)
Where 𝑟 , , 𝑚, 𝑛 1,2,3 … 𝑛 is considerd to
be the correlation coefficient in between the
orginal QoS variable 𝑄 and 𝑄 . As the
CRm is the symmetric matrix i.e., 𝑟 , ≡
𝑟, only lower triangular or upper
triangular elements are computed as shown in Equation 11.
𝑟 , ∑ , ,
∑ , .∑ ,
(11)
Step 2: Calculate eigenvalues and eigenvectors
In the context of calculating the eigenvalues and eigenvectors initially, we need to solve
the parameterized equation |𝜆𝐼 𝐶𝑅 | 0
and sort the eigenvalues in descending order.
Further, compute the eigenvector 𝜀𝑣 for
𝜆 1,2,3. . , 𝑝 as well as normalize it using Equation 12.
‖𝜀𝑣 ‖ 1 𝑜𝑟 ∑ 𝜀𝑣 1 (12)
Here 𝜀𝑣 is the nth component of 𝜀𝑣.
3117 Here we employ the process of Mahalanobis distance to evaluate the scores of the individual candidate services and identify the best service from the selected class of services. Equation 13 is utilized to evaluate the score of the services the service with the best score is ranked on the top and selected as the best service.
𝐵 𝑥, 𝑦 𝑥 𝑚 𝐶𝑅 𝑥 𝑚 (13) Here 𝑥 is the vector quantity related to the service data, 𝐶𝑅 is the inverse of the correlation coefficient matrix and m is the mean of the normalized data. Based on the above steps our ML-PCA could be explained by the following algorithm in the form of a pesudocode.
Algorithm ML-PCA
Input: Cloud services data with QoS Parameters
Output: Optimized service selection
1. 𝑁 = normalization (Q);
2. 𝐶𝑅 = Correlation matrix 𝑁 ;
3. 𝑒𝑖𝑔𝑒𝑛𝑣𝑒𝑐𝑡𝑜𝑟, 𝑒𝑖𝑔𝑒𝑛𝑣𝑎𝑙𝑢𝑒𝑠 =
Solve |𝜆𝐼 𝐶𝑅 | 0
4. Inv𝐶𝑅 = inv(𝐶𝑅 )
5. 𝑀 𝑚𝑒𝑎𝑛 𝑁
6. Scores = zeros(length(𝐶𝑅 ), 1)
7. for i = 1:length(𝐶𝑅
8. score=sqrt((𝑁′
(i,: 𝑀′)*Inv𝐶𝑅 *( 𝑁′ (i,: 𝑀′)')
9. Scores(i) = score
10. end for
4. Results and Discussions
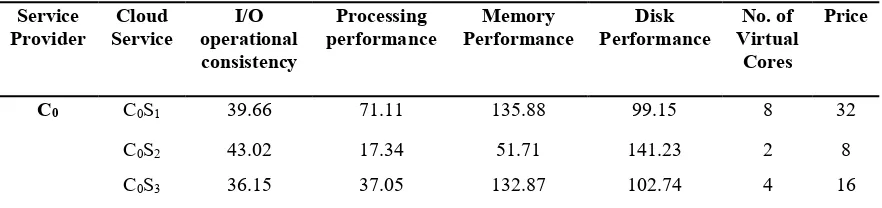
This section presents a detailed discussion on the validation of the effectiveness and feasibility of the proposed approach. In this context, experiments are conducted on ML-PCA based QoS preference aware framework to evaluate the service properties of different similar services offered by different clouds and rank the appropriate services based on the client request [22]. All experiments were performed using HP Pavilion laptop with i5-6200U at 2.40 GHz processing capacity along with 12 GB of RAM in MATLAB. In our proposed work Cloudharmony[21] is used as a benchmark service provider where we are able to collect the real-world data related to the cloud services enabled by different service providers. The initial data consists of similar cloud services obtained from the dataset related to the client request based on the term frequency, inverse document frequency and cosine similarity from different cloud service providers as shown in Table 1. To evaluate the process of service discovery and
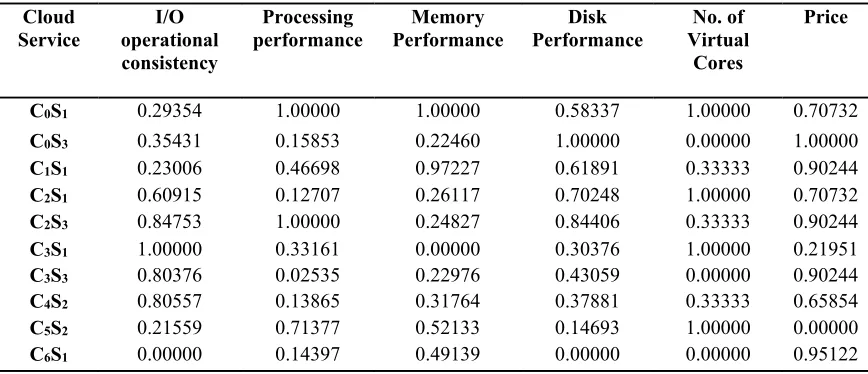
Conciliation, the QoS data is to be normalized and classified based on the client request. The normalized QoS parameters of the selected class of cloud services shown in
Table 2. Compute Correlation matrix using
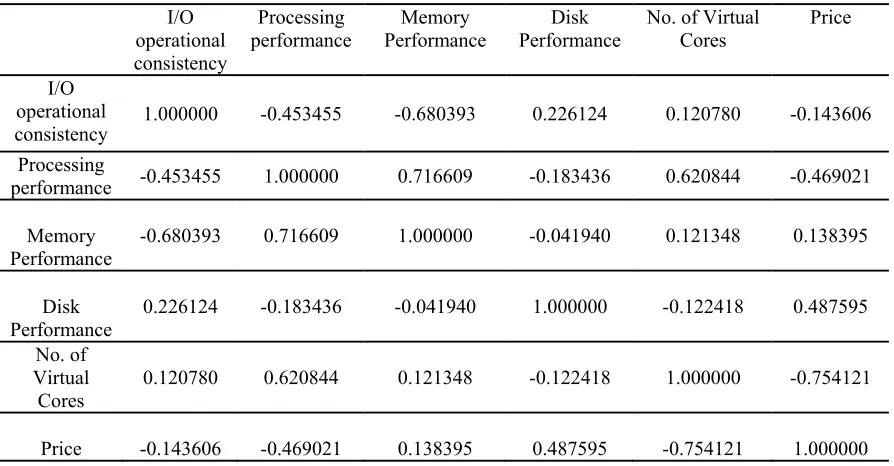
[image:6.612.86.527.628.732.2]Equation 10 and 11 to evaluate the correlation consistency between the QoS preferences of different cloud services. The resultant matrix is shown in Table 3. In the correlation matrix, it is observed that QoS Parameters considered for evaluation are highly correlated with each other. Further, compute eigenvalues and eigenvectors for the derived coefficient matrix to evaluate the ranking of the service using Equation 12. In the next step calculate mean and the inverse correlation matrix to apply Equation 13 to compute the score of the QoS Parameters.
Table 1 Initial Data of similar cloud services with a variation of the QoS Parameters
Service
Provider Service Cloud operational I/O consistency
Processing
performance Performance Memory Performance Disk Virtual No. of Cores
Price
C0 C0S1 39.66 71.11 135.88 99.15 8 32
C0S2 43.02 17.34 51.71 141.23 2 8
3118
C1 C1S1 57.11 15.33 55.68 111.18 8 32
C1S2 70.29 7.21 54.28 125.48 4 16
C2 C2S1 78.72 28.4 27.33 70.91 8 72
C2S2 67.87 8.83 52.27 83.72 2 16
C2S3 67.97 16.07 61.81 78.49 4 36
C3 C3S1 35.35 52.82 83.92 55.07 8 90
C3S2 23.43 16.41 80.67 40.23 2 12
C3S3 29.07 32.4 90.83 42.47 4 45
C4 C4S1 53.28 48.23 131.79 67.22 8 56
C4S2 92.89 25.86 129.03 110.33 4 28
C5 C5S1 64.64 75.89 100.14 174.12 8 34.65
C5S2 89.31 23.43 89.84 174.5 2 10.13
C5S3 59.63 42.05 97.16 174.49 4 20.86
C6 C6S1 77.46 51.7 125.59 73.44 8 56
C6S2 114.44 13.89 131.89 97.38 2 14
[image:7.612.85.519.430.617.2]C6S3 119.63 23.66 144.86 100.55 4 28
Table 2. Normalized QoS Parameters of the requested set of cloud services
Cloud
Service operational I/O consistency
Processing
performance Performance Memory Performance Disk Virtual No. of Cores
Price
C0S1 0.29354 1.00000 1.00000 0.58337 1.00000 0.70732
C0S3 0.35431 0.15853 0.22460 1.00000 0.00000 1.00000
C1S1 0.23006 0.46698 0.97227 0.61891 0.33333 0.90244
C2S1 0.60915 0.12707 0.26117 0.70248 1.00000 0.70732
C2S3 0.84753 1.00000 0.24827 0.84406 0.33333 0.90244
C3S1 1.00000 0.33161 0.00000 0.30376 1.00000 0.21951
C3S3 0.80376 0.02535 0.22976 0.43059 0.00000 0.90244
C4S2 0.80557 0.13865 0.31764 0.37881 0.33333 0.65854
C5S2 0.21559 0.71377 0.52133 0.14693 1.00000 0.00000
3119
Table 3. Correlation between the QoS Parameters
I/O operational consistency
Processing
performance Performance Memory Performance Disk No. of Virtual Cores Price
I/O operational
consistency 1.000000 -0.453455 -0.680393 0.226124 0.120780 -0.143606 Processing
performance -0.453455 1.000000 0.716609 -0.183436 0.620844 -0.469021
Memory
Performance -0.680393 0.716609 1.000000 -0.041940 0.121348 0.138395
Disk
Performance 0.226124 -0.183436 -0.041940 1.000000 -0.122418 0.487595 No. of
Virtual
Cores 0.120780 0.620844 0.121348 -0.122418 1.000000 -0.754121
[image:8.612.81.533.390.622.2]Price -0.143606 -0.469021 0.138395 0.487595 -0.754121 1.000000
Table 4 Inverse Correlation matrix
I/O operational consistency
Processing
performance Performance Memory Performance Disk No. of Virtual Cores Price
I/O operational
consistency 2.34091 0.83190 1.04050 -0.54672 -0.81662 0.23310 Processing
performance 0.83190 8.08457 -5.69429 -1.17558 -1.38301 4.22961
Memory Performance
1.04050 -5.69429 6.47910 1.01562 -0.47145 -4.26874
Disk
Performance -0.54672 -1.17558 1.01562 2.04597 -0.95112 -2.48530 No. of
Virtual
Cores -0.81662 -1.38301 -0.47145 -0.95112 3.98647 2.76935
Price 0.23310 4.22961 -4.26874 -2.48530 2.76935 6.90827
Apply Mahalanobis distance to evaluate the score and ranking of the cloud services. For this purpose initially we need to calculate the mean of the normalized QoS parameters and then the computation is processed using Equation 13 the score and the ranking of the services is shown in Table 5.
4.1 Effectiveness Verification
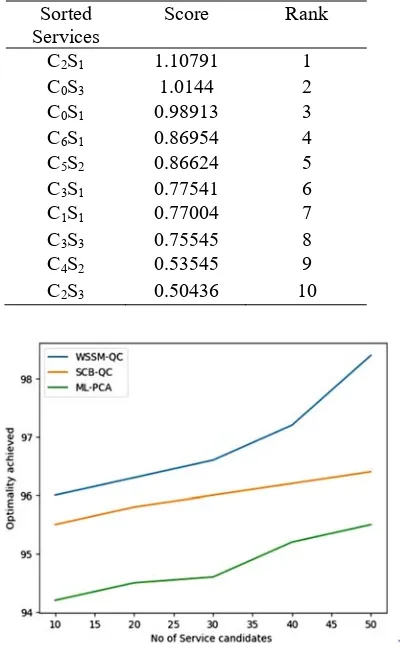
3120 techniques based on the QoS Preferences to reduce the number of candidate services. But it is practically illustrated that these techniques exhibit low performance in terms of computational time and optimality. Figure 2 depicts the optimality of our proposed technique as it outperforms the existing techniques and depicts the best result in the range of 95.5% optimality ratio in the range. Figure 3 exhibits that ML-PCA diminishes in a number of the candidate services when compared with the previously existing techniques.
Table 5. Ranking of the services
Sorted
Services Score Rank
C2S1 1.10791 1
C0S3 1.0144 2
C0S1 0.98913 3
C6S1 0.86954 4
C5S2 0.86624 5
C3S1 0.77541 6
C1S1 0.77004 7
C3S3 0.75545 8
C4S2 0.53545 9
C2S3 0.50436 10
[image:9.612.323.552.42.276.2]Figure 2: Rate of optimality based on the problem size
Figure 3: Service Discovery rate per number of tasks
Figure 4.Rate of Computation Time for a number of tasks
In Figure 4, the proposed ML-PCA technique performs well in terms of the computation time in the context of variations in terms of the tasks from 10 to 50. The filtering strategy applied in the proposed mechanism to reduce the count of the candidate services plays a vital role in the reduction of the computation time.
5. CONCLUSION AND FUTURE WORK
[image:9.612.323.554.209.479.2] [image:9.612.96.296.279.606.2]3121 cloud services based on their requirement and QoS preferences. The experimental results depict that the proposed mechanism is best in the context of the optimality ratio, computation time, minimizing the discovery overhead and reduction of the number of the candidate services when compared with existing mechanisms like WSSM-Q and SCB-QC. Further, this model could be enhanced in terms of optimization and evaluate the functionality of the model when deployed for service composition.
REFERENCES
[1] G. Kang, J. Liu, M. Tang, et al.. Web service selection for resolving conflicting service requests. IEEE International Conference on Web Services (ICWS), Washington D.C., USA, July 4–9, 2011, 388–394.
[2] S. Ran. A model for web services discovery with QoS. ACM SIGecom Exchanges,
4(2003)1, 1–10.
[3] Y. Liu, A. H. Ngu, and L. Z. Zeng. QoS computation and policing in dynamic web service selection. International World Wide
Web Conference (WWW),
New York, USA, May 17–22, 2004, 66–73 [4] S. Tasaka and Y. Ito. Psychometric analysis
of the mutually compensatory property of
multimedia QoS.
International Conference on Communications (ICC), Alaska, USA, May 11–15, 2003, 1880–1886.
[5] Arasi, F.E.M., Govindarajan, S., Subbarayan, A., 2016. Discriminant Analysis of Web Services Successability.
Journal of Applied Sciences229, Volume 16(5), pp. 223
[6] Skoutas, D., Simitsis, A., Sellis, T., 2007. A Ranking Mechanism for Semantic Web Service Discovery. In48: IEEE Congress on Services, pp. 41
[7] Zeng, L., Benatallah, B., Ngu, A.H., Dumas, M., Kalagnanam, J., Chang, H., 2004. QoS-aware Middleware for Web Services Composition. IEEE Transactions on Software Engineering, 327Volume 30(5), pp. 311
[8] Vergin Raja Sarobin, M., Ann Thomas, Linda, 2016a. Improved Leach Algorithm for Energy Efficient Clustering of Wireless Sensor Network (WSN). International Journal of Technology60, Volume 7(1), pp. 50
[9] Zhou, W., Wen, J., Gao, M., Liu, J., 2013. A QoS Preference-based Algorithm for Service Composition in Service-oriented Network. Optik-International Journal for Light and Electron Optics4444, Volume 124(20), pp. 4439
[10] Rajeswari, M., Sambasivam, G., Balaji, N., Basha, M.S., Vengattaraman, T., Dhavachelvan, P., 2014. Appraisal and Analysis on Various Web Service Composition Approaches based on QoS Factors. Journal of King Saud University-Computer and Information Sciences152, Volume 26(1), pp. 143 [11] Li, S.C., Chen, H.P., Chen, X., 2010. A
Mechanism for Web Service Selection and Recommendation based on Multi-QoS Constraints. In: The 6th World Congress on 228Services (SERVICES-1), pp. 221 [12] Kalepu, S., Krishnaswamy, S., Loke, S.W.,
2004. Reputation=f(user ranking, compliance, verity). In: Proceedings of the IEEE International Conference on Web Services, pp. 207200
[13] E. Al-Masri and Q. Mahmoud. Discovering the best web service. International Conference on World Wide Web (WWW). Alberta, Canada, May 8–12, 2007, 1257– 1258.
[14] M. Alrifai and T. Risse. Combining global optimization with local selection for efficient QoS-aware service composition. International World Wide Web Conference (WWW), Madrid, Spain, April 20–24, 2009, 881– 890.
[15] D. Ardagna and B. Pernici. Global and local QoS guarantee in web service selection. International Conference on Business Process Management (BPM). Vienna, Austria, September 5–7, 2006, 32– 46.
[16] B. Benatallah, M. Dumas, Q. Z. Sheng, et al.. Declarative composition and peer-to-peer provisioning of dynamic web services.
IEEE International
Comference on Data Engineering (ICDE), California, USA, February 26–March 1, 2002, 297–308.
[17] Batra, S., Bawa, S., 2011. Semantic Discovery of Web Services using Principal Component Analysis. Physical Sciences4472, Volume 6(18), pp. 4466
3122 Ontology Commitment. In190: Services Computing Workshops, 2006. SCW'06. IEEE, pp. 183
[19] D’Mello, D.A., Ananthanarayana, V.S., 2008. A QoS Model and Selection Mechanism for QoS-aware Web services.
In: Proceedings of the International Conference on Data 27Management (ICDM 2008), Delhi, February, pp. 25 [20] Aruna, L., Aramudhan, M., 2016.
Framework for Ranking Service Providers of Federated Cloud Architecture using Fuzzy Sets. International Journal of Technology, Volume 7(4), 653pp. 643 [21] www.cloudharmony.com.