Gianella, Christian and Tompson, William (2007) Too little destruction, too
little creation: a Schumpeterian diagnosis of the barriers to sustained growth
in Ukraine. Working Paper. Organisation for Economic Cooperation and
Development, Paris.
Downloaded from:
Usage Guidelines:
Birkbeck ePrints: an open access repository of the
research output of Birkbeck College
http://eprints.bbk.ac.uk
Gianella, Christian and Tompson, William (2007)
Too Little Destruction, Too Little Creation: A
Schumpeterian Diagnosis of the Barriers to
Sustained Growth in Ukraine.
Economics
Department Working Paper No 574. ECO/
WKP(2007)34. Organisation for Economic
Co-operation and Development.
This is an exact copy of a working paper published on the OECD website at
http://www.olis.oecd.org/olis/2007doc.nsf/linkto/eco-wkp(2007)34
All articles available through Birkbeck ePrints are protected by intellectual
property law, including copyright law. Any use made of the contents should
comply with the relevant law.
Citation for this version:
Gianella, Christian and Tompson, William (2007) Too Little Destruction, Too
Little Creation: A Schumpeterian Diagnosis of the Barriers to Sustained
Growth in Ukraine.
London: Birkbeck ePrints.
Available at:
http://eprints.bbk.ac.uk/archive/00000566
Citation for the publisher’s version:
Gianella, Christian and Tompson, William (2007) Too Little Destruction, Too
Little Creation: A Schumpeterian Diagnosis of the Barriers to Sustained Growth
in Ukraine.
Economics Department Working Paper No 574. ECO/WKP
(2007)34. Organisation for Economic Co-operation and Development.
http://eprints.bbk.ac.uk
Unclassified ECO/WKP(2007)34
Organisation de Coopération et de Développement Economiques
Organisation for Economic Co-operation and Development 03-Sep-2007
___________________________________________________________________________________________
English text only
ECONOMICS DEPARTMENT
TOO LITTLE DESTRUCTION TOO LITTLE CREATION: A SCHUMPETERIAN DIAGNOSIS OF BARRIERS TO SUSTAINED GROWTH IN UKRAINE
ECONOMICS DEPARTMENT WORKING PAPERS No. 574
by
Christian Gianella and William Tompson
All OECD Economics Department Working Papers are available on the OECD Internet website at www.oecd.org/eco/working_papers
JT03231329
ECO/WKP(2007)34
Un
cl
assi
fi
ed
E
n
gl
ish
ABSTRACT/RÉSUMÉ
Too Little Destruction, Too Little Creation: A Schumpeterian Diagnosis of Barriers to Sustained Growth in Ukraine
This paper examines problems of entry, exit and competition in Ukrainian product markets. It finds that Ukraine still has too little of all three, and that exit mechanisms, in particular, function poorly. Since impediments to entry and exit are largely the product of excessive and ill administered regulation, the paper also provides a systematic assessment of product-market regulation in Ukraine, using indicators developed by the OECD Economics Department. Finally, the paper presents the main findings of two empirical studies concerned with the potentially large benefits of opening up markets, via both increased competition and further privatisation, for productivity growth in Ukraine.
This paper relates to the 2007 Economic Survey of Ukraine (www.oecd.org/eco/studies/ukraine).
JEL Classification: D24, D43, H11, L1, L5, L9, O12, P23
Keywords: Ukraine; competition; product-market regulation; creative destruction; entry; exit; restructuring, privatisation.
* * * * *
Une insuffisance de création-destruction: un diagnostic schumpétérien des freins à la croissance en Ukraine
Cet article examine les questions de concurrence, d’entrée et de sortie des entreprises sur le marché des biens. Il montre que toutes trois demeurent insuffisantes en Ukraine, et que les mécanismes de sortie du marché, en particulier, fonctionnent de manière très imparfaite. Compte tenu du fait que les barrières à l’entrée et à la sortie sont largement le produit d’une réglementation excessive et mal appliquée, l’article donne une évaluation systématique du niveau de réglementation du marché des biens en Ukraine, en utilisant les indicateurs développés par le Département des affaires économiques. Enfin, l’article expose les principaux résultats de deux études empiriques évaluant les effets bénéfiques sur la croissance de la productivité de l’ouverture des marchés, d’une part par un accroissement de la concurrence et d’autre part par la poursuite des privatisations.
Ce document se rapporte à l’Etude économique de l’Ukraine 2007
(www.oecd.org/eco/etudes/ukraine).
Classification JEL: D24, D43, H11, L1, L5, L9, O12, P23
Mots clés: Ukraine, concurrence, réglementation des marchés des biens, destruction créatrice, entrée sur le marché, sortie du marché, restructuration, privatisation.
Copyrights, OECD, 2007
TABLE OF CONTENTS
Introduction ... 5
Structural change in Ukraine since the financial crisis ... 6
Increasingly intensive job reallocation has been productivity enhancing… ... 6
…but entry and particularly exit mechanisms still works poorly… ... 8
…and competition remains weak ... 10
Competition policy has improved but much remains to be done ... 13
Reducing barriers to entry, exit and reallocation: the role of product-market reform ... 14
The regulatory framework in Ukraine: a comparison with OECD countries ... 15
Conditions for start-ups are easier, but barriers to entry for foreigners remain very high... 17
Overregulation impedes business growth and development ... 18
Regulatory process remains a problem ... 19
Excessive state ownership adds to the impediments to efficient exit ... 20
Overall, barriers to exit may be even more significant than restrictions on entry ... 21
Implicit and explicit subsidies, though declining, persist on a large scale ... 22
The potential benefits of enhanced competition and further privatisation ... 23
Strengthening competition improves the performance of Ukrainian firms ... 23
Privatisation promotes efficiency and productivity growth ... 25
Bibliography ... 29
Annex A. Product-market regulation in Ukraine ... 34
Overview of the PMR system ... 34
Results of the PMR assessment of Ukraine... 37
Annex B. Labour productivity at firm level ... 45
Annex C. Competition and productivity dynamics at the firm level ... 47
Data ... 47
The empirical model... 47
Tables 1. Year by year job flow rates ... 7
2. Correlation between labour productivity deviation and employment share change ... 8
3. Entry, exit and labour productivity differences, 1992–2005... 10
4. Summary indicators of product-market regulation ... 16
5. Labour productivity regressions ... 25
B1. Labour productivity difference between entry cohorts and old firms ... 45
Figures
1. Composition of industrial productivity growth ... 7
2. Herfindahl-Hirschmann concentration indexes, 2005 ... 12
3. Managerial assessments of competitive pressure... 13
4. Aggregate product-market regulation indicator ... 16
5. Multi-factor productivity impact of privatisation ... 27
A1. The PMR indicator system... 36
A2.. Scope of public enterprise ... 37
A3. Size of public sector ... 37
A4. Direct control over business enterprises ... 38
A5. Price controls ... 38
A6. Command and control regulation... 39
A7. Licenses and permits ... 39
A8. Communication and simplification ... 40
A9. Start-up: corporations ... 40
A10. Start-up: sole proprietors ... 41
A11. Sector-specific administrative burdens ... 41
A12. Legal barriers to entry ... 42
A13. Antitrust exemptions ... 42
A14. Barriers to foreign ownership ... 43
A15. Tariffs... 43
A16. Discriminatory procedures ... 44
TOO LITTLE DESTRUCTION, TOO LITTLE CREATION: A SCHUMPETERIAN DIAGNOSIS OF BARRIERS TO SUSTAINED GROWTH IN UKRAINE
Christian Gianella and William Tompson1
Introduction
One of the striking features of central planning was the extent to which it simply arrested the Schumpeterian processes of creative destruction that drive economic development in market economies. Competition was suppressed in favour of planning and there was virtually no exit – plants were rarely closed, the service lives of machinery were far too long, and little or no attention was paid to obsolescence. This, in turn, impeded entry, innovation and structural change, since it meant that established sectors, even in decline, continued to soak up investment and other resources that might have been more efficiently deployed elsewhere. Creating efficient mechanisms for entry, exit and reallocation – essential elements of dynamic, market-driven growth – was thus a first-order concern for all transition economies, including Ukraine. Yet while the post-independence period has indeed seen the gradual emergence of a Schumpeterian dynamic in Ukraine, it still rather muted. Competition is weak, entry and exit are limited, and a great deal of Ukrainian government policy continues to impede creative destruction by protecting incumbent firms and sectors from the rigours of the market. This has not prevented Ukraine from enjoying impressive growth over an extended period: real GDP growth averaged 7.4% during 2001-06, as the economy bounced back from the severe transition recession of the 1990s. There is more at work here than simply a post-crisis recovery: the achievement of macroeconomic stabilisation together with the structural policies of the late 1990s did much to harden firms’ budget constraints and unleash to some extent the forces of creative destruction. Yet sustaining strong growth over the long term is likely to prove extremely difficult unless the authorities take further steps to open up Ukrainian markets and allow needed structural change to unfold.
This paper considers both sides of the issue, looking at what has been achieved in terms of creating open and competitive markets in Ukraine and at the many barriers to entry, exit and reallocation that remain. It begins with an assessment of these processes in Ukraine today. The major conclusion that emerges from this analysis is that, while competition has been increasing in recent years and entry has become somewhat easier, exit mechanisms in Ukraine continue to function very poorly. The empirical
1. Economics Department, OECD, 2 rue André Pascal, 75775 Paris CEDEX 16, France;
evidence suggests that Ukraine has too little exit overall and that the link between productivity and exit is very weak. The survival chances of entering firms appear to suffer from the existence of a large population of low-productivity incumbents that seem to be shielded from the rigours of the market. Continued public support for an oversized state enterprise sector emerges as one of the main impediments to more efficient exit.
Since the barriers to more robust competition are largely the product of excessive and often ill-administered regulation, the second section of the paper presents a systematic assessment of product-market regulation (PMR) in Ukraine, using indicators developed by the OECD Economics Department. The results show that the overall burden of regulation in Ukraine is extremely heavy by OECD standards. Barriers to business development appear to be more of a problem than barriers to entry, although the latter are by no means negligible, and regulatory process also emerges as a particularly serious issue for Ukraine.
Finally, the paper presents the main findings of two empirical studies concerned with the potential benefits of opening up markets, via both increased competition and further privatisation. The overriding conclusions that emerge from these two lines of analysis are as follows:
• Market concentration has a negative and highly significant impact on labour productivity growth: a one percentage point decline in the Herfindahl-Hirschmann Index is associated with an increase in labour productivity growth of the order of 0.2–0.3%. Import competition has a positive impact on domestic firms’ productivity.
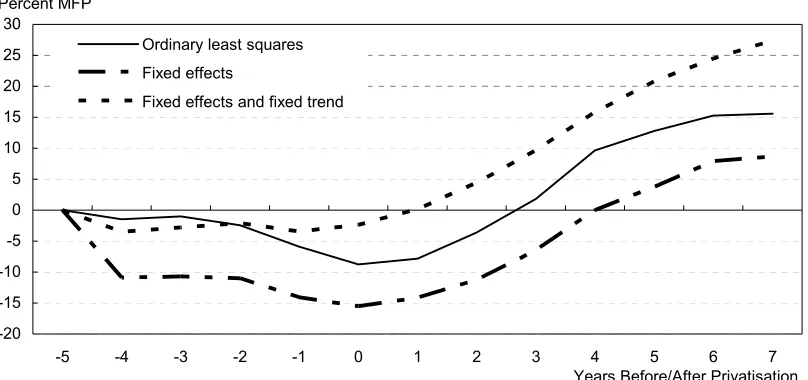
• Further privatisation could play a major role in stimulating greater dynamism and flexibility, particularly in conjunction with competition-enhancing regulatory reform: in the case of privatisation to domestic owners, total factor productivity increases by between 10 and 25%, depending on the specification used, during the seven years following privatisation.
As will be seen, the potential benefits arising from such reforms are likely to be particularly great in view of the complementarities that exist among them. Realising the full benefits of reform may thus require the creation of a broad, coherent and systematic framework for the conduct of regulatory policy, an area where policy-making in Ukraine has often been fragmented and poorly coordinated.
Structural change in Ukraine since the financial crisis
Increasingly intensive job reallocation has been productivity enhancing…
Productivity growth in industry was remarkably strong during 1999-2004 but slowed in 2005-06. Performance in manufacturing has been particularly impressive: manufacturing output rose by roughly 10% per year during 2001-06 and its share in total value added remained relatively stable at around 20%, manufacturing employment fell by approximately 15% over the period.2 Productivity thus rose by a
healthy 12.5% per year on average over 2001-06, despite a slowdown towards the end of the period. As expected, productivity growth has been significantly faster in industry than in services, especially non-market services.3 Productivity gains have been strong in most manufacturing sectors,4 which is hardly surprising in a phase of global recovery. These results in part reflect the more intensive use of production capacities: productivity gains have been somewhat stronger in industries that had more room to increase capacity utilisation.
2. The data refer to medium and large enterprises only. 3. See OECD (2007a:107).
Continued intensive labour-shedding also contributed significantly to the rise in productivity, at least until 2003 (Figure 1). This was undoubtedly a direct consequence of more active restructuring of firms, at a time when Ukraine was “catching up” on reforms in the transition process. While the speed of job reallocation between sectors and the pace of job creation were slower in Ukraine until the late 1990s, the rate of labour turnover and excess reallocation increased markedly at the end of the decade (see Table 1). The trend towards an increased fluidity of the labour market continued during 2000-06: the gross job turnover ratio, defined as the sum of hiring and firing over total employment, rose steadily, from around 45% in 2000 to 58% in 2005.5 Labour-shedding was particularly intense in the sectors which were most
[image:9.595.86.503.280.431.2]exposed to foreign competition: machine-building and, above all, light industry. In the latter, production has been increasing at a very modest pace, and productivity gains stem chiefly from falling employment. Since 2004, industrial employment has stabilised and productivity growth has slowed, which suggests that this phase of relatively “easy” restructuring is over.
Figure 1. Composition of industrial productivity growth
-10 -5 0 5 10 15 20 25
1996 1997 1998 1999 2000 2001 2002 2003 2004 2005 2006 %
Employment Production Productivity
Source: Derived from State Statistics Committee of Ukraine.
Table 1. Year by year job flow rates
(Percent of total employment in the sampled firms)
Creation Rate
Destruction Rate
Reallocation Rate
Net Change
Excess Reallocation
1992-93 1.1 8.3 9.4 -7.2 2.1
1993-94 1.2 11.6 12.7 -10.4 2.3 1994-95 1.3 11.1 12.4 -9.8 2.6 1995-96 1.6 11.2 12.7 -9.6 3.1 1996-97 1.6 11.2 12.8 -9.7 3.2
1997-98 1.7 10.0 11.7 -8.3 3.4
1998-99 2.4 10.1 12.5 -7.7 4.9
1999-2000 3.4 8.6 12.0 -5.2 6.8
Note: These flows are computed according to the methodology proposed by Davis and Haltiwanger (1992) but only on continuing firms, omitting flows associated with firm entry and exit.
Source: Brown and Earle (2004).
[image:9.595.98.491.499.641.2]
These findings on the role of labour-shedding are reinforced by a comparative analysis of the relationship between firms’ deviations from average labour productivity in their sectors and their employment share. This measures the degree to which employment reallocation is productivity-enhancing. The results in Table 2 show that the relationship across the entire period is far stronger in Ukraine and Russia than Romania and particularly Hungary. In part, of course, the fact that labour reallocation has been more productivity-enhancing in Russia and Ukraine probably reflects the inefficiencies and structural distortions that existed in those countries at the start of the transition: misallocation of labour was less of a problem in Hungary than in most transition countries, and it was generally worse in former Soviet republics than in Central Europe.6
Table 2. Correlation between labour productivity deviation and employment share change
1992-1995 1995-1998 1998-2001 2000-2003
Hungary 0.013 0.040 0.009 0.020
Romania 0.055 0.048 0.040 0.048
Russia 0.113 0.136 0.113 0.105
Ukraine 0.092 0.134 0.083 0.095
Note: These are correlations between, and the firms’ deviations from, sector labour productivity in the initial year and employment share changes between that and the next year. Entrant labour productivity is measured in the second year. The averages across the first two two-year periods within each four-year period are reported (i.e., for 1992-95, it is the average of 1992-93 and 1993-94).
Source: Brown and Earle (2007a).
…but entry and particularly exit mechanisms still works poorly…
A large and growing body of cross-national empirical work suggests that creative destruction remains critical to economic progress: higher firm turnover (i.e. higher entry and exit) is growth-enhancing.7
Moreover, as noted above, eliminating, or at least minimising, barriers to entry, exit and reallocation of resources is particularly critical in transition economies. Because the restructuring of large state-owned enterprises (SOEs) is fraught with difficulty and often subject to considerable delay, reducing barriers to
entry is particularly important: the entry of new enterprises and the growth of new activities has been a crucial engine of transformation in the more successful transition economies. Ukraine still has much to do on this score. Its small business sector is relatively under-developed and, on some indicators, it appears to be losing ground relative to the rest of the economy. While the official data are difficult to interpret, it seems clear that small business is developing far less robustly in Ukraine than in the transition countries of Central Europe or even in Russia.8 The economy – particularly the industrial sector – is still dominated by
the heavy industries that Ukraine inherited from the Soviet Union. Some of these sectors have been restructuring successfully, but their continuing dominance is one reason why so much policy since 1992 has been oriented towards averting rather than facilitating structural change. Efforts to protect established enterprises and sectors – in essence, impediments to exit – have helped retard the development of new
6. Ernst et al. (1995) compare the USSR, China, Poland, Hungary and the Czech Republic with respect to three indicators of readiness for the market transition – structural misdevelopment, institutional preparedness for a market economy, and macroeconomic disequilibrium – concluded that the Soviet economy was by far the least prepared on all three dimensions.
7. See the overview of the Schumpeterian approach in Aghion and Howitt (2006).
activities. Such pressures are not difficult to understand, given the fear of the costs of transition in the short term, but from a long-run perspective, policies that inhibit entry and exit can only be regarded as perverse. While there has recently been some progress in making entry easier, impediments to entry, exit and restructuring remain substantial.
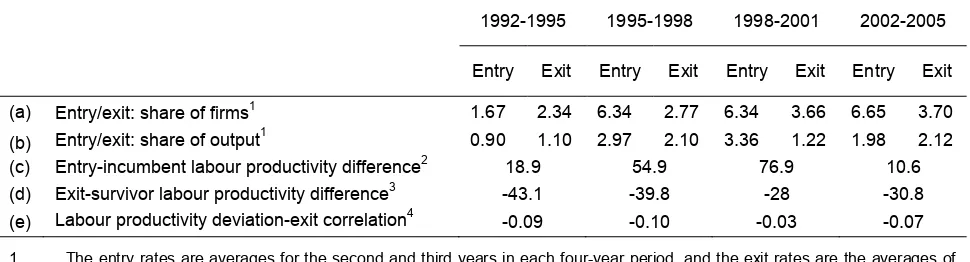
Empirical analysis confirms the impression that Ukraine has particular problems with exit. Census-type, firm-level data for Ukraine show overall firm turnover rates in manufacturing (entry plus exit) to be rather low by OECD standards – about 10% in 2002-05, as against rates of 15-20% typically found in mature market economies.9 As is evident from the data in Table 3 (row a), the level of exit is particularly
low. Entry is now less of an issue than it was: a comparison of firm-level data for Hungary, Romania, Russia and Ukraine shows extremely low levels of entry in Ukraine in the early 1990s, but entry rates rise sharply after 1995, reaching levels roughly comparable to Russia’s. When weighted by share of output, entry in Ukraine compares reasonably well to Hungary and Romania, as well as Russia (Table 3, row b). Moreover, entering firms in Ukraine are significantly more productive than incumbents – around 40% more productive on average, for the entire period from 1992 through 2005 (Table 3, row c).10 This means
that entry has been particularly good for aggregate productivity; it may also reflect entrants’ awareness of the difficult conditions in which they will operate – they will need to be exceptionally efficient to have a reasonable chance to survive and grow.11 This may be one reason why two-year survival rates in Ukrainian manufacturing – above 80% in the most recent period – are close to the highest rates found in developed OECD economies.12
The exit data suggest that one of the difficulties entrants face is that competitive conditions are by no means equal and that the selection of firms for exit is only weakly linked to performance. Exit rates in Ukraine are lower than in any of the other countries under study across the entire 1992-2003 period, and a number of indicators suggest that exit mechanisms in Ukraine are doing a poor job of ensuring that it is the less productive firms that exit the market. As one would expect, exiting firms are much less productive than survivors on average (Table 3, row d). However, the negative correlation between exit and productivity is weak in Ukraine, and there is no evidence to suggest that it is increasing over time (Table 3, row e). In Russia and Romania, the correlation tends to be about three times as strong as in Ukraine, and it is somewhat stronger in Hungary as well. More disturbing still is the fact that exiting new private firms are significantly more productive than surviving old firms (defined as those existing prior to the transition or ever having been state-owned), though they are somewhat less productive than surviving entrants (Table A2.1). This sort of “unnatural selection” for survival or exit is particularly evident in the production of machinery and equipment, electrical and optical apparatus, pulp and paper, and publishing and printing.
These results suggest that there is too much exit of new private firms in Ukraine, and too little exit of older firms. The fate of new entrants seems to be less clearly linked to productivity than it ought to be. This may be one reason why Ukraine also exhibits exceptionally high – and rising – labour productivity
9. Scarpetta et al. (2002) provide estimates for leading OECD economies for the early 1990s.
10. This is a striking result, albeit one also observed in Russia. The average productivity of entrants is generally lower than that of incumbents. Entrants are usually more productive than weak firms in a given sector but they may still be, initially at least, less productive than the average firm.
Table 3. Entry, exit and labour productivity differences, 1992–2005
1992-1995 1995-1998 1998-2001 2002-2005
Entry Exit Entry Exit Entry Exit Entry Exit
(a) Entry/exit: share of firms1 1.67 2.34 6.34 2.77 6.34 3.66 6.65 3.70
(b) Entry/exit: share of output1 0.90 1.10 2.97 2.10 3.36 1.22 1.98 2.12
(c) Entry-incumbent labour productivity difference2 18.9 54.9 76.9 10.6
(d) Exit-survivor labour productivity difference3 -43.1 -39.8 -28 -30.8
(e) Labour productivity deviation-exit correlation4 -0.09 -0.10 -0.03 -0.07
1. The entry rates are averages for the second and third years in each four-year period, and the exit rates are the averages of the second, third and fourth years in each four-year period.
2. Percentage differences between the unweighted average labour productivity of first-year entrants and that of incumbents. The reported numbers are averages for the second and third years in each four-year period.
3. Percentage differences between the unweighted average labour productivity of firms exiting in the next year and that of survivors. The reported numbers are averages for the first, second and third years in each four-year period.
4. Correlations between firms' deviations from sector labour productivity and exit in the following year. Entrant labour productivity is measured in the second year.
Source: Brown and Earle (2007a).
dispersion within sectors throughout the transition period (Table A2.2).13 By 2005, Ukraine had an
unusually large share of firms with labour productivity more than 50% below the sectoral mean (37.2%) and yet the smallest share of output produced by such firms (2.6%). This points to the existence of a very large population of small, unproductive firms that are neither being selected for exit nor compelled by competitive pressures to raise their productivity in order to survive.
These results suggest that there is too much exit of new private firms in Ukraine, and too little exit of older firms. The fate of new entrants seems to be less clearly linked to productivity than it ought to be. This may be one reason why Ukraine also exhibits exceptionally high – and rising – labour productivity dispersion within sectors throughout the transition period (Table A2.2).14 By 2005, Ukraine had an
unusually large share of firms with labour productivity more than 50% below the sectoral mean (37.2%) and yet the smallest share of output produced by such firms (2.6%). This points to the existence of a very large population of small, unproductive firms that are neither being selected for exit nor compelled by competitive pressures to raise their productivity in order to survive.
…and competition remains weak
Given such low levels of entry and exit, it is no surprise that product markets in Ukraine are not, as a rule, characterised by robust, dynamic competition. On the contrary, markets tend to be highly concentrated and heavily regulated. The country’s competition authority, the Anti-Monopoly Committee of Ukraine (AMCU), estimates that firms operating in sectors characterised by the structural pre-conditions for competition – that is, by the absence of monopoly or the concentration of substantial market power in
13. Estimates for 18 NACE two-digit manufacturing sectors show that the productivity difference between firms in the 10th and 90th percentiles in 2005 had reached an average of 4.03, and in only one sector was this figure below 3.5. In neighbouring Hungary, by contrast, the corresponding figures for all sectors but one were below 3.
the hands of one or a few firms – generated only around 55% of total sales in 2004, against roughly 45% of sales arising in situations of monopoly, market dominance or oligopolistic competition.15 In many cases,
the less competitive markets are in heavy industrial and infrastructure sectors, where high levels of capital intensity constitute barriers to entry.16 The Committee notes that this assessment is based solely on market
structure; it omits regulatory and other interventions in product markets that reduce or eliminate competition where it might otherwise be expected to develop.17 As will be seen below, these additional
impediments to competition are considerable. The AMCU’s estimates correspond fairly well to the results of managerial surveys concerning the level and intensity of competition in particular markets.18
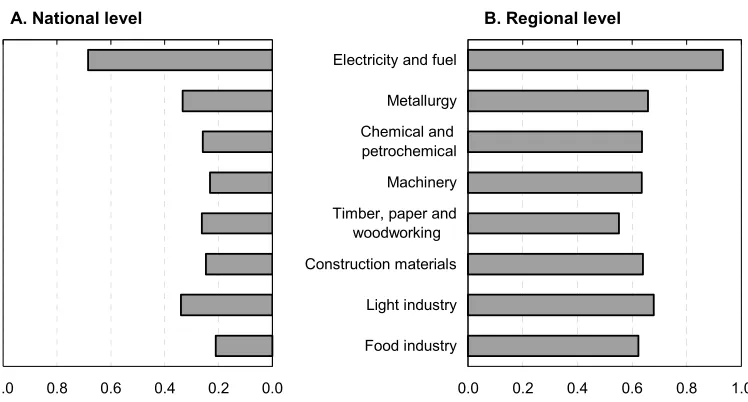
They also find confirmation in the Herfindahl-Hirschmann indexes (HHIs) shown in Figure 2. Calculated on the basis of a 5-digit classification, the indexes show very high degrees of market concentration overall. Indeed, they are higher than the comparable indicators for Russia in every major sector. Concentration levels have tended to rise in key export sectors in recent years, including metallurgy, chemicals, machine-building and food, while they have declined modestly in the construction materials and light industries. Figure 2 also shows that competition is much weaker at regional level, which suggests a high degree of segmentation between regional markets. This segmentation, which owes much to the actions of sub-national governments, is particularly evident in the gap between national- and regional-level HHIs for the food industry, a sector in which regional and municipal authorities are particularly prone to intervene.
In certain sectors, the high levels of market concentration reflect the relatively large share of output that is generated in highly monopolised and largely unrestructured network industries. In 2006, more than 2 300 companies were classified as “natural monopolies”,19 most notably in sectors such as gas, electricity,
heat and other municipal utilities, as well as rail transport and telecommunications. Around ten of these were national-level players, with the rest dominating specific regional or local markets. To these one might add a few important but rather less natural monopolies, such as RosUkrEnergo, the controversial Swiss-registered company that in 2006 became a monopoly supplier of Russian and Central Asian natural gas to
15. See AMCU (2006) for details. The committee estimates that 9% of sales were in monopoly-dominated sectors and a further 35-36% in sectors characterised by market dominance or oligopolistic competition. 16. Examples include mining (apart from coal and peat), coke production, mobile and terrestrial telephony,
brewing, tobacco and motor fuels, as well as some sub-sectors of chemicals and machine-building. 17. AMCU (2006), esp. at Table 3 and Figure 3.
18. According to NTK (2006), 52% of managers described competition on the markets in which they were operating as “substantial”; 34% called it “moderate” and 14% weak or non-existent.
Figure 2.. Herfindahl-Hirschmann concentration indexes, 2005
B. Regional level A. National level
0.0 0.2 0.4 0.6 0.8
1.0 0.0 0.2 0.4 0.6 0.8 1.0
Electricity and fuel
Metallurgy Chemical and petrochemical
Machinery Timber, paper and
woodworking Construction materials
Light industry
Food industry
Source: OECD calculations using the register of Ukrainian enterprises, 2000-05.
Ukraine, and its domestic arm Ukrgaz-Energo.20 Despite the large role played by such companies in the
economy, monopolies regulation in Ukraine is almost uniformly weak and the reform of major infrastructure sectors has made little progress. Tariff-setting for regulated monopolies tends to be opaque, fragmented and highly politicised. As a result, monopoly suppliers in some spheres are required to under-charge, providing implicit subsidies to some or all of their consumers, while in other sectors, there is evidence of spectacular profits being earned by regulated industries. In either case, the result is inefficient spending and the distortion of competition, not only in network industries but in other sectors as well: mis-priced energy, for example, biases competitive conditions in favour of less energy-efficient firms and sectors.
While the concentration measured by HHIs has not decreased significantly over the last five years, managerial surveys suggest that pressure from domestic and foreign competitors increased steadily in the early 2000s, although foreign competition appears to remain a negligible factor for most domestic firms (Figure 3).21 This result is not as paradoxical as it might appear. The strength of competition depends not
only on the degree of market concentration or the development and enforcement of competition law, but also on trade policy, the creation of an effective bankruptcy mechanism, privatisation and sectoral regulatory policies – in other words, on the whole complex of policies and institutions that allow the threat of competition to emerge. Thus, although both the legal instruments and the institutions concerned with competition policy have been improving, the increasing intensity of competition probably owes more to privatisation, liberalisation and stabilisation than to competition policy per se.22
20. Ukrgazenergo is a 50/50 joint venture of RosUkrEnergo and Naftogaz Ukrainy; see IEA (2006), Chapter 6, for details.
21. See, in particular, NTK (2006) and IERPC (2006). Note, however, that IERPC (2006) sees some evidence that the degree of competitive pressure either stabilised or even fell slightly after 2004.
Figure 3. Managerial assessments of competitive pressure
Shareof enterprises reporting competitive pressure as a constraint on growth
5 10 15 20 25 30 35 40 45
Q1 99
Q3 Q1
2000
Q3 Q1
2001
Q3 Q1
2002
Q3 Q1
2003
Q3 Q1
2004
Q3 Q1
2005
Q3 Q1
2006
Q3 Q1
2007 Competition from foreign producers
Competition from domestic producers
Source: Scientific and Technical Complex for Statistical Research.
Competition policy has improved but much remains to be done
High levels of market concentration and weak competition are partly a product of Ukraine’s inherited economic structure, but they are also, in large measure, the product of misguided policies. Throughout the transition period, successive Ukrainian governments have adhered to a wide range of practices aimed at supporting existing economic sectors and protecting incumbent firms. To be sure, competition law is now much improved and, on paper at least, it is broadly in line with international norms,23 but anti-competitive
policies and practices are still widespread.24 The barriers to exit outlined above serve to suppress
competition and thus to delay rather than to facilitate needed structural change. This cannot but impede any attempt to enhance Ukraine’s competitiveness over the long term, since the most potentially competitive firms and sectors are handicapped by the cost of supporting less efficient rivals. Broadly speaking, weak competition in product markets reflects not only economic barriers, but the interaction between market structures, regulatory practices and weak institutions.
• Market structures largely define the terrain on which competition law is applied. Given the presence in Ukraine of so many sectors with relatively high degrees of concentration, it is not surprising that roughly half the AMCU’s caseload concerns alleged or actual abuse of dominant position. Most of these concerned monopoly pricing or attempts to restrict supply to particular customers or markets. As the economy has matured and Ukrainian industrial organisation has become more complex, the importance of collusion has grown, but dominance cases are still the most common.
23. See OECD (2007a:119).
• The significance of regulatory practice is highlighted by the fact that fully one-quarter of the AMCU’s caseload in 2000-05 consisted of cases against public authorities engaged in actions that reduced, distorted or eliminated competition in particular markets. The great majority of these cases were in markets where the structural preconditions for competition did exist. A large proportion concerned the deliberate administration of various regulatory regimes – ranging from sanitation and fire-safety to standardisation and certification – so as to limit competition or prevent entry.
• These problems are compounded by the weakness of institutions in Ukraine. The weakness of the rule of law in general, and of the court system in particular, means that entrepreneurs are hesitant to rely on law to seek redress in the event of unfair competition. More generally, agents recognise that the ability of rivals to tap “administrative resources” – i.e. to draw on the implicit or explicit favour of state bodies – can enable them to violate competition rules with impunity.25 This
awareness creates incentives to accumulate administrative resources of one’s own: firms that do not develop the necessary relationships with key public officials will suffer for it, so even managers who might prefer (and profit from) fair, transparent, rules-based competition must play this game.26
The prevalence of anti-competitive regulatory practice (which is illegal under the Law on Regulatory Policy) underscores the link between competition issues and the kind of regulatory reform discussed in conjunction with the PMR assessment presented below. The AMCU reckons that, if formal and informal barriers between regional and local markets are taken into account, then the proportion of sales generated in markets where the conditions for robust competition prevail stands as low as 30%: in many regions, competition is restricted not only in such spheres as housing and utilities, which are still dominated by SOEs and municipal enterprises, but also in food and food-processing, retail trade, transport and construction. This view is confirmed to some extent by the very high regional HHIs presented above. Yet the AMCU data tell only part of the story: much of the anti-competitive behaviour of state and municipal institutions is perfectly legal and is therefore not reflected in AMCU enforcement statistics. Implicit and explicit subsidies to selected companies and sectors (particularly SOEs) distort competition, as do many other initiatives taken in the name of local or national “industrial policies” that effectively privilege “priority” sectors at the expense of others.
A consistent, broad-based policy of de-regulation could also do much to address these problems, since excessive and often inconsistent regulation tends to create opportunities for arbitrary bureaucratic action, favouritism and rent-seeking. However, in many spheres, Ukraine needs better regulation rather than simply less regulation. This will require correcting the many gaps and contradictions that exist in legislative and regulatory frameworks, as well as evolving a more coherent approach to regulatory policy overall.
Reducing barriers to entry, exit and reallocation: the role of product-market reform
Regulatory reform can make a significant contribution to resolving the problems identified above, by reducing barriers to entry and removing obstacles to firms’ growth once they have entered the market. Recent empirical work on product-market regulation (PMR) highlights the extent to which restrictive regulations impede entry and slow the diffusion of new technologies and practices across firms and
25. Official favouritism is a widely recognised problem: an IFC managerial survey in 2003 found that 61% of respondents regarded unequal conditions of competition as a serious or very serious problem for their businesses.
sectors.27 Competition-enhancing PMR reform can help raise productivity growth through a number of
channels, including the direct impact of competition on both market efficiency and technical efficiency,28
as well as its indirect impact via the role of competition in spurring innovation.29 Finally, Alesina et al.
(2003) find that reforms which liberalise entry are likely to spur fixed investment in some sectors. Regulatory reform thus has a role to play in addressing a host of economic challenges identified in this report: reducing impediments to entry and business development, stimulating competition, raising the investment rate and attracting FDI.
The regulatory framework in Ukraine: a comparison with OECD countries
With these considerations in mind, the OECD Secretariat in early 2007 undertook an assessment of Ukraine against the product market regulation (PMR) indicators developed by the OECD Economics Department in recent years.30 The indicators are based on detailed questionnaires concerning regulatory
policy, which are submitted by the Secretariat to participating governments. This makes it possible to benchmark Ukraine’s regulatory policies against those of OECD members, and to draw more easily on the experience of OECD members in identifying those areas in which regulatory reform might be most profitable. The questionnaires are divided into three broad groups: domestic barriers to entrepreneurship, state control and barriers to trade and investment. This permits an assessment of both inward- and outward-oriented policies. (Annex A describes the PMR review process in more detail and presents the full results for Ukraine.)
Before examining specific indicators, it is worth highlighting four broad conclusions that emerge from the PMR review of Ukraine:
• The level of overall product-market regulation is higher than that of any OECD country in 2003 (Figure 4).31 It should be noted, moreover, that many of the poorer performers in the OECD’s
2003 PMR assessment have since undertaken regulatory reforms: Poland, for example, has adopted legislation to reduce substantially the administrative burdens on start-ups and has taken steps to reduce uncertainty about the application of tax regulations.
27. See Conway et al. (2006), especially on the diffusion of information and communications technology and the location decisions of multi-national enterprises. See also Lewis (2004) for the results of a large body of micro-level studies of industries in 13 countries conducted by the McKinsey Global Institute.
28. Nicoletti and Scarpetta (2003); Conway et al. (2005). 29. Aghion et al. (2001, 2005).
30. The indicators for Ukraine were calculated based on the regulatory policies in place at end-March 2007. In some cases, policy settings have changed since then.
Figure 4. Aggregate product-market regulation indicator
OECD average 2003
0.0 0.5 1.0 1.5 2.0 2.5 3.0
AUSGBR ISLUSAIRLDNKNZLCANSW E
LUXJPNFINBELNLDAUTSVKDEUNORKORPRTESPCHEFRACZEGRC ITAHUNMEXTURPOLUKR
• The burden of product-market regulation is well above the OECD average with respect to all three major components of the aggregate indicator: state control, barriers to entrepreneurship and barriers to trade and investment (Table 4). However, it should also be noted that Ukraine does relatively well on a number of the sixteen individual indicators, particularly in areas where reforms have recently been enacted. The level of sector-specific regulation is also comparatively low, as Ukraine has adopted a fairly liberal stance with respect to a number of industries that are often heavily regulated elsewhere.
Table 4. Summary indicators of product-market regulation
OECD
Ukraine Brazil
Average Low High
Product-market regulation 1.5 0.9 2.8 2.8 1.9
State control 2.1 0.6 3.6 2.7 2.5
Barriers to entrepreneurship 1.5 0.8 2.5 2.4 1.3
Barriers to trade and investment 1.0 0.3 2.4 3.3 1.9
• Overall, barriers to business growth appear to be more constraining than barriers to entry.
• Regulatory process is in some respects as much of a problem as the substance of regulation. Ukraine scores rather poorly on indicators concerned with such issues as the formulation of regulatory policy and effective communication with the business community.32
The problem of poor regulatory process reflects in part a failure to define with clarity the various roles that the state is expected to play in the economic life of the country or to differentiate between them in ways that avoid undesirable conflicts of interest, particularly where commercial activities and the state’s ownership function overlap with its regulatory and policy-making functions. Developing a clearer, more coherent understanding of the state’s role in a market economy thus represents one of the most basic challenges of regulatory reform.
[image:18.595.86.509.424.518.2]
Analysis of the specific PMR indicators provides a much richer picture, albeit one consonant with these general conclusions. However, when interpreting the detailed results of the PMR review, it should be borne in mind that the questionnaires represent an assessment of formal regulatory policy settings: they do not provide any information about the way in which these policies are implemented. In the case of Ukraine, this is a particularly important point in view of its institutional weaknesses. Widespread official corruption, the weakness of the rule of law, the inefficiency of public bureaucracies and the often confused and incomplete character of legal and regulatory frameworks mean that the actual regulatory policies may deviate from, or even contradict, formal policy settings. In many instances, formal regulatory policies appear to have improved substantially, but the implementation of those policies remains incomplete and inconsistent. Nevertheless, it would be a mistake to conclude that legislative or regulatory reform is ineffective or unimportant: it is neither. As will be seen, a good deal of evidence suggests that improvements in formal policy settings do result in real improvements in the business climate even when implementation is patchy; however, the effects are less pronounced, less predictable and less widespread than they would be in a better institutional setting.
Conditions for start-ups are easier, but barriers to entry for foreigners remain very high
One area where Ukraine ranks relatively well concerns the procedures for starting a new business. Ukraine is well below the OECD average on the start-up indicator for new companies and only slightly above it on the indicator for sole proprietors (Figures A9 and A10). This would appear to reflect recent efforts to improve conditions for entry. Moreover, other evidence suggests that, despite incomplete implementation, new legislation aimed at creating a “one-stop shop” registration process for new businesses really has had a marked positive effect.33 In a significant minority of cases (around 25% for
legal persons and 30% for private entrepreneurs) registration still takes longer than the law envisages, though officials attribute many of the delays to failure on the part of applicants to prepare the necessary documentation ahead of time.34 Broader questions of entry are addressed below, but it is important to note
in this context that, despite the recent changes, start-up procedures remain costlier and more time-consuming in Ukraine than in most of the region. The simplification of registration procedures has reduced the gap significantly but it has not closed it. The remaining problems concern the many post-registration procedures a new business must go through before starting to operate.35
The situation facing would-be foreign entrants is somewhat more complex. On the whole, Ukraine’s economy is in many respects quite open, and this is reflected in the PMR indicator for barriers to foreign ownership (Figure A14). This shows Ukraine close to the OECD average in terms of restrictions on foreign acquisitions in “sensitive” sectors – though the indicator fails to pick up quite serious restrictions on foreign investors’ acquisition of land.36 Regulatory barriers, however, are another matter (Figure A17). The
principle of national treatment in respect of regulatory policy is not enshrined in law, and foreign companies do not, as a rule, have the right to seek redress through the competition authority, trade policy bodies or regulatory agencies. Ukrainian legislation does not require regulators to use internationally harmonised standards and certification procedures whenever possible and appropriate. While the authorities have in recent years laid great stress on the need to bring primary and secondary legislation into
33. A major survey of entrepreneurs showed that they were broadly satisfied with the new arrangements; see “Derzhavna” (2006). Between 2005 and 2006, Ukraine rose 21 places on the “start-up” indicator of the World Bank’s “Doing Business” data base, which is based on assessments of the actual time and cost involved, rather than the formal rules.
34. See the survey data in ICS (2006) and “Derzhavna” (2006).
line with international (and, in particular, EU) norms, local standardisation and certification requirements, many of them left over from the Soviet era, continue to be applied. This complicates both foreign trade and investment, since it greatly adds to the cost of introducing (via imports or local production) products that are new to the Ukrainian market, even if these have been certified elsewhere. This problem is compounded by the overlapping jurisdictions of various regulatory bodies, which mean that the very same goods and services may be subject to inspection and certification on precisely the same grounds by a number of different agencies. Progress in reducing the redundancy in certification and standardisation has been limited, owing largely to resistance from the regulatory bodies involved.37 Finally, it should be noted that
Ukraine has not engaged in mutual recognition agreements with any other countries.
Overregulation impedes business growth and development
While market entry in Ukraine has recently become somewhat easier, the regulatory impediments to growing businesses of whatever size remain extremely onerous. As noted above, the sheer complexity of regulation – much of it unnecessary – is difficult to exaggerate. The authorities are well aware of this and, in an effort to address the problem, they undertook a “quick de-regulation initiative” in 2005. This involved a review of 9 340 national regulations, of which 5 184 were found to violate the law on regulatory policy. Some 4 940 were amended or repealed.38 In addition, no fewer than 66 presidential decrees were
found to be in violation of the law. Unfortunately, phase 2 of the initiative, which was to be focused on sectoral legislation, never took place, despite having been authorised by the president, and the process of issuing new regulations carried on unabated. In any case, it is impossible to judge the impact of such an exercise in terms of the number of rules abolished: critics argue that the vast majority of the regulations that were scrapped were no longer being applied anyway, and the review was not accompanied by any systematic assessment of the quality of the regulations that remained.39
Particularly problematic in this context is the regulatory burden associated with licensing and permits: on this indicator, Ukraine ranks alongside the most heavily regulated OECD members (Figure A7). One of the biggest complaints of entrepreneurs in Ukraine concerns the pervasive system of permits, which businesses have to obtain and renew regularly in order to engage in almost any form of commercial activity.40 This is, of course, a barrier to market entry – ordinarily, an entrepreneur starting a new business
must secure a large number of different permits before he can start operating – but it is not limited to start-ups, since the vast majority of permits must be renewed at regular intervals. It therefore marks an impediment to the development of any business. The situation with respect to permits (but not licences) has recently improved markedly. A law on the permit system was adopted in late 2005, in an effort to engineer a radical reduction in the number of permits issued by central, regional and local authorities. In order to ensure that the law’s effect was not limited to a one-off reduction in the number of permits, it introduced new restrictions on the ability of state agencies and municipalities to create new permits. Yet even in the wake of this undoubtedly important reform, Ukraine still compares very poorly to the great majority of OECD members when it comes to licensing and permits. In fact, the situation is probably somewhat worse than it appears, since the implementation of the new law on permits is still far from complete: a number of other statutes have yet to be brought into line with the law on the permit system, and many state and
37. Perhaps the most striking example here has been resistance to implementation of the 2005 food safety law, which sought to put an end to triple control of all food imports – by the veterinary and sanitation inspectorates (separately), as well as by the standards body, the State Committee for Technical Regulation and Consumer Policy.
38. The corresponding figures for local regulations reviewed were 5 386, 1 750 and 1 358, respectively. See “Shchodo” (2006).
39. Balcerowicz and Ustenko (2006:20-1).
municipal agencies simply continue to administer permit systems in contravention of the law. Nevertheless, even partial implementation of the law does appear to have had a palpable positive effect: a 2006 IFC survey found that the average time spent on obtaining permits had fallen by around 30%.
The next logical step in this sphere is meant to be a new law on licensing, which was submitted to parliament in the first half of 2007. The present law identifies 69 types of activity that may be subject to licensing requirements, despite the fact that it does not cover the activities most commonly subject to licensing regimes in other countries, such as financial services and telecommunications; these are dealt with in separate legislation. At present, Ukrainian law does not even contain any criteria stipulating when licensing regimes may be allowed; there is only a general statement that they should not be used to restrict competition. The need here is not only for less regulation – far too many activities are subject to licensing regimes, and new regimes are being created all the time – but also for better regulation – compliance with the terms of licences is often monitored poorly or not at all. Where licenses are deemed to be necessary, there need to be effective monitoring and enforcement mechanisms if they are to fulfil their purpose.
In this context, it is also important to highlight the large number of regulations that simply raise transaction costs and thereby reduce the efficiency of product markets. Business surveys consistently draw attention to the extraordinarily complex and cumbersome rules governing the execution and registration of transactions involving land. These are particularly burdensome for non-residents, but even Ukrainian individuals and entities find it time-consuming and costly to purchase or lease real property: in the World Bank’s “Doing Business” indicators, Ukraine ranks 133rd with respect to the registration of rights to real property.41 However, on a day-to-day basis, the mandatory notarisation requirement applied to many
routine transactions is likely to be even costlier to many firms. For example, the requirement that all lease agreements with terms of over one year be notarised imposes a fee equal to 1% of the value of the transaction on the contracting parties. Mandatory notarisation of a company charter likewise costs 1% of the authorised capital, which can be a substantial amount. The notarisation requirements, moreover, are symptomatic of a much larger body of rules and regulations that impose hidden charges on, and put unnecessary obstacles in the way of, perfectly ordinary transactions. The vestiges of the country’s currency-control regime mean that any activities involving foreign currency cost more and take longer, and the overregulation of ordinary financial activities means that even domestic transactions, like purchases of securities and inter-company loans, are more difficult to execute.42 Over-regulation in these and other
spheres does little to make the investment climate more orderly or transparent and serves mainly to distort markets, encourage shadow activity and create opportunities for official corruption.
Regulatory process remains a problem
As noted above, Ukraine’s 2003 Law on the Fundamentals of Regulatory Policy is impressive on paper but has not yet been fully implemented. This weakness is reflected in a number of PMR indicators concerned with the process, rather than the substance, of regulation. Ukraine’s poor score on the simplification and communication indicator (Figure A8), for example, largely reflects the lack of an integrated, explicit strategy of regulatory reform. There is no government-wide programme aimed at reducing administrative burdens on enterprises and citizens, nor does the central government even have a comprehensive picture of what these are, since it lacks a complete count of all the licences and permits required. The failure to establish systematic procedures for providing information about the enforcement or operation of regulations affects both domestic and foreign investors, who have complained about the difficulty of obtaining timely, authoritative clarifications of the meanings of particular regulations from the
41. In 2006, registering real property involved 10 distinct procedures and took an estimated average of 93 days, costing 3.4% of the value of the property. See EBA (2006:28-41) for details of the obstacles facing non-residents; see also OECD (2004b:27-28).
State Tax Administration and other bodies.43 Lack of information on the application and enforcement of
regulations puts entrepreneurs at a particular disadvantage, given that they also lack an automatic right of non-judicial appeal in the event of adverse regulatory enforcement decisions. In short, they can fall foul of the regulator for lack of information and then be unable to appeal the decision unless they choose to litigate. Here again, the problem of regulatory uncertainty looms large – and creates opportunities for bureaucratic rent-seeking.
In other fields, it is implementation of regulatory policies that is the problem. Thus, while the framework law on regulatory policy made regulatory impact assessments (RIAs) a general requirement for all new regulatory acts, the Council of Entrepreneurs attached to the Cabinet of Ministers of Ukraine concluded in 2006 that many regulatory acts were still being promulgated without RIAs and that many of the RIAs being prepared were of poor quality and did not conform to the methodological guidelines for such assessments. Similarly, the formal requirement that regulators assess alternative policy instruments (regulatory and non-regulatory) before adopting new regulations is often breached – not least because no guidance on using alternatives to traditional regulation has ever been issued. Questions of implementation, transparency and policy process are, of course, closely interlinked, since a lack of transparency will tend to reduce the likelihood that regulatory policy processes will be observed when officials or politicians would find it more convenient to ignore them.
Excessive state ownership adds to the impediments to efficient exit
The state remains an extremely important player in the economy, not only through regulation and the provision of public goods and services, but also via its ownership of substantial productive assets. Ukraine’s state-owned enterprise (SOE) sector remains fairly large, a fact that is reflected in the very high scores shown for the PMR indicators on the size and scope of the public sector (Figures A2 and A3).44
Overall, the private sector accounts for only about 65% of GDP. On the official data, roughly 48% of the country’s capital stock was in the hands of the state or municipal authorities at the end of 2005, with a further 10-11% in mixed public-private ownership. Wholly private entities appear to have controlled around 41% of the capital stock.45 The latter figures reflect the extent to which the state’s remaining
industrial holdings are concentrated in capital-intensive sectors, such as the defence-industrial complex, heavy machine-building, the power sector and public utilities. In many cases, continued state ownership of such assets creates conflicts of interest for the authorities (particularly where the state’s role as regulator is in tension with its role as owner) and serves to distort competition. Moreover, the weak corporate governance of most SOEs means that many, perhaps most, such enterprises are easy targets for rent-seeking by insider-managers or well connected outsiders, be they private businessmen or officials involved in overseeing the enterprises.
The size of the SOE sector serves to limit exit and restructuring – and, in consequence, new entry. The large population of state-owned enterprises remains a drain on the budget, and well over half those transfers are subsidies to SOEs or transfers to ministries and other bodies administering subsidy
43. See EBA (2006:64-65); and Balcerowicz and Ustenko (2006:31).
44. Figure A1.4 shows that Ukraine actually ranks somewhat below the OECD average on other methods of direct control: the state owns a great deal, but it does not seek to exercise special rights over formerly state-owned enterprises via golden shares and other such mechanisms.
programmes.46 Yet although the problems associated with the continued existence of such a large
population of SOEs are widely recognised, privatisation has effectively been stalled for the last few years. The only major privatisation deal recorded in 2005 was the re-privatisation of the steel concern Kryvorizhstal, and there were no really large deals in 2006 – total privatisation income amounted to just 0.1% of GDP. Several major sales had been planned for the year but all were postponed. This is nothing new: privatisation plans are legislated annually but in recent years they have generally not been fulfilled.
Overall, barriers to exit may be even more significant than restrictions on entry
Continued support for inefficient SOEs is part of a larger problem with exit, which – perhaps surprisingly – appears on many indicators to be as difficult as entry in Ukraine. Barriers to exit impede the efficient reallocation of resources among firms and sectors and reduce the incentives for firms to restructure. In the end, of course, they constitute barriers to entry as well, since they prevent the release of production factors that might otherwise be available to new entrants. Relative both to its peers in the region and to OECD members, Ukraine fares much worse on indicators of ease of exit than it does with respect to entry. According to the World Bank, the closure of a business in Ukraine typically costs 42% of the value of the estate, as against an average of 14.3% for transition countries as a group and 7.1% for OECD members. The process leaves an average rate of recovery for creditors of just 8.7%. And while it is generally faster than the transition country average (2.9 years rather than an average of 3.5 for the region), it is still very slow compared to the OECD average (1.4 years). These difficulties appear to reflect a combination of defects in bankruptcy procedures – both problems with the legislation and problems with its administration – and the tendency of the tax authorities to view any form of exit as an attempt at tax evasion.47 The tax service can tie an enterprise up for years in audits and inspections before allowing its
principals to wind it up. It is symptomatic of this situation that the fees paid to intermediaries in Ukraine to wind up businesses are often far higher than those paid for starting them up, because the queues are longer and the procedures more complex.
Ukraine’s current bankruptcy law, which entered into force in 2000, represents a marked improvement on its predecessor, particularly with respect to debt-restructuring procedures, the priority ordering of creditors, the protection of creditors’ rights in the event of liquidation, and third-party fulfilment of debtor liabilities.48 The law also provides additional mechanisms to limit opportunities for
insiders to “gamble on resurrection”49 or to strip assets from companies that are in trouble.50 Apart from the quality of jurisprudence (many judges still lack the expertise needed to handle bankruptcy cases), the main problems that remain concern the bankruptcy of entities in which the state holds 25% or more of the equity. Since November 2001, there has been a moratorium on the mandatory disposal of the assets of such
46. World Bank (2006:41).
47. This attitude is not without foundation, given the large role played by shell companies and so-called “one-day firms” in many tax avoidance schemes.
48. There are, however, many aspects of the law’s provisions that, while broadly positive, are imprecise and therefore difficult to apply in practice; see EBA (2006:52-3)
49. If secured creditors are certain of recovering collateral, they can lend to a failing enterprise with confidence. Incumbent managers in trouble therefore borrow against assets. Managers, equity holders and “late” secured creditors thus form a coalition that may keep the enterprise afloat longer than otherwise, running up larger debts and leaving other creditors little or nothing when the firm fails.
entities, whether inside or outside of bankruptcy proceedings.51 In theory, the moratorium is to apply only
until a suitable mechanism for handling such asset disposal is devised, but no such mechanism has been created. As a result, creditors of enterprises where the state holds a blocking stake are limited in their right to recover debts via bankruptcy. This is not a merely theoretical problem: Leonov and Zhuk (2005) report that 25 companies with state shareholdings in excess of 25% went bankrupt in the first half of 2002 alone.
If a bankruptcy case ends in liquidation, the proceeds are used to satisfy the claims of creditors according to a modified version of the absolute priority rule employed in many western jurisdictions. However, the Ukrainian law gives taxes, duties and any claims of the central authorities monitoring state reserves priority over the claims of other unsecured creditors. The moratorium and the priority ordering are important issues even in cases that are unlikely to result in the winding up of the debtor firm, because the calculations of all the participants in a bankruptcy process are shaped from the outset by an awareness of their expected returns in the event of liquidation.
Implicit and explicit subsidies, though declining, persist on a large scale
Pressure to restructure or wind up many inefficient firms, in both state and private sectors, is in any case limited by the widespread, albeit declining, availability of explicit or implicit subsidies to favoured enterprises. It is difficult to assess with precision the degree of subsidy extended to particular economic sectors: comprehensive data on tax expenditures are not presented in the fiscal accounts and the extent of implicit subsidies arising from price regulation is even harder to gauge. Nevertheless it is possible to gain a rough sense of the sums involved. According to the Ministry of Finance, direct support from the state budget to industry amounted to just under 5.8 bn UAH in 2006 and is projected to rise to almost 10.7 bn in 2007 – around 1.7% of anticipated GDP. The vast bulk of this (around 75% in 2006 and 85% in 2007) consists of support for the coal industry, with the power sector accounting for most of the rest (1.1 bn UAH in both years). OECD (2007) estimates budgetary support for agriculture at 6.2 bn UAH, if both tax expenditure and direct subsidies are included.
A recent World Bank (2006) assessment estimates the ratio of tax expenditures to GDP in 2005 at 3.2%, down from 7.6% in 2002.52 The abolition of tax and customs privileges for Ukraine’s Free Economic
Zones (SEZs) in 2005 marked an important step in curtailing inefficient tax expenditures53 and the current
figure is not exceptionally large by the standards of some OECD members – tax expenditures take place on
51. In 2004, the moratorium was made retroactive to the beginning of 2000 with respect to bankruptcy cases involving mining enterprises (including coal pits, ore mines, open-cast mines, digging fields, ore-dressing plants, and coal-mining enterprises) in which the state held at least a 25% stake. Cases initiated after 1 January 2000 had to be withdrawn.
52. The sharpest reduction in tax expenditures came in 2004. It resulted from a number of factors, including: a drastic reduction in the VAT exemption on medicines (this alone cut tax expenditures on VAT by close to 1% of GDP), a similar limitation of the VAT exemption in publishing, the elimination of a number of exemptions from excise taxes, and a general tightening of the State Tax Administration’s attitude towards the application of exemptions. (In addition, there were some changes to the criteria used in estimating tax expenditures, but they were not the primary factor.)