Gut microbiome identifies risk for
colorectal polyps
Ezzat Dadkhah,1 Masoumeh Sikaroodi,1 Louis Korman,2 Robert Hardi,3 Jeffrey Baybick,2 David Hanzel,4 Gregory Kuehn,5 Thomas Kuehn,5 Patrick M Gillevet 1
To cite: Dadkhah E, Sikaroodi M, Korman L, et al. Gut microbiome identifies risk for colorectal polyps. BMJ Open Gastro 2019;6:e000297. doi:10.1136/ bmjgast-2019-000297
►Additional material is published online only. To view please visit the journal online (http:// dx. doi. org/ 10. 1136bmjgast- 2019- 000297).
This work has been presented in part at Digestive Disease Week, 6–9 May 2017, Chicago, IL, USA. Gastroenterology. 2017 Apr;152 (5, Suppl 1):S152. DOI: https:// doi. org/ 10. 1016/ S0016- 5085( 17) 30830- 2.
Received 7 March 2019 Revised 23 April 2019 Accepted 2 May 2019
1Microbiome Analysis Center,
George Mason University, Manassas, Virginia, USA 2Capital Digestive Care, Chevy
Chase, Maryland, USA 3Capitol Research, Bethesda,
Maryland, USA
4Naked Biome, San Francisco,
California, USA
5Metabiomics, Aurora, Colorado,
USA
Correspondence to Dr Patrick M Gillevet; pgilleve@ gmu. edu © Author(s) (or their employer(s)) 2019. Re-use permitted under CC BY-NC. No commercial re-use. See rights and permissions. Published by BMJ.
Summary box
What is already known about this subject?
► Colorectal cancer (CRC) is the third most common cancer and fourth most common cause of cancer death in the world.
► Many studies have reported gut microbiome dysbi-osis as a factor in the aetiology of adenoma and the progression to CRC.
► Characterisation of these complex microbial chang-es could be used as a non-invasive biomarker to screen patients for premalignant lesions.
What are the new findings?
► A prospective study of subjects undergoing screen-ing or surveillance colonoscopy was performed to determine if a unique microbiome pattern could be used to identify the presence of colorectal polyps. ► Advanced machine learning techniques were used
to build classifying predictors for the presence of polyps.
► The predictive power of classifiers was greatest when informative operational taxonomic units that were significantly different in subjects with and without polyps were used in the model.
► A naïve holdout analysis performed on home collect-ed stool samples had an average false positive rate of 12% and an average false negative rate of 11.5% using Naïve Bayes and Neural Network models. ► The false negative rate was reduced to 5% when
data from the Naïve Bayes and Neural Network models were combined in a composite analysis.
How might it impact on clinical practice in the foreseeable future?
► Gut microbiome analysis combined with advanced machine learning methods could be used as a non-invasive biomarker to screen patients for pol-yps, enhance colonoscopy compliance and increase equitable access to CRC screening efforts. ► Larger studies in populations that are more
eth-nically diverse and with broader socioeconomic status need to be performed to improve model per-formance and clinical utility.
AbSTrACT
Objective To characterise the gut microbiome in subjects with and without polyps and evaluate the potential of the microbiome as a non-invasive biomarker to screen for risk of colorectal cancer (CRC).
Design Presurgery rectal swab, home collected stool, and sigmoid biopsy samples were obtained from 231 subjects undergoing screening or surveillance colonoscopy. 16S rRNA analysis was performed on 552 samples (231 rectal swab, 183 stool, 138 biopsy) and operational taxonomic units (OTU) were identified using UPARSE. Non-parametric statistical methods were used to identify OTUs that were significantly different between subjects with and without polyps. These informative OTUs were then used to build classifiers to predict the presence of polyps using advanced machine learning models.
results We obtained clinical data on 218 subjects (87 females, 131 males) of which 193 were White, 21 African-American, and 4 Asian-American. Colonoscopy detected polyps in 56% of subjects. Modelling of the non-invasive home stool samples resulted in a classification accuracy >75% for Naïve Bayes and Neural Network models using informative OTUs. A naïve holdout analysis performed on home stool samples resulted in an average false negative rate of 11.5% for the Naïve Bayes and Neural Network models, which was reduced to 5% when the two models were combined.
Conclusion Gut microbiome analysis combined with advanced machine learning represents a promising approach to screen patients for the presence of polyps, with the potential to optimise the use of colonoscopy, reduce morbidity and mortality associated with CRC, and reduce associated healthcare costs.
IntroductIon
Colorectal cancer (CRC) is the third most common cancer and fourth most common cause of cancer death in the world.1 Though a genetic component is clear, the pathogen-esis of CRC is complex, involving a sequential transition of the normal mucosa to prema-lignant polyps, and eventually to CRC.2 This ‘adenoma-carcinoma sequence’ is dependent on an interplay of factors such as diet, immune system dysfunction, chronic inflammation, and dysbiosis of the gut microbiome.3 4
It is well accepted that increased participa-tion in screening programmes can prevent disease by the timely removal of polyps, and
copyright.
on May 29, 2020 by guest. Protected by
reduce CRC mortality with earlier diagnosis,5 yet recent data indicate that only 63% of eligible US residents are current with CRC screening recommendations, with rates further reduced in deprived populations such as the uninsured, ethnic minorities, and lower socioeconomic status.6–8
The gut microbiota has been identified as a potential screening method for CRC,9 10 and many studies have reported dysbiosis as a factor in the aetiology of adenoma and CRC11–27 (online supplementary table S1), though to date no definitive bacterial species profile has been identified as a universal biomarker.
Currently, the 16S rRNA gene is used as a standard to determine phylogenetic relationships for bacteria and to detect and quantify specific bacterial populations.28 The most challenging and time-consuming step in microbiome analysis is the bioinformatics analyses that define the operational taxonomic units (OTU) and their relative abundance from large numbers of NextGen sequence reads.29 Non-parametric statistical approaches have been applied to identify associations between OTUs and clinical metadata, and machine learning clas-sification techniques have been used in taxonomic and functional studies of microbiome data to improve the classifiers’ predictive power.29 We propose that prese-lection of informative OTUs combined with advanced machine learning methods could be used as a biomarker to identify at-risk patients with polyps, thereby enhancing colonoscopy compliance and offering a potential preven-tative, non-invasive, affordable screening tool. Here, we present the results of a prospective study with subjects undergoing screening or surveillance colonoscopy to determine if a unique microbiome pattern could be used to identify individuals with colorectal polyps via applica-tion of several machine learning techniques.
Methods study overview
In this study we defined ‘polyp’ broadly to include non-ne-oplastic polyps, benign adenomas, advanced adenomas (greater than 10 mm or villus features), and high-risk adenomas (subjects with three or more adenomas).
The polyp and healthy control data sets were collected for a clinical trial sponsored and funded by Metabio-mics (Biosciences Park Center, Aurora, CO, USA). The study was conducted at the Metropolitan Gastroenter-ology Group/Chevy Chase Clinical Research (Chevy Chase, MD, USA) and the Microbiome Analysis Center at George Mason University (Manassas, VA, USA) between January 2014 and June 2015 under an Institutional Review Board-approved (Chesapeake IRB, Columbia, MD, USA) protocol, . All subjects provided written, informed consent.
study population
Samples were collected from male and female subjects aged 45–80 years. Patients undergoing polyp surveillance
or screening colonoscopy must have been American Society of Anesthesiologists class 1–3 (healthy or mild to severe systemic disease). Subjects were excluded if they had a history of inflammatory bowel disease, were unable to schedule the colonoscopy within 60 days of the initial stool sample, or had colonic pathology that could inter-fere with the accuracy of the colonoscopy (eg, colonic stricture, poor preparation, and obstructing tumour).
sample collection and sequencing
Rectal swab and home stool samples were collected from subjects prior to routine bowel preparation and colo-noscopy for polyp detection using Metabiomics Home Microbiome Sampling Kit (Metabiomics). These kits used Puritan Flock Swabs and prefilled collection tubes with RNALater as a preservative. Rectal swab samples were collected at the time of the initial screening visit and subjects were provided with the kits and instructions for home stool sampling. Biopsies were collected from subjects during colonoscopy and stored in RNALater. Samples were kept at −20°C in RNALater until extraction using FastDNA Spin Kit for Soil (MP Biomedicals, Solon, CA, USA). Sequencing was performed using tagged V1– V2 bacterial 16S rRNA primers (F21F-R355R) on the Ion Torrent Personal Genome Machine (Thermo Fisher Scientific, Waltham, MA, USA) located at the Micro-biome Analysis Center, George Mason University.
Preprocessing and otu selection
Based on colonoscopy results, subjects were categorised into two groups: polyp negative (polyp-N) and polyp positive (polyp-Y). Preprocessing, OTU clustering, and construction of an OTU abundance table were performed using UPARSE.30 Further detail about the preprocessing step is available in the online supplementary methods.
Alpha and beta diversity
Alpha and beta diversity was analysed using mothur.31 After generating abundance tables, alpha (within subject) diversity measurements of richness and evenness and the identification of the presence or absence of specific taxa were performed. Rarefaction curves were drawn to analyse the sequencing depth. Samples with fewer than 5000 reads were removed. Alpha diversity indices such as Shannon, Simpson, invsimpson, and observed species (sobs) were calculated for all of the samples and compared between the polyp-Y and polyp-N groups using the Kruskal-Wallis test. The community diversity was compared between polyp-Y and polyp-N groups using permutational multivariate analysis of variance (PERMANOVA) and analysis of similarities (ANOSIM). Further detail about the beta diversity analysis (ie, unique fraction and principal coordinates analysis) is available in the online supplementary methods.
otu ranking, classification, classifier validation, and predictions
Statistical tests such as Kruskal-Wallis, MetaStats,32 linear discriminant analysis (LDA) effect size (LEfSe),33 and
copyright.
on May 29, 2020 by guest. Protected by
indicator34 35 were used to identify informative OTUs or features that were significantly different between polyp-Y and polyp-N groups.
Several machine learning classification models were built (Naïve Bayes, decision tree, logistic regression, random forest, K-nearest neighbour, Neural Network, and support vector machine) using the Orange data mining tool, V.2.7 (http:// orange. biolab. si/).36 Classi-fication was performed separately for the biopsy, stool, and rectal swab data sets. Using the fivefold cross-valida-tion method, 80% of samples were chosen as the training set, and the rest were used as the test set. Classification was performed under two different conditions: (1) with all detected OTUs as classification features, and (2) with informative OTUs that were detected by the statistical methods described above. This cross-validation method was used to evaluate each of the classifiers and their clas-sification accuracy, sensitivity, specificity, and area under the curve.
Naïve test data sets were generated using a Waikato Environment for Knowledge Analysis (Weka V.3.8.0)37 module to assess the predictive power of the best performing classifiers for risk assessment. The generated classifiers were validated using the 10-fold cross-valida-tion method and used to predict classes for the naïve test set. The classification accuracy was then averaged over all of the naïve test sets.
results
Participant characteristics and sample collection
From a cohort of 231 subjects in the Washington, DC, metro area undergoing screening or surveillance colo-noscopy, we collected samples and clinical data from 218 subjects (male, n=131; female, n=87). The average age was 62 years and average body mass index (BMI) was 27 kg/m2. Most subjects were White (n=193; 88%), 21 were African-American (10%), and 4 were Asian-American (2%). Over half of the subjects (n=124) had a history of polyps. Across all subjects, 552 samples were collected. Not all subjects submitted all types of specimens, which resulted in the collection of 138 biopsy, 183 home stool, and 231 rectal swab samples that were subsequently analysed. There was 79% compliance with submission of home stool samples after the initial rectal swab samples were collected.
Incidence of polyp pathology
Colonoscopy detected polyps in 56% of the subjects. All subjects presented with benign polyps. Adenomas, advanced adenomas, and high-risk adenomas were observed, respectively, in 50%, 2%, and 21% of the polyp-positive subjects. This incidence of high-risk adenomas (n=27, 11.8%) in the study was higher than would be expected in the general population, possibly because more than half of the study cohort (n=124) had a history of polyps and were undergoing surveillance colonoscopy.
Preprocessing and clustering
The number of original reads collected for the 552 samples (polyp-Y=316, polyp-N=236) was 12 646 278 and the number of reads after preprocessing used for OTU clustering was 4 377 359. The total number of OTUs detected by UPARSE was 2631.
Rarefaction plots indicated that sequencing depth was acceptable for the large majority of samples, and the reads should have adequately identified the number of species in the samples, online supplementary figure S1. In total, 13 biopsy, 15 home stool, and 20 presurgery rectal swab samples were omitted at this step, as samples with <5000 reads were removed.
Alpha and beta diversity
Simpson, invsimpson, and sobs indices were significantly different among the polyp-Y and polyp-N groups in all three data sets (p<0.001). Shannon diversity had a signifi-cant change in median rank of samples’ diversity between the groups only in the biopsy data set (p=0.039), online supplementary figure S2. Comparison of alpha diversity and change of taxa abundance at the phylum and genera levels are shown in online supplementary tables S2 and S3.
PERMANOVA analysis indicated that there was a signif-icant difference for the weighted UniFrac distances between the polyp-Y and polyp-N groups in the biopsy data set (p=0.03). However, unweighted UniFrac was not statistically distinctive between groups in this data set. Moreover, there was no statistical difference in the Bray-Curtis distances plus weighted and unweighted UniFrac measurements for home stool and rectal swab samples based on PERMANOVA (p>0.05), online supplementary figures S3, and S4.
Informative otus
We identified the informative OTUs that differed between the polyp-Y and polyp-N groups by performing statistical tests with 1000 permutations using MetaStats, Kruskal-Wallis, LEfSe, and indicator species analyses and used these informative features for classification.
MetaStats32 is a statistical approach designed to iden-tify differentially abundant features in metagenomic and 16S rRNA sequence data sets. This programme uses the non-parametric t-test, Fisher’s exact test, and the false discovery rate to provide users with a prioritised list of remarkable features that define differences between two classes.
The Kruskal-Wallis test uses a rank-ordered one-way analysis of variance and is a method for testing whether samples originate from the same distribution. It is used for comparing two or more independent samples of equal or different sample sizes. It extends to the Mann-Whitney U test when there are more than two groups. A significant Kruskal-Wallis test indicates that at least one sample stochastically dominates over at least one other sample.
copyright.
on May 29, 2020 by guest. Protected by
Figure 1 Receiver operating characteristic (ROC) curves for five classifiers using informative operational taxonomic units (OTU) for biopsy, home stool, and rectal swab data sets. The evaluated classifiers included Naïve Bayes (red), random forest (orange), K-nearest neighbour (yellow), logistic regression (green), and Neural Network (blue). The straight line represents the null model. (A) For the biopsy data set, the best performing classifier was Naïve Bayes with area under the curve (AUC) equal to 0.85. (B) For the home stool data set, the best performing classifiers were Naïve Bayes and random forest with AUC=0.83. (C) For the rectal swab data set, the best performing classifiers were random forest with AUC=0.81 and Naïve Bayes with AUC=0.80.
The LEfSe33 is an algorithm for high-dimensional biomarker discovery and detection of genomic features such as genes, pathways, and taxa that can characterise the differences between two or more biological classes. This algorithm is helpful to identify differentially abun-dant features that are also consistent with biologically meaningful categories (classes) by taking into account both statistical significance and biological relevance. It first detects statistically different features using the non-parametric Kruskal-Wallis sum-rank test and then uses another pairwise test (Wilcoxon) to determine whether the detected differences are consistent with biological behaviour. LDA is used to estimate the biolog-ical effect of each differentially abundant feature.
The indicator metric is another statistically based tool developed to find the indicator species (eg, OTUs) that define a distinctive aspect or characteristic of an environ-ment. Indicator combines the species relative abundance with the relative frequency of occurrence in various classes. When all the individuals of a species are repre-sented in one group, and all the species appear in all the samples of that group, the indicator index is defined as high. A randomisation method is used to find the statis-tical significance of the metric. The indicator index for each species is independent of the other species rela-tive abundance and is independent of classification approaches.34 35
These four approaches identified 109, 59, and 92 infor-mative OTUs for biopsy, home stool, and rectal swab samples, respectively, from the original 2631 OTUs.
Online supplementary tables S4, S5 and S6 show the differentially detected OTUs for each of the three data sets. The informative OTUs at each taxonomic level were used as classification features to improve the classifiers’ performance. Bar plots of the normalised abundance of
the informative OTUs are presented in online supple-mentary figures S5, S6 and S7 for biopsy, home stool, and rectal swab samples, respectively. It can be seen that some taxa are enriched while others are depleted in the polyp-Y group compared with the polyp-N group.
Some OTUs show the same pattern of change in all three sample types. For example, Bacteroides is enriched in the polyp-Y group in the biopsy, stool, and rectal swab samples; however, other OTUs show different patterns in the different sample types. For instance, Blautia shows enrichment in the polyp-Y group in stool and rectal swab samples and depletion in the polyp-Y biopsies, while
Faecalibacterium was increased in the polyp-Y rectal swab and decreased in the polyp-Y stool samples.
classification using all otus and informative otus
As shown in online supplementary table S7, in all spec-imen types (biopsy, stool, and rectal swab samples), the classification accuracy, sensitivity, specificity, and area under the receiver operating characteristic (ROC) curve improved by using informative OTUs for classification instead of all OTUs. For example, the Naïve Bayes classi-fication accuracy for all OTUs for the home stool samples was 0.40 but increased to 0.75 when informative OTUs were used. Similarly, the Neural Network classification accuracy for all OTUs for the home stool samples was 0.50 but increased to 0.77 when informative OTUs were used. The ROC curves for biopsy, home stool, and rectal swab data sets are shown in figure 1. The home stool samples were chosen for the naïve predictions below.
The Naïve Bayes and Neural Network models appeared to be the best performing classifiers. Specifically, the clas-sification accuracy of the Naïve Bayes model on the infor-mative OTUs was 0.77, 0.75, and 0.72 for biopsy, home stool, and rectal swab samples, respectively. Similarly, the
copyright.
on May 29, 2020 by guest. Protected by
Table 1 Classification accuracy of the Naïve Bayes and Neural Network models for the home collected stool samples using naïve test sets
Model Classification accuracy Sensitivity(true positive rate) Specificity(true negative rate) AUC
Naive Bayes 79% 83% 72% 86%
Neural Network 82% 86% 75% 87%
[image:5.595.41.554.516.648.2]AUC, area under the curve;
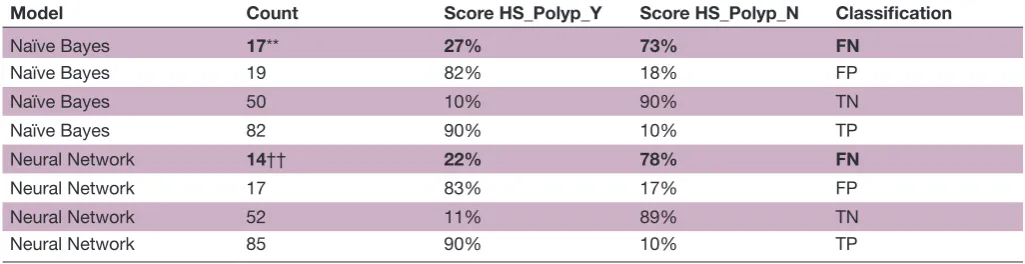
Table 2 Confusion matrix for the Naïve Bayes and Neural Network models for the home collected stool samples using naïve test sets
Model Count Score HS_Polyp_Y Score HS_Polyp_N Classification
Naïve Bayes 17** 27% 73% FN
Naïve Bayes 19 82% 18% FP
Naïve Bayes 50 10% 90% TN
Naïve Bayes 82 90% 10% TP
Neural Network 14†† 22% 78% FN
Neural Network 17 83% 17% FP
Neural Network 52 11% 89% TN
Neural Network 85 90% 10% TP
*False negatives using Naive Bayes model †False negatives using Neural Network model
AUC, area under the curve; FN, false negative; FP, false positive;HS, home collected stool sample;HS_Polyp_N, Home Stool from subjects without polyps; HS_Polyp_Y, Home Stool from subjects with Polyps; Polyp_N, polyp-negative group; Polyp_Y, polyp-positive group; TN, true negative; TP, true positive.
classification accuracy of the Neural Network model on the informative OTUs was 0.74, 0.77, and 0.67 for biopsy, home stool, and rectal swab samples, respectively. As such, these models were selected for the naïve predic-tions of the home stool samples.
naïve prediction using informative features
Using the prediction pipeline that we developed using the Orange data mining tool, the predictive powers of the best performing classifiers (Naïve Bayes and Neural Network) were evaluated. For each of the sample types (biopsy, stool, and rectal swab), 90% of samples were used for training and 10% were used as the holdout test data set. From a total of 125 biopsy samples, 8 of 13 test samples (61.5%) were predicted correctly as shown in online supplementary table S8. From the total of 168 stool samples, 12 of 17 test samples (82.3%) were predicted correctly as shown in online supplementary table S9. From the total of 211 rectal swab samples, 18 of 22 test samples (81.8%) were predicted correctly as shown in online supplementary table S10.
risk assessment of home collected stool samples using informative features
The classification results for the home stool samples were analysed in greater detail. Naïve test data sets were
generated using Weka. The Naïve Bayes and Neural Network classifiers were used to build models that were then used to predict classes for the naïve test set. This was repeated 10 times and the classification accuracy was then averaged over all of the naïve test sets. Table 1 shows the accuracy of the average classification of the stool samples using the naïve test sets. The Naïve Bayes and Neural Network classifiers have 79% and 82% clas-sification accuracy, respectively, with an average false positive rate of 12% and an average false negative rate of 11.5%. However, all samples did not have the same result for each classifier, as shown in table 2, where there are different numbers of false positives and false negatives for each classification model. The more important issue in risk assessment is the false negative rate, as this risk assessment would result in a non-recommendation for colonoscopy for an at-risk individual.
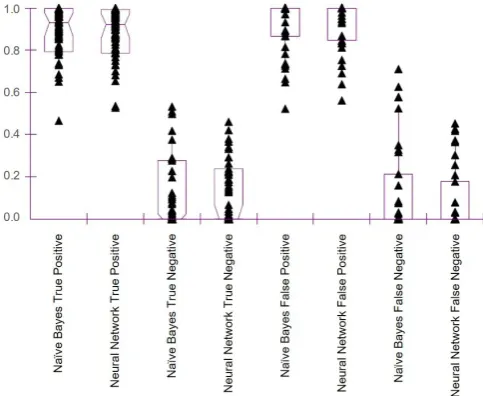
Figure 2 is a box plot of the classification scores for the naïve predictions of the home stool samples. Clas-sification score distributions for the Naïve Bayes true positives and the Neural Network true positives are very similar. Likewise, classification score distributions for the true negatives are comparable for the Naïve Bayes and Neural Network classifiers. However, there are differ-ences between the classification score distributions of the
copyright.
on May 29, 2020 by guest. Protected by
Figure 2 Naïve Bayes and Neural Network classification scores for the naïve predictions of the home stool samples.
false positives and false negatives compared with the true positives and true negatives. Thus, one cannot use the p values of either classifier alone to clarify the confusion matrix.
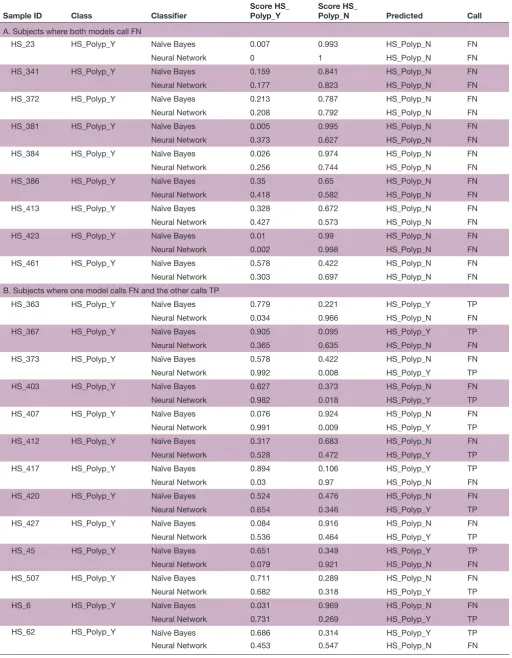
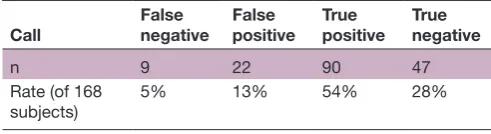
A total of 22 subjects were classified as false negative by either model; however, only nine subjects (5%) were classified as false negative by both models (tables 3 and 4), suggesting improved predictive accuracy of using a composite score from both models.
dIscussIon
We sought to characterise the gut microbiome in a prospective cohort of subjects with and without colorectal polyps using home collected stool, presurgery rectal swab, and biopsy samples, and use statistical methods and advanced machine learning to build classifying predic-tors for the presence of polyps.
Although bacterial dysbiosis has been reported in virtually all CRC/adenoma microbiome studies as well as in our research, the microbial features that have been found to differ significantly are not the same, and are in some cases contradictory. We expected that the compar-ison of OTUs (ie, taxa) reported in previously published studies and those identified in our own work would have many common species and would change in abundance along with the appearance of polyps. Indeed, some bacte-rial taxa identified by our study were previously reported to be associated with adenoma/CRC. These include the Firmicutes, Bacteroidetes, and Proteobacteria phyla,
Bacteroides, Roseburia, Bifidobacterium, Faecalibacterium, and
Blautia genera, as well as Bacteroides fragilis and Faecalibacte-rium prausnitzii species. However, the direction of change was not collinear in all the studies. One possible explana-tion is the difference in species and strain composiexplana-tion between study populations and partial overlap between the biochemical functions of particular microbes. Another possible explanation is the presence of certain
clinical confounders (eg, differences in BMI, age, and medications), differences in ethnic backgrounds and dietary habits, or differences in sequencing methods employed, 16S variable region analysed, and analytical pipelines used which may influence the study outputs.
When individuals with polyps in our study were compared with those with normal colonoscopy results, their microbial profiles were different in all three types of the specimens. Even for the same individual, the microbial profiles of their biopsy, stool, and rectal swab samples differed. These observations are consistent with previous studies.14 21 A summary of alpha diversity results from this study and 17 other CRC and adenoma studies along with those phyla significantly changed are summarised in online supplementary table S11. Six of these 17 studies reported higher alpha diversity in adenoma or cancer groups, four studies observed lower diversity in the adenoma or cancer group, and three studies indicated no significant change in the diversity of the cancer or adenoma group compared with healthy control subjects.12 14 16 18 21 27 38 39
At the phylum level, the most commonly reported significant differences of microbial abundancies among healthy control, adenoma, and CRC samples are for Firmicutes, Bacteroidetes, and Proteobacteria. Some studies have shown increased abundance of Firmicutes in adenoma/CRC samples while other studies reported relative depletion of this phylum.11 15 16 27 38–41 Similarly, a number of reports described an increase in abun-dance of Bacteroidetes in patients with adenoma/CRC while others reported a decrease in abundance of this phylum.11 12 15 16 18 21 38–41 In our polyp data set, Firmicutes and Bacteroidetes phyla were significantly more abun-dant in the polyp-Y samples compared with the polyp-N group.
Among the 17 studies of adenoma/CRC listed in online supplementary table S11, eight data sets contained infor-mation on Proteobacteria. In five out of six adenoma studies which reported Proteobacteria abundance, this phylum was represented at higher levels in the adenoma state.12 16 24 39 40 Among six CRC studies two detected higher Proteobacteria abundance with CRC, and two data sets reported lower abundance with CRC.23–26 In one study that analysed three types of samples—tumour, swab, and stool—an increase in Proteobacteria abundance in the stool of the CRC group and a decrease of this phylum in both the tumour and swab samples were reported.14 In our polyp data set, analysis of both rectal swab and stool samples revealed an increase in Proteobacteria abun-dance, but lower abundance of Proteobacteria in polyp biopsies compared with the normal colon biopsies.
At the genus level, the abundancies of Bifidobacterium,
Faecalibacterium, and Blautia were decreased in our polyp biopsies as compared with normal colon mucosa, while in the rectal swab and stool samples of the subjects with polyps, their abundancies (except for Faecalibacterium) were higher than that in subjects with healthy colons. Possibly, the polyp-associated gut microbiota shifts
copyright.
on May 29, 2020 by guest. Protected by
Table 3 Classification scores and predictions for the 22 subjects with polyps whose home stool samples were called false negative on Naïve Bayes and/or Neural Network models
Sample ID Class Classifier Score HS_Polyp_Y Score HS_Polyp_N Predicted Call
A. Subjects where both models call FN
HS_23 HS_Polyp_Y Naïve Bayes 0.007 0.993 HS_Polyp_N FN
Neural Network 0 1 HS_Polyp_N FN
HS_341 HS_Polyp_Y Naïve Bayes 0.159 0.841 HS_Polyp_N FN
Neural Network 0.177 0.823 HS_Polyp_N FN
HS_372 HS_Polyp_Y Naïve Bayes 0.213 0.787 HS_Polyp_N FN
Neural Network 0.208 0.792 HS_Polyp_N FN
HS_381 HS_Polyp_Y Naïve Bayes 0.005 0.995 HS_Polyp_N FN
Neural Network 0.373 0.627 HS_Polyp_N FN
HS_384 HS_Polyp_Y Naïve Bayes 0.026 0.974 HS_Polyp_N FN
Neural Network 0.256 0.744 HS_Polyp_N FN
HS_386 HS_Polyp_Y Naïve Bayes 0.35 0.65 HS_Polyp_N FN
Neural Network 0.418 0.582 HS_Polyp_N FN
HS_413 HS_Polyp_Y Naïve Bayes 0.328 0.672 HS_Polyp_N FN
Neural Network 0.427 0.573 HS_Polyp_N FN
HS_423 HS_Polyp_Y Naïve Bayes 0.01 0.99 HS_Polyp_N FN
Neural Network 0.002 0.998 HS_Polyp_N FN
HS_461 HS_Polyp_Y Naïve Bayes 0.578 0.422 HS_Polyp_N FN
Neural Network 0.303 0.697 HS_Polyp_N FN
B. Subjects where one model calls FN and the other calls TP
HS_363 HS_Polyp_Y Naïve Bayes 0.779 0.221 HS_Polyp_Y TP
Neural Network 0.034 0.966 HS_Polyp_N FN
HS_367 HS_Polyp_Y Naïve Bayes 0.905 0.095 HS_Polyp_Y TP
Neural Network 0.365 0.635 HS_Polyp_N FN
HS_373 HS_Polyp_Y Naïve Bayes 0.578 0.422 HS_Polyp_N FN
Neural Network 0.992 0.008 HS_Polyp_Y TP
HS_403 HS_Polyp_Y Naïve Bayes 0.627 0.373 HS_Polyp_N FN
Neural Network 0.982 0.018 HS_Polyp_Y TP
HS_407 HS_Polyp_Y Naïve Bayes 0.076 0.924 HS_Polyp_N FN
Neural Network 0.991 0.009 HS_Polyp_Y TP
HS_412 HS_Polyp_Y Naïve Bayes 0.317 0.683 HS_Polyp_N FN
Neural Network 0.528 0.472 HS_Polyp_Y TP
HS_417 HS_Polyp_Y Naïve Bayes 0.894 0.106 HS_Polyp_Y TP
Neural Network 0.03 0.97 HS_Polyp_N FN
HS_420 HS_Polyp_Y Naïve Bayes 0.524 0.476 HS_Polyp_N FN
Neural Network 0.654 0.346 HS_Polyp_Y TP
HS_427 HS_Polyp_Y Naïve Bayes 0.084 0.916 HS_Polyp_N FN
Neural Network 0.536 0.464 HS_Polyp_Y TP
HS_45 HS_Polyp_Y Naïve Bayes 0.651 0.349 HS_Polyp_Y TP
Neural Network 0.079 0.921 HS_Polyp_N FN
HS_507 HS_Polyp_Y Naïve Bayes 0.711 0.289 HS_Polyp_N FN
Neural Network 0.682 0.318 HS_Polyp_Y TP
HS_6 HS_Polyp_Y Naïve Bayes 0.031 0.969 HS_Polyp_N FN
Neural Network 0.731 0.269 HS_Polyp_Y TP
HS_62 HS_Polyp_Y Naïve Bayes 0.686 0.314 HS_Polyp_Y TP
Neural Network 0.453 0.547 HS_Polyp_N FN
Continued
copyright.
on May 29, 2020 by guest. Protected by
Sample ID Class Classifier
Score HS_ Polyp_Y
Score HS_
Polyp_N Predicted Call
Classification scores are presented for each model and subject where the true class (ie, Polyp-Y or Polyp-N) is tabulated along with the model scores and predictions.
FN, false negative;HS, home collected stool sample; Polyp_N, polyp-negative group; Polyp_Y, polyp-positive group; TP, true positive.
[image:8.595.41.287.662.729.2]Table 3 Continued
Table 4 Summary for the adjusted composite confusion matrix for home stool samples
Call False negative False positive True positive True negative
n 9 22 90 47
Rate (of 168
subjects) 5% 13% 54% 28%
Subjects that had mixed false negative and true positive calls by the two models were binned as true positive.
relative abundancies towards more harmful bacteria, while beneficial bacteria are displaced into the lumen and gradually shed with the stool.
At the species level, the pathogens Fusobacterium nucleatum and B. fragilis did not show enrichment in subjects with polyps in our study, as has been reported in other CRC data sets. As the origin and aetiology of CRC may be different based on the tumour location,42 43 it is possible that F. nucleatum and B. fragilis contribute to the development of polyps or malignant transformations of adenomatous polyps in some locations, but not others. Another confounding factor is that many of the subjects in our study were so-called ‘polyp producers’ who were monitored more frequently for removal of new polyps. Due to the possible genetic component, the aetiology of polyps in this group probably differed from that in the general population.
Supervised machine learning methods are useful for finding patterns in highly complex data sets like human microbiota surveys.44 Moreover, we introduced informative feature selection as an additional step for classification to find a combination of feature subsets that would lead to better classifiers.45 To decrease the complexity of the analysis in our study, we used inde-pendent non-parametric statistical tools to find signif-icant differences between the polyp-Y and polyp-N groups to select OTUs that are associated with a shift from normal state to disease state.
Thus, we undertook a comparison of eight classifica-tion methods, four feature selecclassifica-tion approaches, and four accuracy metrics. We focused on supervised classifi-cation methods, as unsupervised methods like clustering are not suitable for predictions and assigning naïve data to a specific class.46 47 We first performed classification with the complete relative abundance OTU table using all OTUs and then with relative abundance tables of just the informative OTUs. For all three data sets of biopsy, stool, and rectal swab samples, the accuracy of classifica-tion, sensitivity, and specificity of classification as well as
the area under the ROC curve were improved by using the informative features, demonstrating that most OTUs were not informative and removing them improved the model performance. As an added benefit, analysis of a reduced data set requires less computational power.
Widespread screening for CRC results in earlier diag-nosis (when the disease is more easily treated) and primary prevention,6 yet remains underused. An afford-able, non-invasive or minimally invasive tool for risk assessment for the presence of polyps would have the potential to increase acceptability of colonoscopy by individuals categorised as high risk for CRC,48 that in turn could have a salient effect on CRC morbidity and mortality. Such a tool would have the additional benefit of reducing healthcare costs by avoiding screening colo-noscopies in individuals without polyps.
In our study, advanced machine learning with Naïve Bayes and Neural Network classifiers resulted, respec-tively, in 79% and 82% classification accuracy of stool samples from subjects with and without polyps, although false positive and false negative classifications averaged 12% and 11.5%. False positive classifications are less problematic than false negative classifications; however, the number of subjects classified as false negative by both models was reduced to 5%, and it is likely that both sensitivity and specificity of the model-ling could be improved by increasing cohort size. By comparison, existing in vitro diagnostics that have been recommended by the US Preventive Services Task Force for CRC screening have minimal or no reported sensitivity to colon polyps.49 50
In summary, this study focused on the comparative investigation of the statistical analysis and machine learning methods applicable to colorectal microbiome studies. The informative features were selected a priori using Kruskal-Wallis, MetaStats, LEfSe, and indicator species in Mothur. This selection was independent from the machine learning classification. We expect that specific taxa will be identified in larger cohorts using this approach.
The key thrust of this study was to circumvent the overfitting inherent in machine learning methods by the independent selection of informative features using non-parametric techniques. Furthermore, the fact that this approach yielded higher classification accuracy on naïve data sets suggests that these informative features are robust and likely associated with disease progres-sion. We currently are applying this approach in a meta-analysis of published data to verify the utility of the method.
copyright.
on May 29, 2020 by guest. Protected by
By optimising the analytical pipeline, we were able to improve extraction of informative OTUs, thereby also improving the predictive power of resultant classifier models in identifying the presence of polyps in the human colon. It is possible that the best classifying features are also important in the aetiology of CRC. However, before microbiome-based classifiers could be introduced to clinical practice, additional biomarkers with predictive value will need to be identified and further validation in independent and much larger, ethnically diverse cohorts should be performed.
Acknowledgements Copyediting and editorial assistance was provided by
Prescott Medical Communications Group (Chicago, IL, USA) and was funded by Prescient Metabiomics JV.
Contributors LK, RH, JB, DH, GK, TK, and PMG planned the study. LK, RH, and
JB conducted the clinical study. MS and PMG collected the data. ED and PMG interpreted the data and drafted the manuscript. ED and PMG critically revised the manuscript for intellectual content. ED, MS, LK, RH, JB, DH, GK, TK, and PMG approved the final draft submitted.
Funding Research reported in this publication was supported in part by
Metabiomics.
Competing interests GK, TK, and PMG have founders’ stock and LK, RH, and JB
have stock options in Metabiomics.
Patient consent for publication Not required.
Ethics approval The studies described in this manuscript were approved by
Chesapeake IRB (Columbia, MD, USA), protocol Metabiomics MB-01, Metabiomics Neoplasia Clinical Research Study (Pro00008950).
Provenance and peer review Not commissioned; externally peer reviewed.
Data availability statement The data sets analysed during the current study
are available from the corresponding author on reasonable request and will be submitted to the Sequence Read Archive.
Author note The data for this manuscript has been deposited in Genbank. The
accession number to the manuscript is PRJNA534511.
Open access This is an open access article distributed in accordance with the
Creative Commons Attribution Non Commercial (CC BY-NC 4.0) license, which permits others to distribute, remix, adapt, build upon this work non-commercially, and license their derivative works on different terms, provided the original work is properly cited, appropriate credit is given, any changes made indicated, and the use is non-commercial. See: http:// creativecommons. org/ licenses/ by- nc/ 4. 0/.
rEFErEnCES
1. Ferlay J, Soerjomataram I, Dikshit R, et al. Cancer incidence and mortality worldwide: sources, methods and major patterns in GLOBOCAN 2012. Int J Cancer 2015;136:E359–E386.
2. Vogelstein B, Papadopoulos N, Velculescu VE, et al. Cancer genome landscapes. Science 2013;339:1546–58.
3. Fearon ER. Molecular genetics of colorectal cancer. Annu Rev Pathol Mech Dis 2011;6:479–507.
4. Ding C, Tang W, Fan X, et al. Intestinal microbiota: a novel perspective in colorectal cancer biotherapeutics. Onco Targets Ther 2018;11:4797–810.
5. Narayanan V, Peppelenbosch MP, Konstantinov SR. Human fecal microbiome-based biomarkers for colorectal cancer. Cancer Prev Res (Phila) 2014;7:1108–11.
6. Essink-Bot ML, Dekker E, Timmermans DRM, et al. Knowledge and informed decision-making about population-based colorectal cancer screening participation in groups with low and adequate health literacy. Gastroenterol Res Pract 2016;2016:1–8.
7. Levin TR, Corley DA, Jensen CD, et al. Effects of organized colorectal cancer screening on cancer incidence and mortality in a large community-based population. Gastroenterology 2018;155:1383–91.
8. American Cancer Society. Colorectal Cancer: Facts & Figures. 2017-2019. Available: https://www. cancer. org/ content/ dam/ cancer- org/ research/ cancer- facts- and- statistics/ colorectal- cancer- facts-
and- figures/ colorectal- cancer- facts- and- figures- 2017- 2019. pdf [Accessed 20 Jan 2019].
9. Zackular JP, Rogers MAM, Ruffin MT, et al. The human gut microbiome as a screening tool for colorectal cancer. Cancer Prev Res 2014;7:1112–21.
10. Eklöf V, Löfgren-Burström A, Zingmark C, et al. Cancer-associated fecal microbial markers in colorectal cancer detection. Int. J. Cancer 2017;141:2528–36.
11. Marchesi JR, Dutilh BE, Hall N, et al. Towards the human colorectal cancer microbiome. PLoS ONE 2011;6:e20447.
12. Shen XJ, Rawls JF, Randall TA, et al. Molecular characterization of mucosal adherent bacteria and associations with colorectal adenomas. Gut Microbes 2010;1:138–47.
13. Castellarin M, Warren RL, Freeman JD, et al. Fusobacterium nucleatum infection is prevalent in human colorectal carcinoma. Genome Res 2012;22:299–306.
14. Chen W, Liu F, Ling Z, et al. Human intestinal lumen and mucosa-associated microbiota in patients with colorectal cancer. PLoS ONE 2012;7:e39743.
15. Kostic AD, Gevers D, Pedamallu CS, et al. Genomic analysis identifies association of Fusobacterium with colorectal carcinoma. Genome Res 2012;22:292–8.
16. Sanapareddy N, Legge RM, Jovov B, et al. Increased rectal microbial richness is associated with the presence of colorectal adenomas in humans. Isme J 2012;6:1858–68.
17. Geng J, Fan H, Tang X, et al. Diversified pattern of the human colorectal cancer microbiome. Gut Pathog 2013;5.
18. McCoy AN, Araújo-Pérez F, Azcárate-Peril A, et al. Fusobacterium is associated with colorectal adenomas. PLoS ONE
2013;8:e53653.
19. Zeller G, Tap J, Voigt AY, et al. Potential of fecal microbiota for early-stage detection of colorectal cancer. Mol Syst Biol 2014;10. 20. Burns MB, Lynch J, Starr TK, et al. Virulence genes are a signature
of the microbiome in the colorectal tumor microenvironment. Genome Med 2015;7.
21. Mira-Pascual L, Cabrera-Rubio R, Ocon S, et al. Microbial mucosal colonic shifts associated with the development of colorectal cancer reveal the presence of different bacterial and archaeal biomarkers. J Gastroenterol 2015;50:167–79.
22. Nakatsu G, Li X, Zhou H, et al. Gut mucosal microbiome across stages of colorectal carcinogenesis. Nat Commun 2015;6. 23. Thomas AM, Jesus EC, Lopes A, et al. Tissue-associated bacterial
alterations in rectal carcinoma patients revealed by 16S rRNA community profiling. Front Cell Infect Microbiol 2016;6. 24. Xu K, Jiang B. Analysis of mucosa-associated microbiota in
colorectal cancer. Med Sci Monit 2017;23:4422–30.
25. Gao R, Kong C, Huang L, et al. Mucosa-associated microbiota signature in colorectal cancer. Eur J Clin Microbiol Infect Dis 2017;36:2073–83.
26. Yoon H, Kim N, Park JH, et al. Comparisons of gut microbiota among healthy control, patients with conventional adenoma, sessile serrated adenoma, and colorectal cancer. J Cancer Prev 2017;22:108–14.
27. Hale VL, Chen J, Johnson S, et al. Shifts in the fecal microbiota associated with adenomatous polyps. Cancer Epidemiol Biomarkers Prev 2017;26:85–94.
28. Acinas SG, Marcelino LA, Klepac-Ceraj V, et al. Divergence and redundancy of 16S rRNA sequences in genomes with multiple rrn operons. J Bacteriol 2004;186:2629–35.
29. Ju F, Zhang T. 16S rRNA gene high-throughput sequencing data mining of microbial diversity and interactions. Appl Microbiol Biotechnol 2015;99:4119–29.
30. Edgar RC. UPARSE: highly accurate otu sequences from microbial amplicon reads. Nat Methods 2013;10:996–8.
31. Schloss PD, Westcott SL, Ryabin T, et al. Introducing mothur: open-source, platform-independent, community-supported software for describing and comparing microbial communities. Appl Environ Microbiol 2009;75:7537–41.
32. White JR, Nagarajan N, Pop M. Statistical methods for detecting differentially abundant features in clinical metagenomic samples. PLoS Comput Biol 2009;5:e1000352.
33. Segata N, Izard J, Waldron L, et al. Metagenomic biomarker discovery and explanation. Genome Biol 2011;12.
34. Dufrêne M, Legendre P. Species assemblages and indicator species: the need for a flexible asymmetrical approach. Ecol Monogr 1997;67:345–66.
35. McCune B, Grace JB, Urban DL. Analysis of ecological communities. Gleneden Beach, OR: MjM Software Design, 2002.
36. Demšar J, Curk T, Erjavec A, et al. Orange: data mining Toolbox in python. J Mach Learn Res 2013;14:2349–53.
copyright.
on May 29, 2020 by guest. Protected by
37. Witten IH, Frank E, Hall MA. Data mining: practical machine learning tools and techniques. 3rd edn. Burlington, MA: Morgan Kaufmann Publishers, 2011.
38. Ahn J, Sinha R, Pei Z, et al. Human gut microbiome and risk for colorectal cancer. J Natl Cancer Inst 2013;105:1907–11.
39. Goedert JJ, Gong Y, Hua X, et al. Fecal microbiota characteristics of patients with colorectal adenoma detected by screening: a population-based study. EBioMedicine 2015;2:597–603. 40. Brim H, Yooseph S, Zoetendal EG, et al. Microbiome analysis of
stool samples from African Americans with colon polyps. PLoS ONE 2013;8:e81352.
41. Wu N, Yang X, Zhang R, et al. Dysbiosis signature of fecal microbiota in colorectal cancer patients. Microb Ecol 2013;66:462–70.
42. Lee GH, Malietzis G, Askari A, et al. Is right-sided colon cancer different to left-sided colorectal cancer? – a systematic review. Eur J Surg Oncol 2015;41:300–8.
43. Peters BA, Dominianni C, Shapiro JA, et al. The gut microbiota in conventional and serrated precursors of colorectal cancer. Microbiome 2016;4.
44. Wisittipanit N, Rangwala H, Sikaroodi M, et al. Classification methods for the analysis of LH-PCR data associated with
inflammatory bowel disease patients. Int J Bioinform Res Appl 2015;11:111–29.
45. Knights D, Costello EK, Knight R. Supervised classification of human microbiota. FEMS Microbiol Rev 2011;35:343–59.
46. Dupuy A, Simon RM. Critical review of published microarray studies for cancer outcome and guidelines on statistical analysis and reporting. J Natl Cancer Inst 2007;99:147–57.
47. Simon R, Radmacher MD, Dobbin K, et al. Pitfalls in the use of DNA microarray data for diagnostic and prognostic classification. J Natl Cancer Inst 2003;95:14–18.
48. Schroy PC, Caron SE, Sherman BJ, et al. Risk assessment and clinical decision making for colorectal cancer screening. Health Expect 2015;18:1327–38.
49. Bibbins-Domingo K, Grossman DC, Curry SJ, et al. Screening for colorectal cancer: US Preventive Services Task Force recommendation statement. JAMA 2016;315:2564–75. 50. Lin JS, Piper MA, Perdue LA, et al. U.S. Preventive Services
Task Force evidence syntheses, formerly systematic evidence reviews. Screening for colorectal cancer: a systematic review for the US Preventive Services Task Force. Rockville, MD: Agency for Healthcare Research and Quality (US), 2016.
copyright.
on May 29, 2020 by guest. Protected by