Summary
Embryology and genetics have given rise to a mechanistic framework that explains the architecture of a developing organism. Until recently, however, such studies suffered from a lack of quantification and real-time visualization at the subcellular level, limiting their ability to monitor the dynamics of developmental processes. Live imaging using fluorescent proteins has overcome these limitations, uncovering
unprecedented insights that call many established models into question. We review how the study of patterning, cell polarization and morphogenesis has benefited from this technology and discuss the possibilities offered by fluorescence imaging and by the contributions of quantitative disciplines.
Key words: GFP, Fluorescence imaging, Cell dynamics, Quantitative biology
Introduction
Development is a dynamic process during which the cellular responses to patterning signals progressively restrict cell fates to defined regions of the embryo. As cells acquire distinct fates, they also adopt specific behaviors that drive the growth and the shape changes of embryonic tissues. Many decades of study have established widely accepted frameworks for patterning and morphogenesis. In the past 15 years, however, new answers to old questions have arisen, and new questions have been asked, owing to technical advances in fluorescence microscopy. This technology capitalizes on the property of certain compounds to fluoresce. Among the most important of these advances are the capability for optical sectioning, which allows the observer to look deep inside tissues without interference from out-of-focus light and scatter, the development of highly sensitive detectors, which have led to unprecedented spatial and temporal resolution, and, as we discuss here, the engineering of fluorescent labels that can tag any protein of interest.
The purpose of this Review is to illustrate, through considering a set of representative examples, how the imaging of fluorescent proteins (FPs) and probes has changed the field of developmental biology. This technology has made it possible to visualize cellular and subcellular structures and to study their inherent dynamics in the three-dimensional (3D) environment of living embryos. Thus, it has fostered a cell-biological approach to the study of developmental processes and to the analysis of phenotypes. In addition, as FP intensity and turnover can be measured, its use promotes the quantitative analysis of developmental processes. Ultimately, FP
imaging has paved the way for synthesizing different scales of description and understanding into a single coherent mechanistic framework. Developmental biologists have benefited from the insights of mathematics, physics, engineering and computer science to build and test predictive models. Chemists brought FPs to the attention of biologists, and improved them. Today, more than ever before, fundamental cell-biological questions can be addressed in developing organisms, in which cells exist in their native environment. The fact that FPs have revolutionized the investigation of biological processes was recognized through the award of the Nobel Prize in Chemistry to Osamu Shimomura, Martin Chalfie and Roger Tsien in 2008, for the discovery and development of the most famous FP, green fluorescent protein (GFP).
It is impossible to cover all aspects of developmental biology that illustrate the contribution of fluorescence imaging. We restrict this Review to representative cases that highlight particular conceptual problems. We begin with a brief overview of FP technology and its applications in studying development. We then review how FP imaging has influenced research on signaling, cell polarity and morphogenesis. We consider how the dynamics of signaling has become a central subject of investigation through the study of morphogen gradients and oscillatory signaling and illustrate how the study of cell polarization has benefited from the visualization of FPs in living cells. Last, we show how FP imaging has considerably advanced the study of cell shape changes and cell motility during morphogenesis.
FP imaging in the study of development
Researchers have long exploited molecular fluorescence to observe the localization and dynamics of proteins, organelles and cells. The fluorescent properties of a molecule arise from a chemical moiety, the fluorophore (often termed a chromophore), which absorbs light at a particular wavelength and subsequently emits light (fluorescence) at a specific, longer wavelength. The main fluorophores in use are small organic dyes, such as fluorescein and rhodamine (<1 kDa), inorganic nanocrystals, which are also known as quantum dots (QDs) (typically 2-10 nm), and FPs. Although small organic dyes and QDs present advantages over FPs (e.g. the small size of organic dyes and the exceptional photostability of QDs), they need to be conjugated to protein-targeting molecules, such as antibodies, which in turn require cell permeabilization and/or injection or which restrict analysis to extracellular or endocytosed proteins [for a comparison between QDs and organic dyes, see Resch-Genger et al. (Resch-Genger et al., 2008)]. By contrast, FPs are genetically encoded and can be fused to any protein of interest (see Box 1). This makes their use protein-specific, minimally invasive and thus suitable for in vivo studies.
The first FPs used for cell-biological studies were phycobiliproteins, which are light-harvesting proteins found in cyanobacteria and red algae (Oi et al., 1982). Purified phycobiliproteins fluoresce strongly and have been widely used Development 137, 373-387 (2010) doi:10.1242/dev.031690
© 2010. Published by The Company of Biologists Ltd
Lighting up developmental mechanisms: how fluorescence
imaging heralded a new era
Manos Mavrakis1, Olivier Pourquié2and Thomas Lecuit1,*
1IBDML (Institut de Biologie du Développement de Marseille Luminy), UMR6216
CNRS–Université de la Méditerranée, Parc Scientifique de Luminy BP 907, 13009 Marseille, France. 2IGBMC (Institut de Génétique et de Biologie Moléculaire et
Cellulaire) / Inserm U964 / CNRS UMR7104, 67400 Illkirch, France; and Université de Strasbourg, 67000 Strasbourg, France.
*Author for correspondence (lecuit@ibdm.univ-mrs.fr)
D
E
V
E
LO
P
M
E
N
for more than 25 years. However, the need for an exogenous supply of the bilin chromophore has limited their application. A revolution in live fluorescent imaging resulted from the discovery (Shimomura et al., 1962), cloning (Prasher et al., 1992) and expression of GFP from the jellyfish Aequorea victoria in heterologous systems (Chalfie et al., 1994). GFP encodes within
its own structure a tripeptide that is buried at the heart of a 2.4-nm by 4-nm -barrel and that undergoes an autocatalytic reaction to form a functional fluorophore in the absence of any specific exogenous factors other than molecular oxygen. This finding opened the door for the use of GFP in many organisms as a genetically encoded fluorescent label. Mutagenesis studies improved the physical and optical properties of GFP and gave rise to spectral variants with blue, cyan and yellow-green emission spectra or ‘colors’ (reviewed by Tsien, 1998). A major breakthrough in the search for proteins that naturally fluoresce at longer wavelengths was the discovery of GFP homologs in sea anemones and corals of the Anthozoaclass (Matz et al., 1999). CertainAnthozoa-derived GFP-like proteins fluoresce at orange, red and far-red wavelengths and have expanded the palette of FPs, enabling the use of a combination of multiple FPs in the same cells (reviewed by Patterson, 2007).
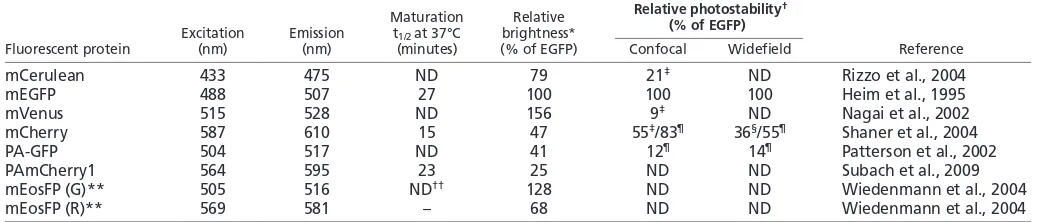
[image:2.612.55.296.68.264.2]Fusing a protein of interest to an FP can affect its native behavior in various ways and can therefore affect the observed developmental process (see Box 2). A knowledge of the physical and optical properties of FPs is crucial to understand if, how and to what extent FPs can affect the localization, function and spatiotemporal dynamics of the tagged protein. All Aequorea victoriaGFP variants weakly dimerize at high concentrations (with a dissociation constant of ~0.1 mM), whereas most GFP-like proteins from Anthozoaspecies form obligate tetramers (with a dissociation constant in the order of 1 nM). Although oligomerization does not prevent their use as reporters for gene expression or as cell markers, it precludes their use in protein fusions (see Box 2). Given that FPs are synthesized in living cells, the time required for the proper folding of the protein, as well as for efficient chromophore maturation (i.e. the rearrangements of amino acids and the reactions needed to produce a functional fluorophore), can be crucial for studies with a narrow observation window (see Table 1 for the maturation half-times of commonly used FPs). The intrinsic ‘brightness’ of an FP, i.e. the product of its extinction coefficient and its fluorescence quantum yield, further determines the intensity of the fluorescence signal that can be captured. Bright FPs require low-intensity illumination, which is preferable for in vivo imaging to minimize phototoxicity and photodamage to the tissue, as well as to reduce photobleaching (excitation-induced photodestruction) of the fluorophore. We recommend that the latest generation of FP variants, which are optimized for faster folding and chromophore maturation, increased brightness and photostability and minimal self-association, should be used (reviewed by Shaner et al., 2007).
The spectrum of biological applications for FPs is wide (see Box 3). Examples include: reporters of transcriptional regulation; markers for clones of cells; in vivo ion sensors (e.g. calcium ion sensors to visualize calcium transients); and fusion proteins targeted to subcellular structures in order to monitor local dynamics. FP photobleaching can be used in some applications to measure protein exchange kinetics. A powerful tool for highlighting specific pools of molecules has emerged with the engineering of ‘photoactivatable’ or ‘optical highlighter’ FPs (Lippincott-Schwartz and Patterson, 2008; Lukyanov et al., 2005). For photoactivatable FPs (PA-FPs), brief irradiation with light of a particular wavelength and intensity results in a change in the spectral properties of the PA-FP, such that the FP is converted from a dark to a bright fluorescent state (photoactivation) or changes from one fluorescence color to another (photoconversion). Applications of PA-FPs in the study of developmental processes have been reviewed elsewhere (see Nienhaus et al., 2006; Stark and Kulesa, 2005).
Box 1. Key considerations for using fluorescent protein tags
Any protein of interest can be tagged with a fluorescent protein (FP), facilitating live imaging on the subcellular to the tissue scale [e.g. (A-C) in a Drosophilaembryo and (D) in an adult Drosophilafly (image courtesy of A. Klebes)]. Modern FPs work well in a wide range of conditions; however, certain issues need to be considered before embarking on FP-tagging of a protein.
Chromophore maturation.Different FPs develop fluorescence with varying kinetics and efficiency. For studying dynamic gene expression patterns with high temporal resolution or for monitoring short-lived proteins, use rapidly maturing FPs (see Table 1).
Self-association. FP monomerization should be enforced through mutations that disrupt self-association [e.g. A206K in Aequorea variants (Zacharias et al., 2002)]. In the absence of true monomers for Anthozoavariants, use tandem dimers (two monomers linked by a sequence of non-specific amino acids to form intramolecular dimers), which act as pseudomonomers.
Brightness. Bright FPs increase the signal-to-noise ratio, which facilitates quantification, and can be detected with less light, thus increasing detection sensitivity, which is important when protein expression is low.
Photostability.Use photostable FPs for long-term protein-tracking experiments in order to minimize undesired photobleaching during image acquisition.
Environmental sensitivity.The fluorescence of acid-sensitive FPs (pKa>6.0; e.g. EYFP) is quenched in acidic compartments. Moreover,
GFP-like proteins retain their fluorescence in lysosomes owing to resistance to acidity and to lysosomal proteases (Katayama et al., 2008). Use pH-insensitive FPs (pKa<5.0; e.g. mCherry) for proteins
targeted to compartments of low pH.
Temperature. FPs have been optimized for rapid folding and chromophore maturation within a wide temperature range. In the case of temperature-sensitive FPs (e.g. mEosFP), use alternative variants.
Site of fusion.Tagging the N-terminus versus the C-terminus, or a cytosolic versus an extracellular or luminal domain, can compromise protein functionality or fluorescence. Control experiments should determine the fusion site that is best tolerated.
A EGFP-Rab11
Recycling endosomes Microtubules Plasma membrane
Posterior wing compartment
D GFP under control of engrailed promoter
B EGFP-Tubulin C GAP43-Venus
D
E
V
E
LO
P
M
E
N
The quantification of FP signals requires the highest signal-to-noise ratios possible, high speeds of excitation and detection, as well as minimal phototoxicity and FP photobleaching. The combination of newly developed ultrafast low-light-level electron-multiplying charge-coupled device (EMCCD) cameras and low-illumination spinning disk systems allows the monitoring of protein and cell dynamics with diffraction-limited spatial and sub-second temporal resolution and minimal invasiveness. Time-lapse imaging can provide useful information about changes in the steady-state distribution of proteins over time. By itself, however, it cannot reveal the kinetic properties of a protein or the stability of a subcellular structure. Photobleaching, photoconversion and subcellular inactivation techniques, combined with time-lapse imaging, have been successfully used to probe and measure local dynamics and forces in a quantitative manner. Box 3 summarizes some applications of useful fluorescence-based techniques that provide quantitative information on the spatiotemporal dynamics of proteins, organelles or cells, whereas artifacts related to the use of FPs or the use of intense light in certain FP applications are discussed in Box 2.
Finally, measurements of fluctuations in fluorescence intensity can be used to calculate local protein concentrations, kinetic parameters of protein turnover or spatiotemporal indicators of tissue dynamics (e.g. tissue elongation or the distribution of polygonal cell shapes). Box 4 summarizes key considerations related to the interpretation of fluorescence recovery curves, the importance of corrections and normalization of fluorescence intensities, and the use of theoretical approaches to fit measured intensities to models. All these considerations pertain in particular to the quantification of morphogen gradients, as discussed hereafter.
Spatial and temporal signaling dynamics: morphogens
Morphogens are molecules that are produced by groups of cells and that distribute throughout a developing tissue in a graded fashion. Different positions of target cells within this concentration gradient will read different instructions, depending on the morphogen concentration/activity and, thus, adopt different cell fates (Wolpert, 1969). Morphogens have served as one of the most influential paradigms for how cell fate is spatially controlled during the development of multicellular organisms. Before any morphogens were identified molecularly, quantitative and predictive models based on morphogen gradient activity had been proposed (Lawrence et al., 1972). It was only in the late 1980s and early 1990s that the first morphogens were shown to exist experimentally: Bicoid in the early Drosophila embryo (Driever and Volhard, 1988a; Driever and Nusslein-Volhard, 1988b; Struhl et al., 1989), Activin/TGFin Xenopus (Green et al., 1992; Gurdon et al., 1994), and the bone morphogenetic protein (BMP) ortholog Decapentaplegic (Dpp) in Drosophila (Ferguson and Anderson, 1992; Lecuit et al., 1996; Nellen et al., 1996). Many examples of morphogens subsequently emerged in animals, such as Wnt/Wingless (Wg) (Zecca et al., 1996; Lecuit and Cohen, 1997; Neumann and Cohen, 1997), fibroblast growth factor (FGF) (Dubrulle and Pourquie, 2004) and Hedgehog/Sonic hedgehog (Briscoe and Ericson, 1999; Strigini and Cohen, 1997).
What is the shape of a morphogen gradient? Do its amplitude and shape evolve or fluctuate over time? How does a gradient form, and how quickly is it established? How do cells respond to a morphogen? Asking such questions that address the dynamics of morphogen action seems straightforward. However, morphogens were not initially identified as such based on the visualization of a graded distribution (with the exception of Bicoid). Instead, the ability of a molecule to specify different cell types according to its concentration and to act directly and at long-range defined it as a morphogen, as was, for instance, the case for Dpp (Lecuit et al., 1996; Nellen et al., 1996; Zecca et al., 1996). The visualization of gradients and a quantitative description of their dynamics have largely only been possible with the advent of live FP imaging. We next illustrate the progression from a mostly descriptive account of morphogen action to a more quantitative understanding of morphogen dynamics by considering studies on the Bicoid and Dpp morphogen gradients.
Visualizing morphogen gradients with FPs
The first molecular evidence for a morphogen gradient was provided by the finding that a gradient of the transcription factor Bicoid (Bcd) controls the anterior-posterior patterning of Drosophilaembryos (Driever and Nusslein-Volhard, 1988a; Struhl et al., 1989). Bcd is translated from a localized mRNA pool at the anterior of the fly embryo. The quantification of antibody stainings from fixed embryos showed that Bcd forms an exponential concentration gradient with a maximum at the anterior tip (Driever and Nusslein-Volhard, 1988a). Recently, the Bcd gradient distribution was quantified more precisely using a functional GFP-Bcd chimera (Gregor et al., 2007b) (Fig. 1A).
The Drosophila TGF homolog Dpp acts as a secreted morphogen to pattern the anterior-posterior axis of the developing wing. Dpp is a secreted ligand that is expressed in a narrow stripe of cells and displays a long-range activity gradient in adjacent fields of cells. The Dpp ligand gradient was visualized for the first time in Box 2. Potential biological artifacts when using FP
fusion proteins
The formation of dimers and higher-order oligomers induced by the FP moiety of a fusion protein can lead to improper targeting and atypical localization, disrupt normal function, alter subcellular dynamics of the tagged protein, or lead to aggregation and cytotoxicity; the interpretation of experiments in which FPs are used to infer protein-protein interactions is also impaired. Genetics should be used to test the functionality of a fusion protein, i.e. the extent to which a tagged protein rescues mutant phenotypes. Biochemistry should back up observations where possible, e.g. on protein stability and turnover. Most importantly, the endogenous levels of the protein under study should be matched, i.e. the expression levels of fusion proteins should be controlled (e.g. through the use of native promoters).
Although cells tolerate red light better than green or blue light (Khodjakov and Rieder, 2006), high-intensity light of any wavelength is inherently deleterious to live cells. The prolonged illumination of FP-expressing cells can lead to the accumulation of reactive oxygen species and to physiological damage (Dixit and Cyr, 2003). Two-photon excitation in mammalian embryos has been shown to maintain viability over long imaging periods, as opposed to extended confocal imaging (Squirrell et al., 1999). The use of UV or high-intensity laser light during photoconversion or inactivation protocols can lead to phototoxicity or photodamage of the tissue. Any criteria related to the tissue morphology and the studied developmental process dynamics should be used to exclude adverse effects from intense irradiation. Finally, standard culture media contain constituents (e.g. riboflavin, tryptophan, HEPES or Phenol Red) that have been shown to have phototoxic effects on cultured cells upon irradiation (Edwards et al., 1994; Lucius et al., 1998; Spierenburg et al., 1984). Care should be taken to minimize photodamage and to maintain the general health of cells.
D
E
V
E
LO
P
M
E
N
flies that expressed a functional GFP-Dpp fusion protein (Entchev et al., 2000; Teleman and Cohen, 2000) (Fig. 1B). These initial studies, together with later work (Belenkaya et al., 2004), confirmed that Dpp is a long-range morphogen, and further allowed its dynamics to be studied.
Addressing gradient formation
The prevailing model for Bcd gradient formation invokes the balance of local Bcd production from its mRNA source, its passive diffusion and its uniform degradation, leading to a steady-state gradient that is then decoded through the regulation of Bcd target genes (‘steady-state decoding’). This model was supported by measuring the diffusion of dextrans of various sizes injected into the embryo, which showed that diffusion in the syncytial embryo can indeed be described by the diffusion equation on the size (~100 m) and time (~1 hour) scale of embryo development (Gregor et al., 2005). These findings were revisited with a GFP-Bcd fusion construct that is expressed in living embryos (Gregor et al., 2007b). Photobleaching experiments (Box 3) and fluorescence recovery analysis (Box 4) were used to measure the diffusivity of GFP-Bcd. Surprisingly, the calculated diffusivity of Bcd in the cytoplasm was much lower than expected (~0.3 m2/s). Coppey et al. (Coppey et al., 2007) proposed a ‘diffusion and reversible nuclear trapping’ model, whereby Bcd diffusion and nucleocytoplasmic shuttling can account for the observed Bcd concentration profile; in this model, nuclei are viewed as reversible traps that slow down Bcd diffusion. Further studies will be required to establish more precisely how the Bcd gradient forms and is maintained.
The use of functional GFP-Dpp fusion constructs led to major insights into the formation of the Dpp gradient. GFP-Dpp studies in the wing disc established that Dpp moves rapidly and non-directionally through the epithelial tissue (Entchev et al., 2000; Teleman and Cohen, 2000). Initial observations showed that the majority of GFP-Dpp is detected within cells, rather than extracellularly. Furthermore, the perturbation of Dpp transport by impaired endocytosis was interpreted to favor a ‘planar transcytosis’ model (Entchev et al., 2000), whereby sequential cycles of endocytosis and exocytosis of bound Dpp spread the Dpp ligand throughout the epithelium, with no diffusion in the extracellular space. A theoretical analysis of morphogen transport, which took into account the interplay of interacting dynamic processes, such as
ligand diffusion, reversible receptor binding, reversible internalization of the ligand-receptor complex and degradation, made predictions that fitted the in vivo observations and challenged the notion of transcytosis over diffusive mechanisms (Lander et al., 2002). The visualization of extracellular GFP-Dpp revealed that an extracellular Dpp ligand gradient is also present (Fig. 1B) and coincides accurately with the Dpp activity gradient (Belenkaya et al., 2004). Belenkaya et al. further argued that endocytosis might not be essential for Dpp movement, but is involved in Dpp signaling (Belenkaya et al., 2004). Important kinetic parameters of the Dpp gradient (the Dpp production rate at the source, the effective diffusive coefficient and the degradation rate) were recently measured in vivo in GFP-Dpp-expressing wing discs (Kicheva et al., 2007) and could accommodate either the extracellular diffusion or the transcytosis model. Finally, live imaging studies have revealed that a subpopulation of early endosomes that contains the endosomal protein Sara, Dpp and the Dpp receptor Thickveins, is inherited equally by the two daughter cells after mitosis, suggesting that the partitioning of signaling endosomes might be involved in Dpp gradient maintenance (Bokel et al., 2006). All these measurements are yet to be used in a theoretical model (see Box 4) that accounts for all the dynamic processes known to be involved in the establishment of the Dpp gradient, including the growth of the epithelium in which Dpp functions.
Although understanding how gradients are formed is essential, the quantification of local signaling activity might ultimately be more important. Strikingly, little is known about how signaling is propagated in quantitative terms and about how signaling activity is interpreted.
Response to gradients
[image:4.612.47.566.73.184.2]The view that the graded distribution of a morphogen can specify distinct cell fates raises fundamental issues about the ability of the system to establish reproducible concentration profiles of the morphogen, about the precision with which the system measures absolute morphogen concentrations and about how reliably it responds to small concentration differences between neighboring cells. Recently, Bcd gradient precision was measured in embryos that express GFP-Bcd (Gregor et al., 2007a) (Fig. 1A) and was found to be on the ~10% level for all parameters measured; concentration differences between neighboring nuclei were found Table 1. Physical and optical properties of commonly used fluorescent proteins
Maturation Relative Relative photostability†
Excitation Emission t1/2 at 37°C brightness* (% of EGFP)
Fluorescent protein (nm) (nm) (minutes) (% of EGFP) Confocal Widefield Reference
mCerulean 433 475 ND 79 21‡ ND Rizzo et al., 2004
mEGFP 488 507 27 100 100 100 Heim et al., 1995
mVenus 515 528 ND 156 9‡ ND Nagai et al., 2002
mCherry 587 610 15 47 55‡/83¶ 36§/55¶ Shaner et al., 2004
PA-GFP 504 517 ND 41 12¶ 14¶ Patterson et al., 2002
PAmCherry1 564 595 23 25 ND ND Subach et al., 2009
mEosFP (G)** 505 516 ND†† 128 ND ND Wiedenmann et al., 2004
mEosFP (R)** 569 581 – 68 ND ND Wiedenmann et al., 2004
*Product of the molar extinction coefficient and the quantum yield, divided by the value for EGFP.
†Time to bleach to 50% emission intensity under arc-lamp illumination (widefield) or during laser scanning confocal microscopy, at an average illumination level that causes
each molecule to emit an average 1000 photons/second initially, as measured in ‡(Shaner et al., 2005), §(Shaner et al., 2008) and ¶(McKinney et al., 2009). The measured
values were normalized by dividing each value by the measured bleach t1/2 for EGFP within each study.
**G, green unconverted form; R, red form.
††Correct folding of the monomeric EosFP variant, mEosFP, is compromised above 30°C. To overcome the thermosensitivity of expression for mEosFP, a tandem dimer EosFP
(tdEosFP) was engineered, which acts as a pseudomonomer and folds readily at 37°C (Nienhaus et al., 2006). A new monomeric EosFP variant, mEos2, was recently developed that folds efficiently at 37°C (maturation t1/2~2 hours at 37°C) and functions well in a broad range of fusions, including proteins that do not tolerate fusion to
tandem dimers (McKinney et al., 2009). ND, not determined.
D
E
V
E
LO
P
M
E
N
to vary by ~10%, concentration variability at corresponding positions in different embryos was of the same order, as was the read-out noise of Bcd as assessed by the activation of one of its target genes, hunchback. The measured precision in target gene expression is consistent with a previous report (Crauk and Dostatni, 2005). Interestingly, the response to Bcd would have to be integrated over ~2 hours in order to achieve such high precision in a ‘steady-state decoding’ model, whereas responses normally occur within a few
minutes. These striking measurements pose new challenges in understanding how cells respond so rapidly and precisely to the Bcd gradient.
The precision of the secreted morphogen Dpp was also measured in GFP-Dpp-expressing discs (Bollenbach et al., 2008) (Fig. 1C). Measurements of gradient precision in the wing disc, together with simulations, argued that the Dpp gradient provides positional information with maximal precision only a few cells away from the Dpp source. This finding raised the possibility that Dpp functions solely as a precise short-range morphogen. Alternatively, other mechanisms could operate to refine the initial positional information provided by a low-precision Dpp gradient. Simultaneous quantitative imaging of Dpp and of the transcription of its target genes will be required to elucidate this further. Recent results on the Wg morphogen suggest that mechanisms based on neighboring cells comparing signaling input normalize signaling output (Piddini and Vincent, 2009); a similar, although unknown, mechanism could refine Dpp signaling.
One way in which cells could filter out morphogen concentration variability or read-out noise is through integrating the morphogen response temporally. Such a mechanism was recently shown to be in place for the sonic hedgehog morphogen response in the chick embryo (Dessaud et al., 2007). Thus, temporal integration of the morphogen response might be a crucial mechanism in conditions in which the morphogen response occurs over several hours and days, during which the tissue increases in size.
In the past few years, GFP fusion constructs have consolidated the existence of morphogens. New problems have arisen to fuel current research on signal transduction. What are the dynamics of signal transduction in growing tissues? How fast and how precisely do cells respond to morphogen gradients, and by what means?
From local to collective signaling: the segmentation clock
The vertebrate body comprises a serial repetition of similar anatomical modules, termed segments or metameres, an arrangement that is particularly obvious in the vertebrae. This segmental pattern is established during embryogenesis when the somites, the embryonic segments of vertebrates, are rhythmically produced from the mesoderm. This process involves an oscillator, the segmentation clock, which controls the rhythmic transcription of a large set of cyclically activated genes downstream of the Notch, FGF and Wnt signaling pathways (Dequeant and Pourquie, 2008).
The segmentation clock was initially identified through the observation of large numbers of chicken embryos of the same somitic age (i.e. synchronized within a 90-minute window, the time it takes to form a somite), in which the transcription factor Hairy1 was detected by in situ hybridization (Palmeirim et al., 1997). The comparison of embryos with different somite numbers labeled for Hairy1revealed similar expression patterns among the different ages, which suggested a cyclic expression pattern.
Periodic Hairy1 expression and its correlation with somite formation were confirmed by splitting chicken embryos along the midline and fixing one half immediately, whereas the other half was cultured for various time periods before fixation. When comparing the two sides, the Hairy1 expression pattern in the presomitic mesoderm (PSM) was always found to differ, unless the cultured half was incubated for exactly 90 minutes, the time required for somite formation. Subsequently, genes with similar PSM expression patterns were identified in other vertebrate species, including mice, zebrafish, frogs and snakes, and similar reconstruction strategies were used to deduce that these genes also exhibit rhythmic Box 3. FPs in the developmental biology experimental
toolkit
Photobleaching.In a fluorescence recovery after photobleaching (FRAP) experiment, fluorescence in a region of interest is photobleached with a high-intensity laser beam, and fluorescence recovery in the bleached region is monitored over time with low-intensity laser light. The quantification of the fluorescence recovery kinetics allows an estimation of diffusivity and mobile fractions and the measurement of the kinetics of exchange between pools of proteins in different compartments. Tissue movements or continuous protein synthesis can render the data unusable or uninterpretable, making photobleaching best-suited to the study of short-range processes.
Photoconversion. Photoactivation can be used for optical pulse-chases with no interference from new protein synthesis, while measurements suffer minimally from tissue movements, making photoconversion suitable for the study of long-range dynamics. The photoconversion of proteins, organelles or cells can be used to determine movement rate and directionality, rates of turnover or exchange between compartments, and for measurements of cell shape and volume fluctuations. In A, for example, the PA-GFP-tagged Toll receptor was photoactivated in the plasma membrane of a Drosophilaembryo, and time-lapse imaging was used to chase Toll over time. Images adapted, with permission, from Mavrakis et al. (Mavrakis et al., 2009).
Subcellular inactivation. The intense illumination of certain fluorophores [e.g. ‘KillerRed’ (Bulina et al., 2006)] produces reactive oxygen species that destroy the tagged molecules. This phenomenon is used in chromophore-assisted laser inactivation (CALI) (Jay and Sakurai, 1999), which offers precise spatiotemporal control of protein inactivation. Nanoablation techniques use intense, tightly focused laser light to disrupt subcellular structures in tissues visualized with FPs and allow the probing of forces that drive tissue dynamics. In B, for example, the nanoablation of the cortical actin in a Drosophila epithelial cell results in the redistribution of E-cadherin-GFP away from focal ablation spots. Images adapted, with permission, from Cavey et al. (Cavey et al., 2008).
Pre-photoactivation Post-photoactivation +10 minutes
A Toll-PA-GFP
B E-cadherin-GFP
t=0 +128 seconds
–2 seconds Fluorescein
uncaging
Pulse
uncaging
D
E
V
E
LO
P
M
E
N
expression linked to the segmentation process (Dequeant and Pourquie, 2008). Until recently, however, the functional analysis of segmentation has been limited as it is extremely difficult to measure variations in oscillation parameters, such as the amplitude and period of oscillations, with such assays in a quantitative manner.
The recent development of fluorescent tools to study the dynamics of this oscillator represents a key advance for the field. First, the promoter of the cyclic gene Hes1(the mouse homolog of Hairy1) was fused to an unstable version of the bioluminescent protein luciferase, and this reporter construct was used to generate transgenic reporter mice (Masamizu et al., 2006). This allowed the detection of the oscillatory waves in cultured mouse embryos and the analysis of oscillations in cultured dissociated PSM cells, which showed a loss of synchronized oscillations (Masamizu et al., 2006). However, luciferase detection does not achieve single-cell resolution in the embryo, a shortcoming that led to the development
of transgenic reporter mice in which a destabilized version of the FP Venus is controlled by the promoter of the cyclic gene lunatic fringe (Lfng) (Aulehla et al., 2008). Despite the brevity of the oscillation period (2 hours in mouse) compared with the folding time and half-life of the Venus construct, this strategy has achieved the accurate detection of Lfngtranscriptional oscillations in vivo. As Lfngis a Notch target, the expression of the reporter reflects the periodic Notch response in the PSM. In mice, Wnt signaling has been shown to oscillate and to act upstream of Notch pathway oscillations (Aulehla et al., 2003). To test whether Wnt periodic activation acts as the pacemaker that controls Notch oscillations, the Venus reporter mice were used to analyze the effect of constitutively activating the Wnt pathway in the PSM (Aulehla et al., 2008). Using two-photon microscopy, up to seven oscillatory waves were analyzed in cultured mouse mutant embryos, which showed that although constitutively active Wnt signaling altered Box 4. Quantification of experiments with FPs
Interpretation of recovery curves.Fluorescence recovery curves can provide information about protein mobility. For example, for E-cadherin-GFP in the Drosophilaepithelium (Aa), FRAP shows the absence of recovery for bright (b, blue curve in d), but not for low-intensity (c, green curve in d), regions. Images adapted, with permission, from Cavey et al. (Cavey et al., 2008). All mechanisms that contribute to the recovery kinetics should be considered, including 3D diffusion, active protein transport and new protein synthesis. The tissue geometry, the geometry of the bleached volume and the time-lapse between bleaching and acquisition need to be taken into account for the interpretation and fitting of recovery data. Corrections and normalization.In FRAP experiments, raw intensities need to be corrected for the bleached fraction, for laser fluctuations and for acquisition photobleaching. To correct for inherent tissue-to-tissue variability or variability due to the imaging setup (e.g. focal plane shifts), the collected intensities need to be normalized to allow comparisons between different experiments. The choice of the set values to which intensities are normalized depends on how the fluctuating parameter affects signal collection. For example, normalization of locally measured intensities to the intensity of the whole tissue accounts for changes due to laser intensity fluctuations during acquisition.
Fitting data and modeling.The choice of equations for fitting fluorescence data depends on the specific assumptions for the studied protein. The approximations used should be justified from in vivo observations, and model-predicted values should be compared with the experimentally measured values when available. For example, simulations were used to compare the elongation of cells in a Drosophilaembryo during germband extension (marked with an E-cadherin-GFP fusion protein and outlined in orange) (Ba,b) with the elongation of cells for different values of tension anisotropy in silico (Bc). Images adapted, with permission, from Rauzi et al. (Rauzi et al., 2008).
Pre-bleach A
E-cadherin-GFP Post-bleach
Pre-bleach
Post-bleach
B E-cadherin-GFP
0:00
38:44
Initial state In vivo
During elongation Final state
In silico
a
b
c
Bright region Low-intensity region Time (s)
% Initial fluorescence
a b c d
D
E
V
E
LO
P
M
E
N
the oscillation amplitude, it had no effect on its period (Fig. 2). This ruled out the possibility that periodic Wnt signaling controls Notch oscillations.
The analysis of transcriptional oscillations at the single-cell level in the embryo is virtually impossible with classical in situ hybridization methods. An interesting illustration of this problem is found in studies of zebrafish segmentation, where it was first proposed that the Notch pathway synchronizes oscillations among nearby cells in the PSM (Jiang et al., 2000). This proposal was mainly based on the observation that in zebrafish Notch mutants, the periodic waves of cyclic gene expression are lost and replaced by a static ‘salt-and-pepper’ gene expression pattern. Jiang et al. argued that this pattern corresponded to desynchronized oscillations in PSM cells (Jiang et al., 2000). This hypothesis was supported by experiments that showed that grafting cells from a donor embryo in which the cyclic genes her1and her7 were depleted through morpholino-mediated knockdown can reset the segmentation clock oscillation schedule non-cell-autonomously
on the grafted side (Horikawa et al., 2006), which argues in favor of a role of the Notch pathway and cell-cell communication in the control of the oscillations. The confirmation of this hypothesis, however, awaits the development of FP-based real-time reporters for cyclic gene expression in zebrafish, which will allow the measurement of dynamic gene expression levels in adjacent cells. Non-synchronized oscillations of mouse Hes1transcription linked to the periodic production of neuronal precursors in the neuroepithelium have been imaged on cultured slices using the Hes1-luciferase reporter (Shimojo et al., 2008). The importance of such oscillations in gating cell differentiation to specific temporal windows is becoming more widely recognized, particularly in the stem cell field, where differentiation could be linked to the dynamic regulation of genes that control pluripotency, such as Nanog (Chambers et al., 2007). The examples above illustrate the power of FP reporter constructs and of real-time imaging, in combination with genetic and pharmacological tools, to identify and analyze complex Bicoid-GFP
A
B
GFP-DppExtracellular GFP-Dpp a
b
a
b
c
[image:7.612.53.420.59.515.2]d c
Fig. 1. Imaging morphogen gradients. (A)Two-photon fluorescent image of a Drosophilaembryo expressing a Bicoid-GFP fusion construct. Surface (a) and sagittal (b) views are shown; scale bar: 50m. Embryos were bathed in a GFP solution of known concentration, and absolute concentrations of Bicoid could be measured along the anterior-posterior axis (c). Red and blue dots are dorsal and ventral, respectively; background fluorescence in wild-type flies that do not express GFP is shown by the black dots. Adapted, with permission, from Gregor et al. (Gregor et al., 2007a); images courtesy of T. Gregor. (B)GFP-Dpp distribution in the Drosophilawing disc. GFP-Dpp autofluorescence (a) and extracellular GFP-Dpp (b) distributions are shown. GFP-Dpp-expressing wing discs (c) were used to measure GFP fluorescence intensity in the boxed regions (white squares in c) as a function of the distance from the source cells (d). Scale bar: 10m. Adapted, with permission, from Belenkaya et al. (Belenkaya et al., 2004) and Bollenbach et al. (Bollenbach et al., 2008).
D
E
V
E
LO
P
M
E
N
regulatory mechanisms, such as oscillatory processes. Such approaches, by allowing the four-dimensional analysis of cell signaling in vivo, could dramatically transform the study of cell signaling dynamics in the next few years.
Symmetry breaking: dynamics of cell polarization Cell polarization underlies a wealth of biological processes during development, and live FP imaging has opened up new directions for the study of polarity initiation and maintenance. FPs have enabled the visualization of lipid and protein asymmetries as they emerge in vivo with high spatial and temporal resolution. Live multicolor FP imaging in 3D has helped to describe, with high resolution, how the generation and/or maintenance of membrane asymmetries correlates with the remodeling of specific cytoskeletal elements, and how specific trafficking pathways contribute to polarization. Finally, photobleaching and photoconversion protocols have proved useful in analyzing local lipid and protein exchange kinetics in order to obtain mechanistic insights into the molecular machineries that underlie the emergence of polarity.
Epithelial apical-basal polarity
Epithelial apical-basal polarity is a prerequisite for the vectorial functions of epithelia, such as secretion in epithelial glands (e.g. salivary glands), the uptake of nutrients or the coordinated
movements of epithelial cell sheets during morphogenesis. The generation of membrane polarity relies on core mechanisms and on sets of conserved proteins (Muller and Bossinger, 2003; Nelson, 2003). However, how polarity arises in developing organisms is still poorly understood. An example of how live imaging has helped to address this question is the study of the de novo generation of a polarized epithelium during Drosophila cellularization. Probing membrane dynamics using fluorescent labeling techniques has revealed a tightly regulated sequence of polarized membrane insertion. Such a mechanism was suggested to participate in the progressive emergence of apical-basal polarity (Lecuit and Wieschaus, 2000). Plasma membrane polarity was recently shown to be established before cellularization by photobleaching and photoconversion experiments that probed the diffusion of different proteins and the effect of actin (Mavrakis et al., 2009). High-resolution imaging of vesicular trafficking pathways in live cellularizing embryos will be required to gain further insights into how membrane and cytoskeletal dynamics control membrane polarization.
Planar cell polarity
Epithelial tissues can acquire polarity perpendicular to their apical-basal axis, which is referred to as planar cell polarity (PCP). PCP is found in a wide range of cell types and is readily apparent in the
AControl
BMutant
CControl
D
MutantMax. intensity
Min. intensity
T
ime (h)
T
ime (h)
[image:8.612.52.514.60.359.2]Head ← Embryo axis [mm] → Tail Head ← Embryo axis [mm] → Tail
Fig. 2. Real-time imaging of oscillatory signaling. (A,B)Representative time series of (A) control -catenin+/+; T-Cre; LuVeLuand (B) mutant
-catenindel(ex3)/+; T-Cre; LuVeLumouse embryos reporting oscillations (green) of Venus/YFP fluorescence driven by the Lfngpromoter. Arrowheads of
different colors indicate successive Venus/YFP waves sweeping the presomitic mesoderm (PSM). The corresponding time within the original time-lapse recording is indicated in the upper right corner. The vertical dashed blue line represents a fixed point in the embryo. (C,D)Graphical representation of fluorescence quantification during PSM development. Fluorescence intensity is color-coded and plotted along PSM length (x-axis) and time (y-axis). The intensities were measured along a line centered in the PSM, as shown in red in the first frame for each series in A and B. Peaks of intensity in control (C) and mutant (D) traverse the embryos from posterior (tail, right) to anterior (head, left) over time. The regression of the oscillatory field from anterior to posterior seen in control embryos (white arrow) is not observed in the mutant embryo. Adapted, with permission, from Aulehla et al. (Aulehla et al., 2008).
D
E
V
E
LO
P
M
E
N
ordered appearance of scales in fish, feathers in birds and hair orientation in animal skin (Fig. 3A). The genetic and molecular dissection of the process by which epithelial tissues undergo planar polarization led to the identification of a conserved set of genes that mediate PCP (reviewed by Simons and Mlodzik, 2008). This core PCP pathway consists of the transmembrane cell surface proteins Frizzled (Fz), Flamingo (Fmi; or Starry night) and Strabismus (or Van Gogh) and the cytoplasmic proteins Dishevelled (Dsh), Prickle and Diego (Adler, 2002).
The use of GFP fusion proteins was crucial in determining the subcellular localization of Dsh and Fz, which could not be determined by immunolabeling owing to technical challenges. The use of functional Fz-GFP and Dsh-GFP fusion proteins revealed the asymmetric distribution of both proteins at the distal cell edges (Axelrod, 2001; Strutt, 2001) (Fig. 3A). This finding corroborated the earlier observation that Fmi localizes to proximal and distal edges (Usui et al., 1999).
How do PCP proteins become asymmetrically localized? The in vivo imaging of Fz-GFP in Drosophila wing cells has revealed the directional transport of Fz-GFP-containing vesicles towards the distal cell surface along a polarized microtubule network (Shimada et al., 2006), raising the possibility that this process participates in the establishment or maintenance of asymmetric cortical domains. The PCP pathway was further found to organize cell packing in the developing wing epithelium.
Initially, wing epithelial cells are irregularly arranged and change to an ordered pattern of predominantly hexagonal cells shortly before prehair formation, i.e. at the time when PCP components are polarized within the plane of the tissue. Live imaging of cellular packing in E-cadherin-GFP-expressing wings has revealed that PCP proteins, together with the recycling of adherens junction components, are required for this hexagonal packing (Classen et al., 2005).
Asymmetric cell divisions
An important mechanism that generates distinct cell identities during development is the asymmetric inheritance of cell fate determinants during mitosis, which is known as asymmetric cell division (Bardin et al., 2004; Knoblich, 2001). Insights into the machinery that directs asymmetric cell division have mainly come from studies in the C. eleganszygote and the Drosophilanervous system. The first division of the worm zygote is asymmetric, whereas Drosophilaneuroblasts and sensory organ precursor (SOP) cells employ asymmetric cell division to give rise to neural precursors and neurons or to sensory organ cells, respectively. Asymmetric division involves (1) the establishment of an axis of polarity in the mother cell, (2) asymmetric cell fate determinant segregation along this axis, and (3) mitotic spindle orientation along the same axis. Live imaging of asymmetric cell divisions has provided major mechanistic insights into this process.
B GFP-PAR-2
Wild type
PCP
mutant
(
fmi
–)
Proximal Distal
Dsh-GFP
C Pon-GFP, Tau-GFP a
b
c
d
Dsh-GFP
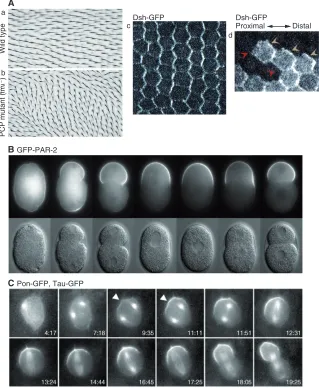
A Fig. 3. Cell polarization.(A)Drosophilawing
hairs are aligned along the proximal-distal axis and point distally in wild-type animals (a), but are misoriented in flamingo(fmi) null mutants (b). Dsh-GFP in the wing disc accumulates asymmetrically at proximal-distal boundaries, producing a pattern of parallel zigzags (c). In a wild-type wing, clones of cells that lack Dsh-GFP reveal that Dsh accumulates only at the distal cell edge (d, yellow arrowheads). Adapted, with permission, from Axelrod (Axelrod, 2001) and Usui et al. (Usui et al., 1999). (B)GFP-PAR-2 becomes enriched in the posterior cell cortex during the first division of the C. eleganszygote. Nomarski and fluorescence images are shown in the top and bottom panels, respectively. Adapted, with permission, from Cuenca et al. (Cuenca et al., 2003). (C)Time-lapse imaging of a sensory organ precursor (SOP) cell that expresses Partner of numb (Pon)-GFP and Tau-GFP (to label microtubules). The Pon-GFP crescent forms before the spindle (arrowheads), and the spindle rotates to line up with the crescent before division. Adapted, with permission, from Bellaiche et al. (Bellaiche et al., 2001).
D
E
V
E
LO
P
M
E
N
[image:9.612.53.372.62.450.2]What establishes the axis of polarity in the mother cell? In the C. eleganszygote, the axis of polarity was revealed by the polarization of the cortex into an anterior domain defined by the presence of the partitioning (PAR) proteins PAR-3 and PAR-6, and a posterior domain defined by PAR-1 and PAR-2 (Cuenca et al., 2003) (Fig. 3B). Live imaging and photobleaching experiments in embryos expressing PAR-FP fusion proteins revealed that PAR proteins produce polarized cytoplasmic and cortical actomyosin flow, which drives the asymmetric distribution of regulatory proteins (Cheeks et al., 2004; Munro et al., 2004).
How are cell fate determinants themselves segregated? In C. elegans, the fate determinant PIE-1 segregates into the posterior half of the cytoplasm during the first embryonic division. Time-lapse imaging of functional PIE-1-GFP revealed that both actin-dependent asymmetric protein localization and local degradation ensure the proper segregation of PIE-1 into one daughter cell (Reese et al., 2000). In Drosophilaneuroblasts, the cell fate determinant Partner of numb (Pon) localizes asymmetrically at the basal neuroblast cortex in a crescent-shaped pattern. Live imaging and photobleaching experiments of Pon-GFP revealed that Pon moves along the cell cortex, and that actomyosin-dependent transport is required for its asymmetric distribution (Lu et al., 1999). Finally, asymmetric protein trafficking was recently implicated in specifying cell fate during the asymmetric divisions of SOP cells. Rab11-positive endosomes are asymmetrically distributed, leading to the activation of the Notch ligand Delta in only one of the daughter cells (Emery et al., 2005).
The unequivocal answer to the question of how the segregation of cell fate determinants is coupled to spindle orientation was provided by the live monitoring of spindle dynamics during the segregation of determinants. FP-tagged centrosomes and microtubules were imaged in embryonic neuroblasts, which showed that the mitotic spindle rotates to align with the polarity axis before the first neuroblast division (Kaltschmidt et al., 2000), but assembles directly along the polarity axis in subsequent cell cycles (Rebollo et al., 2009). In SOP cells, the mitotic spindle rotates and aligns with the Pon-GFP crescent, and the initiation of spindle rotation is dependent on the PCP receptor Fz (Bellaiche et al., 2001) (Fig. 3C).
mRNA localization
Polarized mRNA localization has emerged as a key mechanism for regulating diverse developmental processes with high spatial and temporal control, including the formation of morphogen gradients and the segregation of cell fate determinants (Martin and Ephrussi, 2009). The development of live fluorescence imaging to visualize and monitor mRNA transport in vivo has been key to elucidating the mechanisms of asymmetric mRNA localization. The first protein to be tagged with GFP in any organism was Exuperantia (Exu), a Drosophilaprotein required for the localization of bcdmRNA in the oocyte (Wang and Hazelrigg, 1994). The expression of a functional GFP-tagged Exu protein in living eggs revealed large cytoplasmic particles that transport bcdmRNA along microtubules and target it to the anterior oocyte cortex (Wang and Hazelrigg, 1994). Similarly, time-lapse imaging in Drosophila embryos injected with fluorescently labeled transcripts synthesized in vitro revealed that microtubule-dependent transport in the cytoplasm is required for the apical localization and anchoring of pair-rule and wg mRNA transcripts (Wilkie and Davis, 2001). Becalska and Gavis extensively review recent findings from such studies, as well as methods for tagging RNAs with fluorescently tagged RNA-binding proteins or oligonucleotides (Becalska and Gavis, 2009).
From cell dynamics to tissue morphogenesis The study of morphogenetic processes during the embryonic development of animals and plants has benefited greatly from FP technology. Optical sectioning and the development of highly sensitive detectors, coupled with the ability to label individual cells, has offered a unique ability to monitor in real time and with minimal invasiveness the behavior of single cells with unprecedented spatial and temporal resolution.
Cell migration
Cell migration plays a major role during morphogenesis. Although cell migration can be observed by phase-contrast microscopy, being able to visualize GFP-labeled cells dramatically changed the analysis of cell migration in vivo.
FP labeling of defined groups of cells
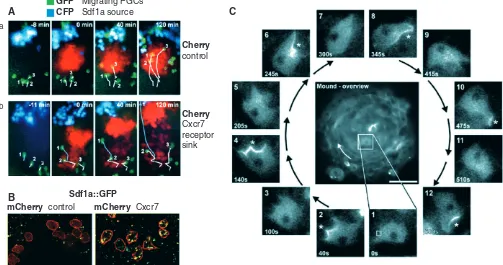
One of the earliest advantages of using FP imaging has been to improve the labeling of defined groups of cells, in particular cells that are scattered and buried in deep tissue layers and hence difficult to track. Previous experiments used the injection of fluorophores, such as DiI, or laser uncaging of caged fluorescein at a certain time of development to follow how groups of cells contribute to given structures, e.g. for the analysis of compartment boundaries in Drosophila embryos (Vincent and O’Farrell, 1992) or of convergent movements during zebrafish gastrulation (Topczewski et al., 2001). FP imaging opened new horizons for the study of cell migration, such as the migration of primordial germ cells (PGCs) in zebrafish (Boldajipour et al., 2008; Doitsidou et al., 2002), mice (Molyneaux et al., 2003) and Drosophilaembryos (Kunwar et al., 2008), neuromast migration along the zebrafish lateral line (Gilmour et al., 2004; Lecaudey et al., 2008), or border cell migration in the Drosophila ovary (Bianco et al., 2007), to cite but a few examples. Transplantation of cells of different genotypes labeled with different GFP variants defined the role of the chemokine Stromal cell-derived factor 1 (Sdf1; Cxcl12) and its receptors Cxcr4 (Doitsidou et al., 2002) and Cxcr7 (Boldajipour et al., 2008) in zebrafish PGC migration and neuromast migration in the lateral line (David et al., 2002; Haas and Gilmour, 2006; Valentin et al., 2007) (reviewed by Ghysen and Dambly-Chaudiere, 2007).
Probing cell dynamics
FP imaging opened the way for analyzing the dynamics of cell migratory behaviors. What is the directionality and velocity of migration, what is the role of specific ligands and receptors, and how do cells respond to these signals during migration? Work in mice (Molyneaux et al., 2003) and zebrafish (Boldajipour et al., 2008; Doitsidou et al., 2002) quantified how motility is modulated in response to the activity of Sdf1, Cxcr4 and Cxcr7, and showed that Cxcr4 is required for the cell-autonomous response to Sdf1, whereas Cxcr7 controls the level of available, extracellular Sdf1through endocytosis, thereby functioning as a sink for Sdf1and controlling the shape of the Sdf1gradient (Boldajipour et al., 2008) (Fig. 4A,B). Specific cell behaviors were revealed by observing migratory cells in an otherwise dark environment. For example, mosaic GFP labeling of intercalating mesoderm cells revealed striking polarized protrusions during convergent extension movements in Xenopus (Wallingford et al., 2000) and in epithelial cells during Drosophila dorsal closure (Jacinto et al., 2002), wound healing (Wood et al., 2002) and tracheal branch extension (Ribeiro et al., 2002). A specific mode of migration involving cell blebbing was observed in
migratory PGCs in the zebrafish (Blaser et al., 2006).
D
E
V
E
LO
P
M
E
N
Local versus global cell behaviors
What is the behavior and contribution of individual cells within a cohort of migratory cells during collective migration? FP imaging has provided unique answers to this question. In Drosophila border cell migration and zebrafish neuromast migration, a subset of cells become leaders at the front of the migratory cluster and drive the movement of the whole cluster. The transplantation of fluorescently labeled cells mutant for the Cxcr4 receptor into wild-type hosts (and vice versa) indicated that Cxcr4 is only required in leading edge cells in order to respond to Sdf1a. Directionality stems from the asymmetry of the cell aggregates in response to FGF signaling, with mesenchymal motile cells being present only at the leading edge, and epithelial cells at the rear (Lecaudey et al., 2008). GFP labeling and live imaging in ovaries revealed two distinct modes of guidance signaling during the collective migration of Drosophila border cells. Initially, localized signaling within the cell is required for the polarized rapid migration; later on, cells shuffle constantly, while cluster migration slows down (Bianco et al., 2007). In this latter case, polarity and the interpretation of guidance cues appear to be a collective decision.
Mapping complex spatial patterns
Tracking individual cells has enabled a detailed description of complex spatial cell migration patterns during gastrulation. Gastrulation is a complex 3D process in which cells change
position in the plane of the tissue, thereby producing the different germ layers. In chick embryos, epiblast cells move, converge towards and ingress through a structure called the primitive streak, and ultimately migrate away from it. The electroporation of GFP into epiblast cells (Zamir et al., 2008) and into a subset of primitive streak cells led to the characterization of the migration trajectories of epiblast, with endodermal and mesodermal cells emerging from the primitive streak at different locations (Yang et al., 2002). Live imaging showed that FGF4 and FGF8 behave like attractant and repellent chemokines, respectively (Yang et al., 2002).
Co-imaging fluorescently immunolabeled fibronectin [a constituent of the extracellular matrix (ECM)] and epiblast cells during primitive streak formation showed that, surprisingly, epiblast cells move little with respect to the ECM, which supports the notion that the majority of epiblast cell movement is associated with ECM migration (Zamir et al., 2008). Cutting-edge two-photon imaging or light-sheet illumination in 3D, coupled with tracking approaches, were recently used to provide a full description of cell movements during Drosophila(McMahon et al., 2008) and zebrafish (Keller et al., 2008) gastrulation. These imaging studies led to the reconstitution of ‘virtual embryos’, with full morphometric and dynamic features, enabling more exhaustive and quantitative analysis of cell movement patterns in toto.
Migrating PGCs A
B
Sdf1a source
GFP CFP
Sdf1a::GFP
mCherry control mCherry Cxcr7
Cherry
control
Cherry
Cxcr7 receptor sink
C a
[image:11.612.55.558.67.332.2]b
Fig. 4. Imaging cell migration during morphogenesis. (A,B)The migration of zebrafish primordial germ cells (PGCs) depends on the chemokine ligand Sdf1a, which behaves as an attractant, and on its receptor Cxcr7. (A)Migrating PGCs labeled with GFP (green) move towards an ectopic Sdf1a source labeled with CFP (blue) in a zebrafish Sdf1a mutant (a). Cell trajectories are shown in white. When PGCs migrate through a field of cells that express Cxcr7 (labeled with Cherry, red) (b) migration is reduced, except when cells avoid Cxcr7-expressing cells (blue line). (B)Somatic cells that express Cxcr7 (labeled with mCherry, red) endocytose Sdf1a fused to EGFP (green), thereby reducing the pool of extracellular Sdf1a. Adapted, with permission, from Boldajipour et al. (Boldajipour et al., 2008). (C)The migration of starved Dictyostelium discoideum cells in a mound aggregate. In the mound, cells rotate in a clockwise direction (white arrow in the center). A cell is followed through a complete rotation cycle [12 separate insets, with time indicated in seconds (s)]. The cell periodically polarizes, accumulating the PH-domain protein CRAC, here fused to GFP, at the leading edge in response to PI3 kinase activation (asterisk). Each burst of polarization coincides with, and is caused by, a wave of cAMP propagating in the counter-clockwise direction (not shown). Adapted, with permission, from Dormann et al. (Dormann et al., 2002).
D
E
V
E
LO
P
M
E
N
Temporal dynamics
Understanding the temporal dynamics of cell migratory patterns has also greatly benefited from FP imaging. A remarkable first example of this is the formation of migratory streams in the starvation-induced development of Dictyostelium mounds and slugs (reviewed by Dormann and Weijer, 2006). Dictyostelium cells communicate by cAMP waves (visible as optical density waves in dark-field microscopy) that propagate within cell aggregates and induce chemotactic responses (Dormann and Weijer, 2001). cAMP gradients polarize cells during this process. The study of GFP-labeled Dictyosteliumcells made it possible to visualize and match the temporal and spatial dynamics of cell polarization (visualized by PI3K-GFP-based sensors) in response to cAMP wave propagation with cell motility (Dormann et al., 2002) (Fig. 4C). These findings led to a quantitative model of morphogenesis (Vasiev and Weijer, 2003). The use of GFP reporter constructs has also been instrumental in elucidating the temporal dynamics of myotome development in the chick embryo, showing that different regions of the forming myotome originate from the migration of successive waves of dermomyotome cells (Gros et al., 2004).
Junction remodeling driving epithelial morphogenesis
Tissue elongation is generally driven by intercalation (reviewed by Keller, 2006). The GFP labeling of cells notably advanced our understanding of the mechanisms that underpin cell intercalation, especially in epithelial tissues.
Epithelial intercalation involves specific patterns of cell junction remodeling, which were initially reported in the zebrafish notochord using fluorescent lipid labeling (Glickman et al., 2003) and in the Drosophila germband using an E-cadherin-GFP fusion protein (Bertet et al., 2004). Cell junctions are remodeled in a planarly polarized sequence of junction shrinkage followed by junction growth. Intercalation involves the exchange of neighbors among four (Bertet et al., 2004) or more (Blankenship et al., 2006) cells, and is driven by polarized Myosin-II enrichment in shrinking junctions (Bertet et al., 2004; Rauzi et al., 2008). A similar, planarly polarized pattern of myosin-II localization has been reported in the chick neural tube (Nishimura and Takeichi, 2008). Live imaging of GFP-labeled neuroepithelial cells will be required to probe possible intercalation patterns associated with neural tube closure.
Drosophila tracheal branch extension also relies on cell intercalation. The precise sequence of intercellular junction disassembly and autocellular junction regrowth that underlies this complex process was mapped in 3D by live imaging of alpha-catenin-GFP-labeled cell junctions (Ribeiro et al., 2004).
Mapping tensile forces in morphogenetic processes
Although it has long been appreciated that multicellular forces drive morphogenetic processes, such as tissue extension, it was not until recently that supracellular or subcellular forces could be measured in vivo through laser-cutting experiments with UV or infrared light beams in living tissues visualized with FPs. Kiehart and colleagues were the first to use UV microsurgery to delineate the forces that drive dorsal closure in Drosophila (Hutson et al., 2003), showing that dorsal closure requires the combined contributions of contractility at the leading edge, a zipping force from the edges of the closing epithelium, and a contraction from the amnioserosa substratum (Hutson et al., 2003). Along the same lines, it was subsequently shown using an infrared laser nano-scissor that the local enrichment of Myosin-II in shrinking junctions during Drosophilacell intercalation generates an anisotropy of tension, the
amplitude of which could be measured in vivo (Rauzi et al., 2008). The ablation of Drosophila tracheal branches with a UV laser showed that cell intercalation within branches depends on forces contributed by tip cells migrating dorsally (Caussinus et al., 2008). In the future, similar laser microsurgery approaches should allow a quantitative analysis of how forces are generated and how they shape tissues.
Conclusions
Embryology and genetics led to the discovery of conserved rules of construction in animal and plant development. FP imaging in living embryos has markedly extended and deepened the molecular understanding of such construction rules, has put them onto a quantitative base, and has been able to elucidate the spatial-temporal dynamics of developmental processes. FP imaging is now beginning to reveal a puzzling complexity. Reproducible cellular patterns are often associated with detectable fluctuations at the molecular and cellular levels. Although such variability has often been ignored in an effort to deduce reductionist rules and models, it has now captured the attention of researchers and raises new questions.
Does the ‘noisy’ behavior of cells reflect imprecise responses to rigid and yet imperfect constraining rules of construction, whether from a signaling or a mechanical (e.g. cytoskeletal) point of view? Alternatively, should we assume that developmental ‘noise’ reflects meaningful (and possibly controlled) fluctuations in signaling and mechanical networks? Addressing these important questions will necessarily rely on the live imaging of fluorescent reporters. It is striking that current models of how cells respond to signaling pathways in vivo are almost devoid of quantitative information. We know little about the sensitivity, amplification, persistence, flow and fluctuation characteristics of signaling pathways and transcriptional responses. Studies in unicellular organisms (bacteria and yeast) and cell culture systems point the way for several potential approaches to pursue these questions (Alon, 2007; Bar-Even et al., 2006; Bialek and Setayeshgar, 2005; Suel et al., 2007; Tkacik et al., 2008; Verveer and Bastiaens, 2008).
As photobleaching techniques became available, it became obvious that the components of almost every living structure were constantly recycled, making dynamic turnover a fundamental feature of living structures. What properties of molecular networks and groups of cells explain the self-assembly of dynamic, yet stationary structures? What can we learn about disease states by understanding dynamic behaviors on the molecular, subcellular and tissue scale?
Bringing quantitative studies and dynamics to the realm of developmental biology through the use of FPs is not simply an aesthetic improvement of imaging. More fundamentally, live FP imaging has opened our eyes to the complexity and to certain remarkable features of developmental processes that we are now only beginning to understand. Thus, and despite considerable advances (see Gilbert, 2006), it is exciting to appreciate that we are still in the stone age of developmental biology. With entire genomes sequenced and all necessary tools at hand, our understanding of developmental biology will move forward with the help of physicists, mathematicians, chemists and computer scientists with whom we share a fascination for exploring how life is constructed.
Acknowledgements
We apologize to our colleagues whose work could not be cited because of space limitations. We thank Loïc Le Goff and Stephen Kerridge for their valuable comments on the manuscript and George Patterson for useful discussions. T.L. is supported by the CNRS, the Association pour la Recherche contre le Cancer, the Fondation pour la Recherche Médicale, the Agence