http://www.sciencepublishinggroup.com/j/ijmi doi: 10.11648/j.ijmi.20190704.12
ISSN: 2330-8303 (Print); ISSN: 2330-832X (Online)
Rotator Cuff Tendinopathy; Comparison Between
Conventional Sonography, Sonoelastography, and MRI in
Healthy Volunteers and Patients with Shoulder Pain
Sameh Ahmad Khodair
*, Usama Elsaied Ghieda
Radiology Department, Faculty of Medicine, Tanta University, Tanta, Egypt
Email address:
*
Corresponding author
To cite this article:
Sameh Ahmad Khodair, Usama Elsaied Ghieda. Rotator Cuff Tendinopathy; Comparison Between Conventional Sonography, Sonoelastography, and MRI in Healthy Volunteers and Patients with Shoulder Pain. International Journal of Medical Imaging. Vol. 7, No. 4, 2019, pp. 91-97. doi: 10.11648/j.ijmi.20190704.12
Received: December 11, 2019; Accepted: December 21, 2019; Published: January 4, 2020
Abstract:
AIM OF THE WORK: To evaluate the value of sonoelastohraphy in rotator cuff tendinopathy. METHODS & MATERILS: Rotator cuff tendons of 40 patients with shoulder pain, patients with complete rotator cuff tear were excluded, 22 men, 18 women; mean age, 47.9 years and 40 healthy volunteers (22 men, 18 women; mean age, 39.8 years were examined by US, and SEL,&MRI. The MRI findings of tendinopathy were used as reference golden standard and were compared to US and SEL findings. By using US intratendinous focal areas of abnormal echogenicity were defined as pathologic. SE images were evaluated using color mapping grading system representing stiff tissue (blue) to more soft tissue (green, yellow, red). RESULTS: In healthy volunteers, SEL of rotator cuff tendons showed mainly blue color with areas of green coloring and normal findings on US scale & T2 MR images. No red or yellow coloring was detected, interpreted as sign for harder tissue characteristics. In patients with shoulder pain showed typical signs of rotator cuff tendinopathy in MRI, 34/40 showed signs of tendinopathy by US while 38/40 showed signs of tendinopathy using SEL. In details, US showed a sensitivity of 85% and specificity of 95% while SEL showed a sensitivity of 95%, specificity of 100%. ROC analysis showed a SEL cut off value of strain ration < 5.4 has a sensitivity of 97.5% & specificity of 100%. CONCLUSIONS: qualitative and quantitative SEL showed improved the sensitivity and specificity in the detection of rotator cuff tendinopathy to the conventional US.Keywords:
Ultrasonography, Elastography, MRI, Rotator Cuff, Shoulder Pain1. Introduction
Real time sonoelastography (SEL) is a new ultrasound technique that can assess the elastic properties of tissues. SEL is based on the principle that the compression of tissue produces strain (displacement). It has already been shown to be useful in breast, prostate, thyroid, cervix and liver diagnostics [1-4] as well as applied in lymph node characterization [5]. So far, in the musculoskeletal system, SEL has been used to evaluate muscles, tendons, plantar fascia and subcutaneous tissue [6].
The term tendinopathy is used to indicate a clinical problem without knowing the specific underlying mechanism or tendon pathology [7, 8]. It is difficult clinically to differentiate between tendinopathy and tear, so imaging is
helpful for the diagnosis. Ultrasonography (US) and magnetic resonance imaging (MRI) are the most commonly used imaging modalities [9–12].
On B-mode ultrasonography, tendinopathy diagnosis depending on morphological changes; as focal or diffuse thickening, intratendinous hypoechoic areas, loss of fibrillar echotexture, and/or hypervascularity [13]. However, it is sometimes impossible to detect pathologic tissue because it presents with the same echogenicity as the surrounding healthy tissues. Under these circumstances, additional methods like SEL could be helpful [14].
represents softer tissues, blue represents harder tissues, and yellow or green represent tissues of intermediate elasticity. The quantitative parameter ‘‘strain ratio (SR)’’ is an index of the relative elasticity between an objective ROI and a reference ROI (usually a subcutaneous fat layer) [15, 16].
This study assesses the SEL of rotator cuff tendons of normal volunteers and SEL findings in patients with rotator cuff tendinopathy compared to B-mode ultrasonography (US) using the magnetic resonance imaging (MRI) as a golden reference.
2. Material & Methods
We examined rotator cuff tendons of 40 consecutive patients with shoulder pain, (22 men, 18 women; mean age, 47.9 years; range, 28-75 years) and 40 healthy volunteers (22 men, 18 women; mean age, 39.8 years; range 23-68 years). Ethics committee approval and informed written consent were obtained.
In all patients, neuromuscular disease, biceps or labral lesions, shoulder instability, acromioclavicular joint arthritis, humeral head arthritis, adhesive capsulitis, calcific tendinitis, rotator cuff full thickness tear, previous surgery on the affected shoulder, and suspected cervical lesions were ruled out by clinical examination and radiologic findings with X - ray radiography and MRI.
Clinical examination was performed by an experienced orthopedic surgeon and included assessment of pain with motion, tenderness, and the ‘‘painful arc’’ sign. The usual complaint was pain during activity and constant chronic pain especially at night. The mean duration of symptoms was 9 months (ranged 3 –18 months).
In this study, rotator cuff tendinopathy was diagnosed when patients had positive signs on the physical examination with focal degeneration of the rotator cuff tendon on the MRI. Clinical examination was performed at the first visit of patients before the radiologic evaluations. All radiologic evaluations (US, SEL and MRI) were performed within a week.
2.1. US and Sonoelastography
All examinations were performed by using a linear-array transducer with a frequency of 6–14 MHz (Logic S7 expert- GE-, USA). Patient sit on the examination couch facing the examiner. The patient’s arm is at his side and his elbow flexed. His forearm is supinated; the probe is placed axially at about the level of the coracoid process to see a longitudinal view of the subscapularis tendon. The patient is asked to externally rotate his shoulder while keeping his arm by his side for a dynamic view of this muscle and tendon. In the same position, the probe is placed axially at the anterior aspect of the shoulder at the level of the coracoid process slightly more lateral to the subscapularis to see a transverse view of the biceps tendon (BT) in the bicipital groove.
The patient is asked to rest the back of his hand on the
couch behind him (waiter’s tip position) & place probe in the sagittal oblique position just superior to the coracoid process to get a transverse view of the proximal supraspinatous (SST) with the anterior-most aspect of the SST marked by the BT. Pan posteriorly for the infraspinatous (IST) and teres minor tendon (TMT). Follow these tendons inferolaterally to see their insertion into the greater tuberosity of the humerus. Then we place probe in the coronal oblique position to get a longitudinal view of these tendons. Pan anteriorly for the SST and posteriorly for the IST and TMT.
B-mode ultrasonography (US) of rotator cuff tendinopathy was diagnosed when the tendon was swollen with a focal or diffuse heterogeneous echogenicity without fiber dehiscence as a sign of a partial or complete tear [17]
Next, SEL was performed by applying light repetitive compression with the hand-held transducer in a perpendicular plan to the tendon. Both B-mode and elastographic images were simultaneously displayed on the same image divided into two panels with the left side showing the B-mode image and the right side showing the elastographic image with superimposed color-coded elasticity features. Between the two images, a strain indicator bar showed whether the displacement was sufficient to obtain local strains within the ROI. The indicator of pressure bar appears as column which in case of adequate compression the full length of the bar became green colored. The elastogram image appeared within a rectangular region of interest (ROI) as a translucent color coded real-time image superimposed on the B-mode image. The ROI is applied to include the subcutaneous fat at the top and the humeral head at the bottom. The color code indicated the relative stiffness of the tissues within the ROI and ranged from red (soft) to blue (hard). Green and yellow indicated medium elasticity.
The probe was applied with appropriate pressure to avoid shifting of the elastogram that referred to the strain indicator. For each tendon, SEL was performed in both the transverse and the longitudinal planes. In each plane, at least three compression-relaxation cycles were applied until reproducible findings were confirmed in both longitudinal and transverse planes. Images were stored as cine loops in the memory of the US system.
Representative sonoelastography images were chosen where the strain indicator is full green that indicate the optimum applied pressure, and then by the cine mode with select the start farm and the end farm where the time in between these frames the applied pressure was optimum. SEL images were evaluated for the tendon color; the blue to green color was considered normal tendon tissue and yellow to red colored area whether focal or diffuse were considered abnormal tendon (tendinopathy) provided that not reached to the articular or bursal tendon surface.
mm to 4 mm adjusted according to the size of abnormal focal lesion in the tendon provided that the both applied to the fat and the tendon focal lesion were the same size and expressed as (B). The strain ratio defined as the ratio of tendon strain index to fat strain index (B/A) that indicate tendon stiffness which was calculated automatically by the ultrasound machine.
2.2. MRI
The magnetic resonance imaging protocol included oblique coronal T1 weighted spin-echo images (800/20 [repetition time ms/echo time ms]; section thickness 3 mm; intersection gap 0.6 mm; field of view 16 cm); oblique coronal proton density fat saturated images and T2-weighted spin-echo images (3000/15 & 2000/90 [repetition time ms/echo time ms]; section thickness 4 mm; intersection gap 0.8 mm; field of view 16 cm), oblique sagittal T2-weighted spin-echo images (20000/80 [repetition time ms/echo time ms], intersection gap 1.2 mm; field of view 16 cm) and Axial T2* images (600/12 [repetition time ms/echo time ms]; flip angle 200; section thickness 3 mm; intersection gap 0.9 mm; field of view 16 cm).
Magnetic resonance images were evaluated by experienced musculoskeletal radiologist who was blinded to the exposure status and symptoms. Rotator cuff tendenosis/tendinopathy were considered when there were abnormal high signals within the substance of the tendon in both T1 WI and T2 WI either focal or diffuse and more globular than linear in its appearance provided that these high signals is less than the high fluid signals on T2 WI and with or without tendon thickening [18].
2.3. Statistical Analysis
Statistical analysis was performed with the Minitab Ver. 16 (Minitab Inc. USA). The Paired t - test was used to analyze differences of the strain index and strain ratio of the rotator cuff tendons in the healthy volunteers and in patient group. P-values less than or equal to 0.05 indicated a statistically significant difference.
Receiver operating characteristic (ROC) curves were used to determine the optimal threshold values of strain ratio using the MedCalc software, version 12.7.8.0.
3. Results
In our study 40 consecutive patients with shoulder pain, (22 men, 18 women; mean age, 52 years; range, 28-75 years) and 40 healthy volunteers (22 men, 18 women; mean age, 48 years; range 23-68 years).
B-mode ultrasonography of the 40 volunteers showed normal thickness of the rotator cuff tendons with homogenous echotexture with no detected areas of abnormal echogenicity in 38 volunteers while the other two volunteers showed small focal area of heterogeneous echo texture with normal thickness, where they diagnosed as tendenosis. SEL examination of their tendons showed diffuse homogenous blue color in 12 volunteers while the 28 volunteers showed diffuse blue color with some areas of green colors, no detected yellow or red areas in any of them. The all volunteers showed a linear area of red color above the bursal surface of the tendon which is related to the potential space of the subacromial bursa (Figures 1, 2, 3 & 4). All the volunteers proved by MRI examination to had normal rotator cuff tendons.
B-mode ultrasonography of the 40 patients with shoulder pain showed 34 patients with abnormal tendons, all of them had the abnormality in the supraspinatous tendon, which showed focal heterogeneous echo texture in 14 patients and diffuse thickening with diffuse heterogeneous echo texture of the tendon in 20 patients denoting tendenosis. The remaining 6 patients showed no abnormality of the tendon echotexture or thickness where diagnosed as normal tendons. SEL examination of the 40 patients showed 38 patients has either focal or patchy areas of yellow to red color within the tendons diagnosed as tendenosis (Figure 5) and the other two patients showed blue color of the tendons with areas of green color diagnosed as normal tendons (table 1), all patients showed typical signs of tendinopathy on MRI.
Two patients out of 38 patients diagnosed by SEL showed linear red color at its articular surface diagnosed to be partial tear which were proved by MRI to be small focal articular surface partial tear. These two patients were missed to have partial tear by B-mode ultrasonography. (Figures 6 & 7)
Table 1. Comparison between B-mode ultrasonography and SEL findings with MRI findings as a reference standard.
MRI findings B-mode ultrasonography SEL diagnosis
True Negative False Positive Total True Negative False Positive Total
Volunteers with normal tendon (40 cases) 38 2 40 40 0 40
Patients with tendinosis (40 cases) 34 6 40 38 2 40
According to (table 1) we found that the sensitivity, specificity and accuracy of B-modes ultrasonography for diagnosis of tendinopathy are 85%, 95% and 90% respectively. While using the SEL color mapping we found that the sensitivity, specificity and accuracy for diagnosis of rotator cuff tendinopathy are 95%, 100% and 97.5% respectively.
Table 2. Comparison of SI and SR measurements in normal population and patients with tendon pathology.
Population Normal (No. 40) Range Mean ± SD Tendon pathology (No.40) Range Mean ± SD P value
Strain Index (SI) 1.32 – 5.7 0.33 – 1.62 0.000
3.69 ± 1.13 0.99 ± 0.36
Strain ratio (SR) 4.4 – 19 0.8 – 5.4 0.000
12.32 ± 3.76 3.28 ± 1.27
ROC analysis of the total 80 rotator cuff tendons; 40 healthy volunteers with normal rotator cuff tendons and 40 patients with rotator cuff tendinopathy (supraspinatous tendon), with the cut of value of SR < 5.4 showed sensitivity & specificity of 97.5% and 100% respectively for tendinopathy.
Figure 1. US of the supraspinatous tendon in sagittal view shows normal thickness, smooth bursal and articular surfaces with homogeneous echotexture.
Figure 2. B-mode US on the left side of image shows normal supraspinatous tendon in sagittal view with overlying SE color mapping on the right side of the image shows diffuse blue color of the tendon with some areas of green color. A linear red zone is seen just above the bursal surface of the tendon corresponded to the potential space of the subacromial bursa.
Figure 3. B-mode US on the left side of image shows normal supraspinatous and infraspinatous tendons in axial view with overlying SE color mapping on the right side of the image shows diffuse blue color of the tendon with some small focal areas of light blue and green color. A linear red zone is seen just above the bursal surface of the tendon corresponded to the potential space of the subacromial bursa.
Figure 4. SE color mapping of the supraspinatous tendon shows diffuse blue color of the tendon with focal lesions of yellow and red color within the substance of the tendon nor reaching to its bursal or articular surface, denoting tendinopathy.
Figure 5. B-mode US of the supraspinatous tendon on the right side of the image shows diffuse thickening of the tendon with non homogeneous echotexture denoting tendinopathy. The SE color mapping on the left side of the image shows multiple patchy focal lesions of yellow color with linear red
color at its articular surface, denoting small partial tear (curved arrow).
Figure 7. SE strain index curve of a normal supraspinatous tendon shows the strain index of the subcutanous fat measures (0.4) and the strain index of the tendon measures (5.6)
Figure 8. SE strain curve of a normal supraspinatous tendon shows the strain ratio measures (14.8).
Figure 9. SE strain curve of a supraspinatous tendinopathy shows the strain ratio measures (1.6). The ROI is a circular in shaped one at the focal lesion of the tendon and the other at the subcutaneous fat as a reference point.
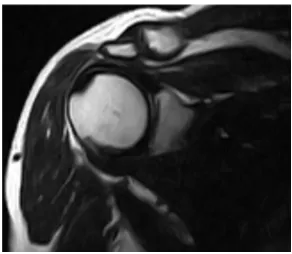
Figure 10. Oblique Coronal MRI (T2 WI) of the same previous patient with tendinopathy shows diffuse abnormal high signals within the tendon less than fluid signals and not reaching to the tendon surface.
Figure 11. Oblique Coronal MRI (T2 WI with fat supp.) of the same previous patient with tendinopathy shows diffuse abnormal high signals within the tendon less than fluid signals and not reaching to the tendon surface.
4. Discussion
RC tendinopathy is a degenerative process with collagen fiber separation, neovascularization, and fatty infiltration [19], causing tendon softens and weakens and may ending into spontaneous tendon rupture [20, 21]. Clinically, patients with RC tendinopathy presenting with gradual onset of activity related pain and decreased function of RC tendons [8, 22]. Multiple mechanisms are accused in the pathogenesis of RC tendinopathy including intrinsic mechanisms like tendon composition and vascularity, and extrinsic mechanisms like morphological features of coraco-acromial arch leading to internal and external impingement [23]. Improvements in MRI techniques, including fast spin-echo imaging and fat saturation, with high soft resolution have facilitated diagnosis of RC abnormalities [24].
B-mode ultrasonography (US) is usually the first imaging method for musculoskeletal problems because of its low cost and real-time access [25, 26] but it is sometimes impossible to detect pathologic tissue because it presents with the same echogenicity as the surrounding healthy tissues [14]. Sonoelastography (SEL) is helpful method as it assesses the mechanical properties of soft tissue. Klauser et al. reported that SEL showed a better histologic agreement when compared with conventional B-mode US in depiction of Achilles tendon degeneration [27]. De Zordo et al. [15] also reported that SEL has better sensitivity, specificity and accuracy in detection of lateral epicondylitis than B-mode US.
Seo et al. [28] reported that SEL showed higher reliability in detection and grading of SSP tendinopathy than B-mode US, and they explained their result as the color coding system SEL used in assessment of the tendon was more objective than evaluating the proportion of heterogeneous echogenicity used on B-mode US, our study in agreement with their result as SEL color mapping showed a sensitivity of 95%, specificity of 100% and accuracy of 97.5%, while US showed a sensitivity of 85%, specificity of 95% & accuracy of 90%.
benign and malignant breast lesions. Same findings has been reported also in studies regarding cervical lymph nodes, in which the strain index was helpful in differentiation of benign and metastatic cervical lymph nodes [33, 34]. Selection of the reference ROI is important to obtain the correct SR indicating the real stiffness of the tissue. Mousa et al. [35] & Cho et al. [36]., in their study about SR of breast masses, reported that fat tissue located at the same depth as the target lesion would be the most adequate reference point to avoid stress decay, which is dependent on the depth of the lesion. However, in musculoskeletal tissues, often a standard tissue for comparison does not exist geographically [37]. In our study, we chose the subcutaneous fat as the reference tissue although of the different depth with the target tissue.
De Zordo et al. [38, 39 & 15] found on their studies that healthy achilles tendons and healthy extensor tendons of the elbow are a hard structures (blue to green coloring), but distinct softening had occurred in the patients’ tendons shown by yellow to red areas within the tendon
.
Abdel Razek N & Ezzat L [40] reported that healthy RC tendons showed blue color all through, consistent with stiff normal tendon tissue while patient with RC tears showed intratendinous color alterations (green, yellow & red) not reaching the bursal or articular aspects in partial tear & reaching the bursal or articular surfaces in complete tear
.
In the current study we used color coding system (ES), SI and SR of SEL to assess RC tendons in healthy volunteers and patients with RC tendinopathy. Among the 40 healthy volunteers, RC tendons displaying blue to green coloring, with SI ranged from 1.32-5.7 (mean=3.69+1.13) and SR ranging from 4.4-19 (mean=12.32+3.76), with high SI & SR found in young sport men below 40 years and low SI & SR in oldest women above 60 years. Among the 40 patients with RC tendinopathies, distinct tendon softening had found with yellow to red coloring, with SI ranging from 0.33-1.62 (mean =0.99 + 0.36) and SR ranging from 0.8-5.4 (mean=3.28 + 1.27).
In our study, SI and SR values of the healthy volunteers and the patients with tendinopathy showed extreme statistically significant difference (p=0.000). Also we found that the SR cutoff value of 5.4 showed a statistically significant difference (P=0.02) in differentiation of healthy RC tendons and RC tendinopathy with a sensitivity and specificity 97.5% and 100% respectively. Unfortunately, we didn’t found similar studies on healthy and diseased tendons to compare this cutoff value with it.
Seo et al. [28] reported that SEL showed positive correlation in grades of RC tendinopathy compared with B-mode US (p=0.001) and MRI (p=0.001), our study in agreement with their result with good correlation between SEL and MRI especially that there were two cases with small articular side partial tear were detected by SEL and not detected by B-mode US.
5. Conclusion
SEL showed improved the sensitivity and specificity in the
detection of rotator cuff tendinopathy to the conventional US. SEL showed good correlation with conventional US & MRI.
Finally, familiarity with the pitfalls and artifacts is essential for the optimal interpretation of SEL. Therefore, comparing SEL and US images is mandatory to recognize and minimize artifacts in the SEL images.
Our study had the following limitations: first, our study population was relatively small to evaluate changes in SR with different age groups and in both gender; second, we correlated the SEL findings with only the B-mode US and MRI findings, but a further comparison with arthroscopic findings and histopathology results would be more helpful; third, paucity of studies regarding SEL application in musculoskeletal tissues, and lastly there is no computability among manufactures regarding the value. It depends on their strain imaging technology and definition of the value and so SEL is depended upon the machine manufactures but we hope to be solved in the future studies.
References
[1] Itoh A, Ueno E, Tohno E, et al. Breast disease: clinical application of US elastography for diagnosis. Radiology 2006; 239: 341-50.
[2] Miyanaga N, Akaza H, Yamakawa M, et al. Tissue elasticity imaging for diagnosis of prostate cancer: a preliminary report. Int J Urol 2006; 13: 1514-8.
[3] Thomas A, Kümmel S, Gemeinhardt O, Fischer T. Real-time sonoelastography of the cervix: tissue elasticity of the normal and abnormal cervix. Acad Radiol 2007; 14: 193-200.
[4] Friedrich-Rust M, Ong MF, Herrmann E, et al. Real-time elastography for noninvasive assessment of liver fibrosis in chronic viral hepatitis. AJR Am J Roentgenol 2007; 188: 758-64.
[5] Lyshchik A, Higashi T, Asato R, Tanaka S, Ito J, Hiraoka M et al. Cervical lymph node metastases: diagnosis at sonoelastography–initial experience. Radiology 2007; 243: 258–267.
[6] Palle L, Reddy MB, Reddy KJ, et al. Technical note: Real-time sonoelastography evaluation of Achilles tendon. Indian J Radiol Imaging 2011; 21: 267-9.
[7] Almekinders LC. Tendinitis and other chronic tendinopathies. J Am Acad Orthop Surg 1998; 6: 157–164.
[8] Fredberg U, Stengaard-Pedersen K. Chronic tendinopathy tissue pathology, pain mechanisms, and etiology with a special focus on inflammation. Scand J Med Sci Sports 2008; 18: 3– 15.
[9] Sher JS, Uribe JW, Posada A, Murphy BJ, Zlatkin MB. Abnormal findings on magnetic resonance images of asymptomatic shoulders. J Bone Joint Surg Am. 1995; 77: 10– 15.
[11] Worland RL, Lee D, Orozco CG, SozaRex F, Keenan J. Correlation of age, acromial morphology, and rotator cuff tear pathology diagnosed by ultrasound in asymptomatic patients. J South Orthop Assoc. 2003; 12: 23–26.
[12] Connor PM, Banks DM, Tyson AB, Coumas JS, D’Alessandro DF. Magnetic resonance imaging of the asymptomatic shoulder of overhead athletes: a 5-year follow-up study. Am J Sports Med. 2003; 31: 724–727.
[13] Robinson P. Sonography of common tendon injuries. AJR Am J Roentgenol 2009; 193: 607-618.
[14] Klauser AS, Faschingbauer R, Jaschke WR. Is sonoelastography of value in assessing tendons? Semin Musculoskelet Radiol 2010; 14: 323-333.
[15] Ophir J, Céspedes I, Ponnekanti H, Yazdi Y, Li X. Elastography: a quantitative method for imaging the elasticity of biological tissues. Ultrason Imaging 1991; 13 (2): 111–134.
[16] Yerli H, Yilmaz T, Kaskati T, Gulay H. Qualitative and semiquantitative evaluations of solid breast lesions by sonoelastography. J Ultrasound Med 2011; 30 (2): 179–186.
[17] Gaitini D. Shoulder Ultrasonography: Performance and common findings. J clin imaging sci. 2012; 2: 30 - 38.
[18] J. Scott McMonagle and Emily N. Vinson. MRI of the shoulder: Rotator cuff. Mar 30, 2012: http://www.appliedradiology.com/articles/mri-of-the-shoulder-rotator-cuff.
[19] Aström M, Rausing A. Chronic Achilles tendinopathy: a survey of surgical and histopathologic findings. Clin Orthop Relat Res 1995 (316): 151–164.
[20] Kainberger F, Mittermaier F, Seidl G, Parth E, Weinstabl R. Imaging of tendons: adaptation, degeneration, rupture. Eur J Radiol 1997; 25 (3): 209–222.
[21] Kannus P, Józsa L. Histopathological changes preceding spontaneous rupture of a tendon: a controlled study of 891 patients. J Bone Joint Surg Am 1991; 73 (10): 1507–1525.
[22] Andres BM, Murrell GA. Molecular and clinical developments in tendinopathy: editorial comment. Clin Orthop Relat Res. 2008; 466: 1519–1520.
[23] Seitz AL, McClure PW, Finucane S, Boardman ND 3rd, Michener LA (2011) Mechanisms of rotator cuff tendinopathy: intrinsic, extrinsic, or both? Clin Biomech (Bristol, Avon). 2011; 26: 1–12.
[24] Sein ML, Walton J, Linklater J, Harris C, Dugal T, Appleyard R, Kirkbride B, Kuah D, and Murrell G AC. Reliability of MRI assessment of supraspinatus tendinopathy. Br J Sports Med 2007; 41: e9.
[25] Klauser AS, Tagliafico A, Allen GM, et al. Clinical indications for musculoskeletal ultrasound: a Delphi-based consensus paper of the European Society of Musculoskeletal Radiology. Eur Radiol 2012; 22 (5): 1140– 1148.
[26] McNally EG. The development and clinical applications of musculoskeletal ultrasound. Skeletal Radiol 2011; 40 (9): 1223–1231.
[27] Klauser AS, Miyamoto H, Tamegger M, et al. Achilles tendon assessed with sonoelastography: histologic agreement. Radiology 2013; 267 (3): 837–842.
[28] Seo JB, Yoo JS and Ryu JW. Sonoelastography findings of supraspinatus tendon in rotator cuff tendinopathy without tear: comparison with magnetic resonance images and conventional ultrasonography. J ultrasound 2015; 18: 143–149.
[29] Zhi H, Xiao XY, Yang HY, Ou B, Wen YL, Luo BM. Ultrasonic elastography in breast cancer diagnosis: strain ratio vs. 5-point scale. Acad Radiol 2010; 17 (10): 1227–33.
[30] Thomas A, Degenhardt F, Farrokh A, Wojcinski S, Slowinski T, Fischer T. Significant differentiation of focal breast lesions: calculation of strain ratio in breast sonoelastography. Acad Radiol 2010; 17 (5): 558–63.
[31] Zhao Q, Li F, Sheng W, Duan S, Zhang H, Ruan L, et al.. Diagnostic value of strain ratio measurement in breast neoplasm. Chin J Gen Surg 2011; 9: 5–17.
[32] Landoni V, Francione V, Marzi S, Pasciuti K, Ferrante F, Saracca E, et al.. Quantitative analysis of elastography images in the detection of breast cancer. Eur J Radiol 2012; 81 (7): 1527–31.
[33] Lyshchik A, Higashi T, Asato R, et al.. Cervical lymph node metastases: diagnosis at sonoelastography: initial experience. Radiology 2007; 243: 258–67.
[34] Arda K, Ciledag N, Gumusdag PD. Differential diagnosis of malignant cervical lymph nodes with real-time ultrasonographic elastography and Doppler ultrasonography. Magyar Radiologia 2010; 84 (3): 159–63.
[35] Mousa AE, Aboelatta M, and Zalata K. Combined sonoelastographic scoring and strain ratio in evaluation of breast masses. The Egyptian Journal of Radiology and Nuclear Medicine 2012; 43: 647–656.
[36] Cho N, Moon WK, Kim HY, Chang JM, Park SH, Lyou CY. Sonoelastographic strain index for differentiation of benign and malignant non-palpable breast masses. J Ultrasound Med 2010; 29 (1): 1–7.
[37] Klauser AS, Miyamoto H, Bellmann-Weiler R, Feuchtner GM, Wick MC, and Jaschke WR. Sonoelastography: Musculoskeletal Applications. Radiology 2014: 272 (3): 622-633
[38] De Zordo T, Fink C, Feuchtner GM, Smekal V, Reindl M, Klauser AS. Real-time sonoelastography findings in healthy Achilles tendons. AJR Am J Roentgenol 2009; 193 (2): W134–8.
[39] De Zordo T, Chhem R, Smekal V, et al. Real-time sonoelastography: findings in patients with symptomatic Achilles tendons and comparison to healthy volunteers. Ultraschall Med; November 27, 2009 [Epub ahead of print]