Effect of Child Health Insurance Plan Enrollment on the Utilization of
Health Care Services by Children Using a Public Safety Net System
Sheri Eisert, PhD, and Patricia Gabow, MD
ABSTRACT. Objective. To examine differences in health care services utilization between children who are enrolled in the Child Health Insurance Plan (CHIP) and uninsured children and between children before and during their enrollment period in CHIP.
Methods. Denver County CHIP enrollment data from 1998 through 2000 were merged with Denver Health uti-lization data from 1998 through 2000 to determine utili-zation rates for CHIP-enrolled children at Denver Health (nⴝ2005). The first method compared the rates of CHIP-enrolled children with those of uninsured children (nⴝ
20 374) during the same time period. The second method compared the utilization of services for children enrolled in CHIP during 1999 before CHIP enrollment (nⴝ748) and during CHIP enrollment (nⴝ 757). The outcomes measured include emergency, urgent care, specialty care, well-child care, dental visits, and immunizations.
Results. For the first method, CHIP children were more likely to have well-child care, dental, and specialty visits and the recommended immunizations than unin-sured children. They were less likely to have an emer-gency care visit than uninsured children. For the second method, before enrolling in CHIP, children had fewer outpatient visits and were less likely to have a well-child care visit than during their enrollment span in CHIP. There was not a significant difference before and during enrollment for the other outcome measures for these children.
Conclusions. These results indicate that children who are enrolled in CHIP are more likely to receive preven-tive care services and less likely to use emergency care than uninsured children, even within a safety net insti-tution, emphasizing the benefits of public insurance pro-grams for children. Pediatrics 2002;110:940 –945; CHIP, uninsured, immunizations, well-child care, safety net.
ABBREVIATIONS. CHIP, Children’s Health Insurance Program; HMO, health maintenance organization; DH, Denver Health; DHMP, Denver Health Medical Plan.
I
t is well documented that lack of health insurance has a negative effect on health status. Studies have shown that uninsured children are more likely to receive services through an emergency care setting, whereas insured children are more likely to receive services through an outpatient setting and to receive preventive care.1–3 Studies have also shown that uninsured children experience considerableun-met health care needs and that care is delayed as the time without insurance increases.4 Moreover, the cost of care for children is considerably less than for adults or seniors.5For these reasons, there have been major efforts to expand health care insurance cover-age for children beginning in the 1980s with the expansion of Medicaid.
However, despite these expansions, approxi-mately 12% of all children younger than 17 years and 21% of families with incomes below 200% of the poverty level lacked heath insurance coverage in 1997.6To address this continued gap in coverage for children, Congress enacted the Children’s Health In-surance Program (CHIP) in 1997.
Since the implementation of CHIP, studies have evaluated the effectiveness of enrolling eligible chil-dren into CHIP.7This enrollment has posed difficul-ties. However, even enrollment into an insurance program does not necessarily guarantee access to needed health care. Once the CHIP-eligible popula-tion has been identified and enrolled, access to ser-vices must follow for CHIP to have a positive impact on the health status of children. Few studies have evaluated the impact of CHIP on access to services, use, and quality of care for children.8,9 One of the most prominent was an evaluation of New York State’s Child Health Plan Plus, a health insurance program that was a prototype for CHIP. This evalu-ation was unique in that it evaluated the benefit of providing health insurance to previously uninsured or underinsured children rather than compared un-insured children with un-insured children. This study uses both methods in evaluating the impact of CHIP on the utilization of health care services. This study is unique in that it examines the impact of CHIP on access and outcomes for children who are receiving care within a safety net institution.
Children who live in the city/county of Denver can enroll in CHIP through a health maintenance organization (HMO) of safety net providers (Colo-rado Access), Denver Health’s (DH’s) wholly owned HMO (Denver Health Medical Plan [DHMP]), or other established HMOs that offer services in the city/county of Denver. As of January 2001, Denver County had 17% of all children currently enrolled in CHIP in Colorado. It is estimated that 9854 children are eligible for CHIP in Denver County, and 4655 of these were enrolled in CHIP as of January 2001. DH enrolled 2665 children through Colorado Access and DHMP. This represents 57% of all Denver County CHIP-enrolled children. Because of the paucity of
From the Denver Health Medical Center, Denver, Colorado. Received for publication Sep 28, 2001; accepted May 29, 2002.
Reprint requests to (S.E.) Denver Health Medical Center, 777 Bannock, MC 8701, Denver, CO 80204. E-mail: sheri.eisert@dhha.org
information on the effectiveness of CHIP in actually providing health care and because of DH’s large share of children enrolled in CHIP, we decided to assess the impact of CHIP enrollment on the children who use the DH system.
METHODS Study Design
The study population consisted of children who were enrolled in the CHIP program through DHMP and whose assigned pri-mary care physician was at DH. Children who were enrolled in DHMP could also choose a primary care provider outside DH; these children are excluded from the analysis because utilization data for these children was not readily available. The DHMP subset was chosen because it offered the opportunity to track all care throughout the integrated delivery system. To determine the effects of CHIP enrollment on the utilization of health services, we compared utilization patterns of CHIP children using 2 different methods. Method 1 is a comparison of all DHMP CHIP-enrolled children to self-pay children, and method 2 is a comparison of a group of CHIP-enrolled children with themselves, before and during enrollment.
Method 1
Utilization patterns of children who were enrolled in CHIP from 1998 through 2000 were compared with utilization patterns of self-pay children during the same time period. Beginning and ending CHIP enrollment dates were obtained from the enrollment data, along with the child’s social security number, birth date, and name. These enrollment identifiers were matched with the iden-tifiers of children who had used services at DH. The utilization of services for the CHIP-enrolled children was evaluated only during their enrollment period.
Self-pay children are defined as children who had at least 50% of their outpatient visits as self-pay visits during the calendar year. This somewhat arbitrary definition was necessary because chil-dren frequently move between payer categories. Therefore, if a child had 4 visits to DH and the primary payer for 1 visit was Medicaid and for 3 visits was self-pay, then this child would be defined as a self-pay child for that year. If 2 of the visits were Medicaid and 2 were self-pay, then the child would also be de-fined as a self-pay child for that year. If the child had 3 Medicaid visits and 1 self-pay visit during the year, then that child would be considered a Medicaid child. Some CHIP-enrolled children may have some self-pay visits for those services not covered.
Method 2
A sample of CHIP enrollees were selected to follow before and during CHIP enrollment. The sample consists of CHIP children who enrolled during the 1999 calendar year. Previous CHIP uti-lization is defined as utiuti-lization within the DH system 12 months before the 1999 enrollment date. Before enrolling in CHIP, chil-dren may have been uninsured or insured by Medicaid or any other payer type besides CHIP. The CHIP enrollment period is defined as the beginning enrollment date in 1999 through the termination date that could have occurred in 1999 or 2000. This enrollment period could be more or less than 12 months.
Data and Measures for Methods 1 and 2
Enrollment data for both methods are from the Child Health Advocate, the CHIP enrollment broker. Utilization data are from DH, which tracks patient utilization throughout the hospital, emergency department and urgent care center, 11 community health centers, 13 school-based clinics, and 3 dental clinics through a unique medical record number. The CHIP enrollment data file includes each child’s social security number, name, and birth date. These identifiers were matched with DH’s utilization database from April 1998 through December 2000 for method 1. For method 2, identifiers of children with beginning enrollment dates in 1999 were merged with DH’s utilization database from January 1998 through December 2000. This time frame was chosen because utilization is compared 12 months before enrollment with utiliza-tion during the enrollment period. No social security numbers were missing for these CHIP-enrolled children from the
enroll-ment file. Because social security numbers for these children may be missing in the DH demographic and utilization files, the un-matched CHIP enrollees were also tracked by birth date and name within the DH outpatient utilization files. Therefore, all possible enrollment identifiers were used to match enrolled CHIP children to the utilization files.
Identical outcome measures were used for both methods, ex-cept for immunization rates that were calculated for method 1 only. The measures include the following number of visit types per unduplicated child: emergency service, urgent care service, well-child care, dental, and all other outpatient visits. The percent-age of children with an emergency, urgent, or well-child care visit was also calculated, along with the percentage of children who were age 0 to 2 years and had received their recommended im-munizations. Emergency services, urgent care, and dental visits were identified by using a code for site of visit. Well-child care visits were identified for visits that were coded with an Interna-tional Classification of Diseases, Ninth Edition, of V20.2 (routine infant or child health check). For each outpatient visit, the primary diagnosis and any other diagnosis (up to 90 possible) were scanned for the V20.2 code. The utilization of inpatient services is not included in this analysis because there are a small number of hospitalizations.
Immunization rates for method 1 were based on whether a child had had the recommended immunizations by the first 12 months (3 diphtheria and tetanus toxoids and acellular pertussis, 2 polio, 2Haemophilus influenzaetype b, and 2 hepatitis B) and by 24 months (4 diphtheria and tetanus toxoids and acellular pertus-sis, 3 polio, 1 measles-mumps-rubella, 3 Haemophilus influenzae
type b, and 3 hepatitis B). Therefore, there are 2 measures for immunization; the first is the percentage of children who had received the recommended immunizations by age 1, and the sec-ond is the percentage of children who had received the recom-mended immunizations by age 2. For a CHIP child to be included in the denominator of this rate, the child had to be enrolled in CHIP during some point of time while they were 0 to 2 years of age and had turned either 1 or 2 years of age by the end of 2000. For a self-pay child to be included in the denominator of the immunization rate, the child had to be defined as self-pay during the calendar year and to have turned 1 or 2 years of age during that calendar year. Once these children were selected, they had to have completed the full set of immunizations by the time they were 1 and 2 years old to be considered in the numerator. Immu-nization rates were calculated for method 1 and not method 2 because the number of 1999 CHIP-enrolled children who turned 1 year and 2 years 12 months before enrollment and during enroll-ment are too small for statistical power.
The denominators for all CHIP measures are normalized to unduplicated children who were enrolled in CHIP and had used services at DH. The denominator does not include children who were enrolled in CHIP and did not utilize services at DH. The rationale for not including all enrolled children in the denomina-tor relates to the method for the determination of utilization rates for self-pay children, which had to be utilization based because there is no enrollment for self-pay children.
Data Analysis
The outcome measures for the 2 groups in method 1—CHIP enrollees and self-pay children—were compared with the use oft
tests for continuous and2for categorical measures. The outcome measures for the 2 groups in method 2—1999 CHIP enrollees 12 months before enrollment and 1999 CHIP enrollees during enroll-ment—were compared using the same tests.P⬍.05 was consid-ered significant.
RESULTS
Table 1 describes the enrollment numbers and the demographics of children who enrolled in DHMP CHIP from 1998 through 2000 and have chosen DH as their provider. More than half of all children who enrolled in DHMP CHIP to date enrolled during 2000. Male and female children are being enrolled at comparable rates. More than 75% of the enrolled children are Hispanic.
Method 1
Table 2 shows the number and distribution of vis-its among self-pay and CHIP-enrolled children dur-ing their enrollment period at DH from 1998 through 2000. During this time period, 20 374 self-pay chil-dren and 2005 CHIP-enrolled chilchil-dren had used ser-vices at DH. Therefore, approximately 64% of DHMP CHIP-enrolled children had used services at DH dur-ing their enrollment period. The average enrollment period was approximately 8 months. The average enrollment period is⬍12 months because during the initial implementation stages of CHIP, children were enrolled in CHIP and had not chosen a managed care plan. Children are also disenrolled from DHMP
CHIP when they reach 19 years of age and when they move out of Denver County.
Children enrolled in CHIP had significantly more total visits (with and without ancillary services) than self-pay children (P⬍.0001). Ancillary visits include radiology, pharmacy, and laboratory visits. CHIP-enrolled children also had significantly more spe-cialty care visits (P ⬍ .0001), well-child care visits (P⬍ .0001), and dental visits (P⬍ .0001) compared with self-pay children. On average, 42% of the CHIP children had a well-child care visit during their en-rollment period compared with approximately 30% of the self-pay children (P⬍.0001) during the calen-dar year. CHIP children had significantly fewer (P⬍ .0001) emergency department visits than self-pay children, but there was not a significant difference between CHIP and self-pay children in the use of the urgent care clinic.
CHIP children were also more likely to have up-to-date immunizations at 12 months and 24 months. A total of 172 children turned 1 year of age by December 2000 and were enrolled in CHIP sometime before turning 1; 90.7% of these children had up-to-TABLE 1. Descriptive Characteristics of Children Enrolled in DHMP CHIP
1998 (N⫽386)
1999 (N⫽1022)
2000 (N⫽1744)
Total (N⫽3152)
Gender N % N % N % N %
Female 206 53.4 496 48.5 881 50.5 1583 50.2
Male 180 46.6 526 51.5 863 49.5 1569 49.8
Race/ethnicity
Asian 1 0.3 4 0.4 18 1.0 23 0.7
Black 47 12.2 89 8.7 166 9.5 302 9.6
Hispanic 285 73.8 796 77.9 1338 76.7 2419 76.7
Native American 1 0.3 8 0.8 10 0.6 19 0.6
White 33 8.5 73 7.1 130 7.5 236 7.5
Other 7 1.8 16 1.6 20 1.1 44 1.4
Unknown 12 3.1 36 3.5 62 3.6 110 3.5
Age at time of enrollment (y)*
9.7⫾5.2 9.2⫾5.2 9.0⫾5.2 9.2⫾5.3
* Values of age in years are mean⫾standard deviation.
TABLE 2. 1998 to 2000 DHMP CHIP Enrollee Utilization Compared With Self-Pay Utilization
Type of Visit* CHIP
Enrollees (N⫽2005)
Self-Pay (N⫽20374)
PValue†
Total visits with ancillary 3.140⫾3.483 2.147⫾2.065 ⬍.0001 Total visits without ancillary 3.076⫾3.387 2.066⫾1.898 ⬍.0001
Total emergency visits 0.109⫾0.387 0.190⫾0.468 ⬍.0001
Total urgent care visits 0.416⫾0.848 0.428⫾0.786 .5267
Emergency and/or urgent care visits 0.664⫾1.217 0.694⫾1.014 .2834 Total well-child care visits 0.416⫾0.596 0.354⫾0.682 ⬍.0001
Total specialty visits 0.351⫾0.934 0.261⫾0.796 ⬍.0001
Total ancillary visits 0.063⫾0.299 0.081⫾0.418 .0131
Total dental visits 0.229⫾0.756 0.148⫾0.526 ⬍.0001
Emergency visit (%) 10.7 17.6 ⬍.0001
Urgent care visit (%) 30.7 32.7 .0592
Well-child care visit (%) 42.0 29.4 ⬍.0001
Immunizations
Up-to-date at 12 mo (%) 90.7 (N⫽172) 63.5 (N⫽1637) ⬍.0001 Up-to-date at 24 mo (%) 85.6 (N⫽132) 54.3 (N⫽2054) ⬍.0001
Days of enrollment (CHIP only) 235.1⫾99.1 NA
NA indicates not applicable.
date immunizations at 12 months. A total of 1637 self-pay children turned 1 year old from April 1998 through December 2000. Only 63.5% of these chil-dren had up-to-date immunizations by the time they turned 1 year (P ⬍ .0001). A total of 132 children turned 2 years of age by December 2000 and were enrolled in CHIP for a time span before turning 2 years; 85.6% of these children had up-to-date immu-nizations by the time they turned 2 years old, whereas only 54% of the self-pay children had up-to-date immunizations (P⬍ .0001).
Method 2
Table 3 describes 1999 enrolled children and their utilization of services before and during their enroll-ment in CHIP. Of the 1022 children who were en-rolled in CHIP during 1999, 757 had used services at DH during their CHIP enrollment period and 748 children had used services at DH 12 months before CHIP enrollment.
During CHIP enrollment, CHIP children had sig-nificantly more outpatient visits, with and without ancillary services (P⬍ .0255,P ⬍.0212) than the 12 months before enrolling in CHIP. While enrolled in CHIP, these children were also more likely to receive a well-child care visit than before enrolling in CHIP (P⬍.0364). There was not a significant difference in
the use of emergency and urgent care, dental visits, or specialty care.
Comparison of Results for Methods 1 and 2
To understand why the results of the first method demonstrate greater affect of CHIP on access and utilization, it is necessary to look at the payer type of CHIP enrollees before enrollment. The comparison group in the first method is self-pay children, but the comparison group in the second method is not nec-essarily uninsured children. Table 4 describes the payer type of 1999 CHIP enrollees before enrollment in CHIP. There were 3162 visits for the 748 children who had used services at DH 12 months before en-rollment. Only 14% of these visits were self-pay visits before enrollment. Approximately 24% of the visits were insured visits by Medicaid and private insur-ance. The most visits were for patients who were enrolled in the Colorado Indigent Care Program, which is not considered an insurance program be-cause providers are reimbursed from the State of Colorado for a small part of the health care costs for these patients. However, a payment mechanism for their care exists.
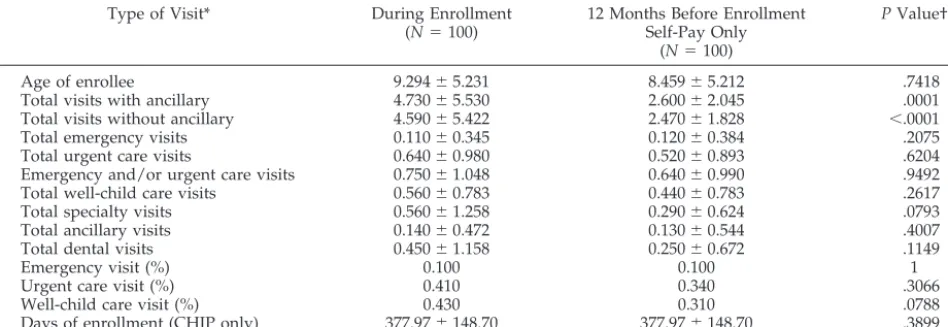
Table 5 describes the utilization patterns of 1999 CHIP-enrolled children who were self-pay during the 12 months before enrolling in CHIP, thereby excluding children who were previously enrolled in Medicaid, private insurance, or the Colorado Indi-gent Care Program. One hundred children met this criterion. The results are similar to the results above, except that there was not a significant difference in the percentage of children who had received a well-child care visit. Although most of the indicators are not significantly different, the differences move in a similar direction to the results in Table 2. With the relatively large standard deviations, the results may prove to be significant with a larger sample size.
Limitations
There are a number of limitations to this study. First, the results represent data from only 1 provider. However, DH provides 50% of the uncompensated TABLE 3. 1999 DHMP CHIP Enrollee Utilization During and Before Enrollment
Type of Visit* During Enrollment (N⫽757)
12 Months Before Enrollment
(N⫽748)
PValue†
Age of enrollee (CHIP) 9.556⫾5.470 8.586⫾5.684 .0008
Total visits with ancillary 4.783⫾5.327 4.227⫾4.266 .0255 Total visits without ancillary 4.684⫾5.195 4.127⫾4.122 .0212
Total emergency visits 0.140⫾0.450 0.170⫾0.487 .2188
Total urgent care visits 0.672⫾1.291 0.646⫾1.208 .679
Emergency and/or urgent care visits 0.812⫾1.427 0.816⫾1.356 .9656 Total well-child care visits 0.571⫾0.748 0.610⫾0.968 .383
Total specialty visits 0.484⫾1.186 0.471⫾1.273 .8389
Total ancillary visits 0.099⫾0.401 0.100⫾0.490 .9589
Total dental visits 0.379⫾1.166 0.300⫾0.912 .1398
Emergency visit (%) 11.2 13.0 .3009
Urgent care visit (%) 34.6 35.3 .7809
Well-child care visit (%) 45.3 40.0 .0364
Days of enrollment (CHIP only) 382.6⫾134.2 NA
NA indicates not applicable.
* All visits calculated as mean number of visits per child except for (%). †ttest for continuous variables and2for categorical variables.
TABLE 4. Payer Type for DHMP CHIP Children 12 Months Before 1999 CHIP Enrollment
Payer Type N %
CICP 1180 37.3
Other* 594 18.8
Medicaid 581 18.4
Self-pay 440 13.9
CHIP† 195 6.2
Private 172 5.4
Total 3162 100.0
CICP indicates Colorado Indigent Care Program.
* Includes children who are provided care at school-based clinics, Head Start, and the Division of Youth Corrections.
care for the Denver metropolitan area and is the single largest provider for CHIP enrollees in Denver. Therefore, the results are likely representative of un-insured and CHIP-enrolled children. Moreover, it provides an important perspective regarding chil-dren who receive care in a safety net setting. Second, for method 1, only CHIP enrollees who used services were analyzed because they were compared with uninsured children who used services. However, this limitation is largely overcome by method 2. Third, it is possible that children had used services outside the DH system, which were not included in this analysis. However, this is unlikely because these children were already users of the DH system when they enrolled in CHIP and chose DH as their pro-vider. Finally, for method 2, CHIP children were enrolled for an average of 12 months and 17 days and previous CHIP utilization was based on data for 12 months. However, this difference is likely to be in-consequential.
CONCLUSION
The enactment of the CHIP was the most signifi-cant expansion of health care coverage in this coun-try since the development of Medicaid. The goal of this ambitious program was to provide improved access to health care for millions of uninsured chil-dren. Early in the implementation stages of this gram, it became clear that enrollment into the pro-gram provided some significant challenges.10 It seemed that⬎50% of eligible children were not en-rolling. Numerous approaches, including outreach and simplification of the applications, have been de-veloped to address the enrollment issues. To date, little information has been available to demonstrate whether enrollment in the CHIP actually improves access to care and health outcomes.8 Because Colo-rado was one of the first states to implement the CHIP, it was an ideal state for investigation of this question.
DH provided an ideal venue for this investigation. DH is the principal safety net provider for Denver; is an integrated delivery system that provides emer-gency, primary and specialty care; has a unique
pa-tient identifier that links a papa-tient through the con-tinuum of care; has a sophisticated information system that enables tracking patient utilization across the continuum of care; has its own HMO for the CHIP enrollment; and is the largest single pro-vider for the CHIP in Denver. In addition, as the principal safety net provider, many of the children who were eligible for the plan had previously used DH as there health care provider, permitting com-parison of patterns of utilization before and during enrollment and a concurrent comparison of unin-sured children with children enrolled in the child health plan. The data demonstrate that even within a safety net institution, CHIP has been successful in achieving its goal of improved access to health care for children. Compared with uninsured children, children who are enrolled in CHIP have more well-child visits, have more specialty visits, and are more likely to be up-to-date on their immunizations and have fewer emergency department visits. In addi-tion, once children are enrolled in CHIP, they had more visits and more well-child visits than they did before enrollment. This is particularly impressive when one realizes that uninsured children in Denver have access to DH’s integrated health care system, which has 13 school-based clinics, 10 family health centers located in underserved neighborhoods, and pediatric urgent care. One might anticipate that the impact on access would be even greater in commu-nities that do not have as well-developed a safety net system.
Although 1 goal of CHIP was to improve access to primary care, it is noteworthy that CHIP-enrolled children also used more specialty care. This access is particularly important for children with chronic dis-eases such as asthma. Similarly, it was surprising that compared with uninsured children, CHIP-en-rolled children had more dental visits. This would not have been anticipated because dental was not a covered benefit in Colorado’s CHIP program. Per-haps families did not understand this and assumed that it was covered because DH provides dental care. There are not many short-term measures for im-proved health outcome in children secondary to en-TABLE 5. 1999 DHMP CHIP Enrollee Utilization for Children Who Were Self-Pay Before Enrollment
Type of Visit* During Enrollment
(N⫽100)
12 Months Before Enrollment Self-Pay Only
(N⫽100)
PValue†
Age of enrollee 9.294⫾5.231 8.459⫾5.212 .7418
Total visits with ancillary 4.730⫾5.530 2.600⫾2.045 .0001
Total visits without ancillary 4.590⫾5.422 2.470⫾1.828 ⬍.0001
Total emergency visits 0.110⫾0.345 0.120⫾0.384 .2075
Total urgent care visits 0.640⫾0.980 0.520⫾0.893 .6204
Emergency and/or urgent care visits 0.750⫾1.048 0.640⫾0.990 .9492
Total well-child care visits 0.560⫾0.783 0.440⫾0.783 .2617
Total specialty visits 0.560⫾1.258 0.290⫾0.624 .0793
Total ancillary visits 0.140⫾0.472 0.130⫾0.544 .4007
Total dental visits 0.450⫾1.158 0.250⫾0.672 .1149
Emergency visit (%) 0.100 0.100 1
Urgent care visit (%) 0.410 0.340 .3066
Well-child care visit (%) 0.430 0.310 .0788
Days of enrollment (CHIP only) 377.97⫾148.70 377.97⫾148.70 .3899
rollment. Immunization is one such measure. There-fore, it is important to note that CHIP-enrolled children had a significantly higher age-appropriate immunization rate than uninsured children. This is even more impressive given that the overall age-appropriate immunization rate for all children who utilize DH is⬎70%.
It is noteworthy that approximately 64% of the enrolled children actually used services. Because at the time of study, Colorado’s CHIP program re-quired monthly premium payments, there were con-cerns that only the sickest children would enroll. Clearly, a considerable number of parents were will-ing to pay the premium truly to provide “insurance” in case their children needed health care. Similarly, there has been a national as well as a local concern for crowd-out with families dropping commercial insurance for this less expensive option. Only 6% of the children had private insurance in the year before enrolling in CHIP. We did not specifically investigate whether these families had lost private coverage, but that certainly could have been possible. Eighteen percent of the children who enrolled in CHIP had been on Medicaid, and 37% had been on the state’s indigent care program in the year before enrolling in CHIP, demonstrating the flux of family incomes around the relatively narrow band between 185% and 200% of the federal poverty level. This suggests the need truly to integrate enrollment and movement between health insurance programs aimed at the
poor. Thus, it seems that CHIP has fulfilled its main objective to improve access to care for America’s children.
ACKNOWLEDGMENT
We thank The Colorado Trust and the W. K. Kellogg Founda-tion for research support for this study.
REFERENCES
1. Butler J, Winter W, Singer J, et al. Medical care use and expenditure among children and youth in the United States. Pediatrics.1985;76: 495–507
2. Newacheck P, Halfon N. Access to ambulatory care services for eco-nomically disadvantaged children.Pediatrics.1986;78:813– 819 3. Stoddart J, Peter RT, Newacheck P. Health insurance status and
ambu-latory care for children.N Engl J Med.1994;330:1421–1425
4. Lave J, Keane C, Lin CJ, Ricci EM, Amersbach G, La Vallee CP. The impact of lack of health insurance on children.J Health Soc Policy. 1998;10:57–73
5. Mendelson D, Schwartz W. The effects of aging and population growth on health care costs.Health Aff (Millwood).1993;12:119 –125
6. Brennan N, Holahan J, Kenney G.Snapshots of America’s Families: Health Insurance Coverage of Children. Washington, DC: The Urban Institute; 1999
7. Ullman F, Bruen B, Holahan J. The state children’s health insurance program: a look at the numbers. Washington, DC: The Urban Institute; 1998 (Occasional Paper No. 4:1–23)
8. Holl JL, Szilagyi PG, Rosewald LE, et al. Evaluation of New York State’s Child Health Plus: access, utilization, quality of health care, and health status.Pediatrics.2000;105(suppl):711–718
9. Szilagyi PG, Shone LP, Holl JL, et al. Evaluation of New York State’s Child Health Plus: methods.Pediatrics. 2000;105(suppl):697–705 10. Kenny G, Ullman F, Weil A.The State Children’s Health Insurance
Program: A Look at the Numbers.Assessing the New Federalism Policy Brief A-44.Washington, DC: The Urban Institute; 2000
ENRON: PLEASE COPY
“Rats and roaches live by competition under the law of supply and demand; it is the privilege of human beings to live under the laws of justice and mercy. It is impossible not to notice how little the proponents of the ideal of competition have to say about honesty, which is the fundamental economic virtue, and how very little they have to say about community, compassion, and mutual help.”
Berry W.What Are People For?San Francisco, CA: North Point Press; 1990:135
DOI: 10.1542/peds.110.5.940
2002;110;940
Pediatrics
Sheri Eisert and Patricia Gabow
Care Services by Children Using a Public Safety Net System
Effect of Child Health Insurance Plan Enrollment on the Utilization of Health
Services
Updated Information &
http://pediatrics.aappublications.org/content/110/5/940 including high resolution figures, can be found at:
References
http://pediatrics.aappublications.org/content/110/5/940#BIBL This article cites 7 articles, 3 of which you can access for free at:
Subspecialty Collections
_sub
http://www.aappublications.org/cgi/collection/child_health_financing
Child Health Financing
http://www.aappublications.org/cgi/collection/advocacy_sub
Advocacy
following collection(s):
This article, along with others on similar topics, appears in the
Permissions & Licensing
http://www.aappublications.org/site/misc/Permissions.xhtml in its entirety can be found online at:
Information about reproducing this article in parts (figures, tables) or
Reprints
DOI: 10.1542/peds.110.5.940
2002;110;940
Pediatrics
Sheri Eisert and Patricia Gabow
Care Services by Children Using a Public Safety Net System
Effect of Child Health Insurance Plan Enrollment on the Utilization of Health
http://pediatrics.aappublications.org/content/110/5/940
located on the World Wide Web at:
The online version of this article, along with updated information and services, is
by the American Academy of Pediatrics. All rights reserved. Print ISSN: 1073-0397.