The Association Between Developmental Coordination
Disorder and Other Developmental Traits
WHAT’S KNOWN ON THIS SUBJECT: Previous clinic-based samples have shown an overlap between developmental coordination disorder, ADHD, autism, and dyslexia. However, there has been limited population-based work on the association of DCD with other developmental traits that account for potential confounding factors.
WHAT THIS STUDY ADDS: Using data from the ALSPAC (N⫽6902 maximum), these study results show that children with probable DCD have an increased risk of difficulties in attention, short-term memory, and academic and social skills, after controlling for confounding factors including IQ and other developmental traits.
abstract
OBJECTIVE:To explore associations between developmental coordina-tion disorder (DCD) and attencoordina-tion, language, social skills, and aca-demic ability in a population-based cohort.
METHODS:We analyzed data (N⫽6902) from the Avon Longitudinal Study of Parents and Children (ALSPAC). Probable DCD was defined as children below the 15th centile of the ALSPAC Coordination Test aged 7 years with functional impairment in activities of daily living or handwriting, excluding children with neurologic difficulties or an IQ of⬍70. Four developmental domains were assessed by using standardized tests between the ages of 7.5 and 9 years: attention; language skills (expressive language, compre-hension, short-term memory); social skills (nonverbal skills and social communication); and academic ability (reading and spelling). The worst 5% of each trait was used to define impairment. We used multiple logistic regression models to assess the association between probable DCD and each trait. Our final model controlled for IQ, socioeconomic factors, and other developmental traits not in the domain assessed.
RESULTS:A total of 346 (5.0%) children met criteria for probable DCD. Probable DCD was associated with difficulties in attention (odds ratio [OR]: 1.94 [95% confidence interval (CI): 1.17–3.24]), nonword repeti-tion (OR: 1.83 [95% CI: 1.26 –2.66]), social communicarepeti-tion (OR: 1.87 [95% CI: 1.15–3.04]), reading (OR: 3.35 [95% CI: 2.36 – 4.77]), and spelling (OR: 2.81 [95% CI: 2.03–3.90]).
CONCLUSIONS:Children with probable DCD had an increased risk of difficulties in attention, social skills, reading, and spelling. These additional difficulties need to be screened for during assessment
and considered when formulating interventions. Pediatrics 2010;
126:e1109–e1118
AUTHORS:Raghu Lingam, MBChB, MSc, MRCPCH,aJean
Golding, PhD, DSc, FMedSci,aMarian J. Jongmans, PhD,b,c
Linda P. Hunt, PhD,dMatthew Ellis, MB, ChB, PhD,
MRCPCH,aand Alan Emond, MB, MD, FRCPCHa
aCentre for Child and Adolescent Health, School of Social and
Community-Based Medicine, University of Bristol, Bristol, United Kingdom;bDepartment of Pediatric Psychology, Wilhelmina
Children’s Hospital, Utrecht, Netherlands;cUniversity Medical
Center Utrecht and Department of Special Education, Faculty of Social Sciences, Utrecht University, Utrecht, Netherlands; and
dSchool of Clinical Sciences, University of Bristol, Bristol, United
Kingdom
KEY WORDS
developmental coordination disorder, DCD, child development, attention, language development, memory, reading, spelling, social interaction, ALSPAC, developmental disabilities
ABBREVIATIONS
DCD—developmental coordination disorder
DSM-IV—Diagnostic and Statistical Manual of Mental Disorders Fourth Edition
ADL—activity of daily living SLI—specific-language impairment ASD—autism spectrum disorder
ALSPAC—Avon Longitudinal Study of Parents and Children DAWBA—Development and Well-being Assessment MABC—Movement Assessment Battery for Children WOLD—Wechsler Objective Language Dimensions SCDC—Social and Communication Disorders Checklist WORD—Wechsler Objective Reading Dimensions OR—odds ratio
CI—confidence interval
www.pediatrics.org/cgi/doi/10.1542/peds.2009-2789
doi:10.1542/peds.2009-2789
Accepted for publication Jul 20, 2010
Address correspondence to Raghu Lingam, MBChB, MSc, MRCPCH, Centre for Child and Adolescent Health, Department of Community-Based Medicine, University of Bristol, Bristol BS6 6JS, United Kingdom. E-mail: [email protected]
PEDIATRICS (ISSN Numbers: Print, 0031-4005; Online, 1098-4275).
Copyright © 2010 by the American Academy of Pediatrics
Developmental coordination disorder (DCD) is defined according to the Diag-nostic and Statistical Manual of Men-tal Disorders, Fourth Edition(DSM-IV) criteria, as a condition marked by a severe impairment in the development of motor coordination, which signifi-cantly interferes with activities of daily living (ADL) and/or academic achieve-ment, not caused by a general medical condition or severe learning impair-ment.1Although there is extensive
lit-erature describing the overlap be-tween DCD and conditions such as
attention-deficit/hyperactivity
disor-der, specific-language impairment
(SLI), autism spectrum disorder (ASD), and dyslexia in clinic-based samples, few population-based studies have ad-equately controlled for confounding factors.2–5
The aim of our study was to assess the association between children with probable DCD, defined by using criteria based on the DSM-IV, and difficulties in attention, language, and short-term memory; social skills; and academic ability (reading and spelling) within a prospective population-based sample, accounting for known confounding factors and the colinearity of the devel-opmental traits themselves.
PATIENTS AND METHODS
Sample
The Avon Longitudinal Study of Parents and Children (ALSPAC) is a prospective population-based birth cohort study designed to investigate the interaction of environment and genotype on the health and development of children. The study investigators invited all pregnant women in the geographically defined area of Avon, southwest En-gland, with an expected date of deliv-ery between April 1, 1991, and Decem-ber 31, 1992, to take part. The study contains data on 14 062 live births, of which 13 988 were still alive at 12 months of age; active contact currently
is maintained with⬃10 000 children.6
Mothers of infants in the ALSPAC were broadly representative of the rest of the United Kingdom at the 1991 census. Further details of study recruitment, retention, and data collection have been described previously.6
Data have been collected on a variety of developmental traits by using face-to-face assessments at special clinics,
parental self-completion
question-naires, and linked education and health records. Data on potential ante-natal and postante-natal confounding fac-tors were collected prospectively from a number of questionnaires.
Participating parents provided in-formed consent for testing sessions, and assent was gained from the chil-dren. Ethical approval for the study was obtained from the ALSPAC Law and Ethics Committee and the local re-search ethics committees.
Measures
Exposure Variable: Probable DCD
Children with probable DCD were de-fined by using the DSM-IV criteria, adapted for research by using the 2006 Leeds Consensus Statement.1,7,8
Chil-dren were defined as having probable DCD if they met all 4 DSM-IV criteria for DCD: poor motor coordination (crite-rion A), which causes functional im-pairment in ADL, or academic achieve-ment (criterion B) not caused by a general medical condition or severe learning difficulties (exclusion criteria C and D).1Full details of the case
defi-nition and the numbers of children at each stage of definition have previ-ously been described.8
Motor skills of children were assessed between 7 and 8 years using the AL-SPAC Coordination Test, which con-sisted of the subtests derived from the Movement Assessment Battery for
Children (MABC).9 The subtests were
selected to test the 3 realms of
coordi-nation: manual dexterity (placing pegs task); ball skills (throwing bean bag into box); and balance (heel-to-toe walking). These motor subtests have been shown to have concurrent valid-ity with other similar coordination tests and represent the 3 domains of coordination using principal compo-nent analysis of original
standardiza-tion data from the MABC.8,10 The 5th
centile of a standardized motor coordi-nation test is generally used to define severe motor impairment; children be-tween the 5th and 15th centile are con-sidered at risk of impairment. We used the 15th centile of the ALSPAC Coordi-nation Test to define children as having or being at risk of coordination difficul-ties in keeping with the MABC manual and previous literature.9,11
Those children below the 15th centile on motor testing were then said to have functional impairment in motor skills if, in addition, they either failed their National Curriculum Key Stage 1 writing test or they were below the 15th centile of a 23-item ADL scale de-rived from parent-completed
question-naires.8 Those children with a known
visual deficit or neurologic condition such as cerebral palsy were excluded,
as were children with an IQ of ⬍70.
Children with an ASD diagnosis, identi-fied from linked education and health records, were not excluded as recom-mended by the Leeds Consensus
State-ment.7 However, secondary analyses
excluding these children were per-formed. The multistage definition used met DSM-IV criteria for DCD. However, because we used the 15th centile, rather than the more conservative 5th centile, of the motor coordination test, we described our population as having probable DCD in keeping with our pre-vious work.8
After excluding children with an IQ of
test or the ADL scale; of these, 346 chil-dren representing 5% of our eligible cohort met criteria for probable DCD.
Outcome Variables
Between the ages of 7 and 9 years, the children of the ALSPAC were assessed by using a number of standardized tests and subtests that were grouped into 4 major domains of develop-ment: (1) attention and hyperactivity; (2) language skills and short-term memory; (3) social skills; and (4) ac-ademic ability.
Inattention and hyperactivity were as-sessed by using the Development and Well-being Assessment (DAWBA) at
91 months of age.12 The DAWBA is
a parent-completed,
questionnaire-based assessment that includes 18 questions relating to the child’s activ-ity and attention.
Speech and language were tested by using items from the oral expres-sion and language comprehenexpres-sion subtests of the Wechsler Objective
Lan-guage Dimensions (WOLD).13
Short-term memory was assessed by using a shortened version of the Children’s Test of Nonword Repetition.14Nonword
repetition has been shown to be strongly associated with language de-velopment and was therefore grouped within this developmental domain.15
The domain of social skills included nonverbal skills and social communi-cation. Nonverbal impairment was as-sessed by using the faces subtest of the Diagnostic Analysis of Nonverbal Accuracy, and social communication abilities were measured by using the Social and Communication Disorders Checklist (SCDC).16,17Measures of
aca-demic ability consisted of reading, as-sessed by using the basic-reading subtest of the Wechsler Objective
Reading Dimensions (WORD),18 and
spelling was assessed by using 15
age-appropriate words developed by
Nunes and Bryant.19All tests were
per-formed by trained observers at face-to-face research clinics, except the DAWBA and the SCDC, which were parent-completed questionnaires.
Possible Confounding or Mediating Factors
Potential confounding factors were se-lected after appraisal of the relevant literature.20Factors were divided into
child and parental/environmentally re-lated confounding factors and added to the model in blocks to assess the effect on any association between
ex-posure and outcome.21
Child-related confounding factors
were gender, birth weight (ⱕ2500 and
⬎2500 g), gestation (⬍37 and ⱖ37
weeks’ gestation), hearing difficulties, and cognitive ability (IQ). Children were defined as having normal hear-ing thresholds if bilateral average air
conduction wasⱖ20 dB on testing. IQ
was measured by using alternate items of the Wechsler Intelligence Scale for Children III at a mean age of
8.7 years.22 For language-based
out-comes, performance IQ was con-trolled. For all other outcome mea-sures, total IQ was controlled. Gender and IQ were tested as potential effect modifiers.
Parental and environmental confound-ing factors were highest maternal ed-ucational attainment (3 categories), highest parental social class (non-manual [I, II, and III non(non-manual], III manual, and IV and V manual), housing tenure of the family in pregnancy (owned or rented), financial difficul-ties in pregnancy (5-point scale de-rived from maternal report of ability to afford food, clothing, heating, ac-commodation, and items for the in-fant), maternal smoking in preg-nancy (ever or never), and antenatal depression and anxiety using the Ed-inburgh Postnatal Depression Scale and Crown–Crisp Experiential Index respectively.23–25
Analysis
Logistic regression models were used to assess the association between the exposure variable probable DCD and each of the 8 developmental traits in turn as outcomes.
All tests apart from the comprehen-sion subtests from the WOLD, the read-ing test of the WORD, and the test of nonword repetition had a skewed dis-tribution even after logarithmic trans-formation. Measures were dichoto-mized by using both the 5th and the 15th centiles to define significant diffi-culties, as done previously.24,26–28
We first looked at the unadjusted asso-ciation between probable DCD and each developmental trait (model 1). Adjustment was then made for all child and parental factors excluding IQ (model 2); model 3 added IQ. For the final model (model 4), adjustment was also made for all the other develop-mental traits not in the domain under investigation. For example, for the out-come variable reading (5th centile), the final model adjusted for all child and parental factors along with all the traits outside the academic ability do-main (ie, inattention and hyperactivity, nonverbal skills, social communica-tion, expressive language, language
comprehension, and short-term
memory).
The number of children in each model differed, because not all children at-tended the various tests and returned questionnaires. To deal with the poten-tial bias introduced by these missing data, we used multiple imputation by chained equations to impute missing data in the confounding factors.29,30
Further details of the multiple impu-tation models are reported in Appen-dix 1.
complete case data set and by remov-ing those children with a known ASD diagnosis. All statistical analyses used Stata 9.2 (Stata Corp, College Station, TX).
RESULTS
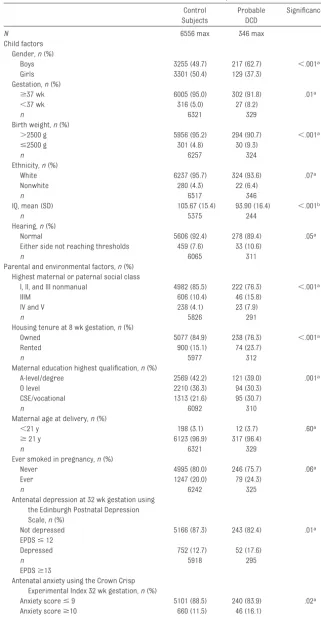
The characteristics of the 346 children with probable DCD compared with our 6556 normally developing control sub-jects are listed in Table 1. As reported previously, children with probable DCD were more likely to be male, have a lower birth weight, and come from a more deprived social background8
(Ta-ble 1, characteristics of those children with probable DCD compared with con-trol subjects).
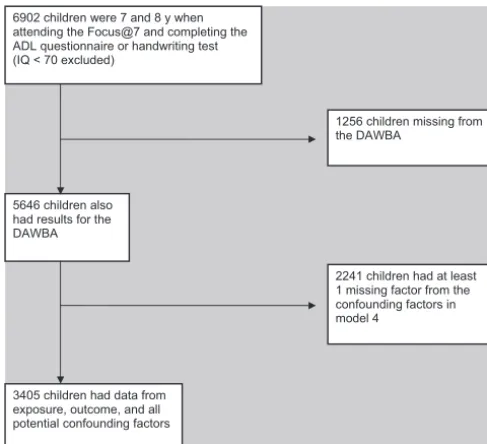
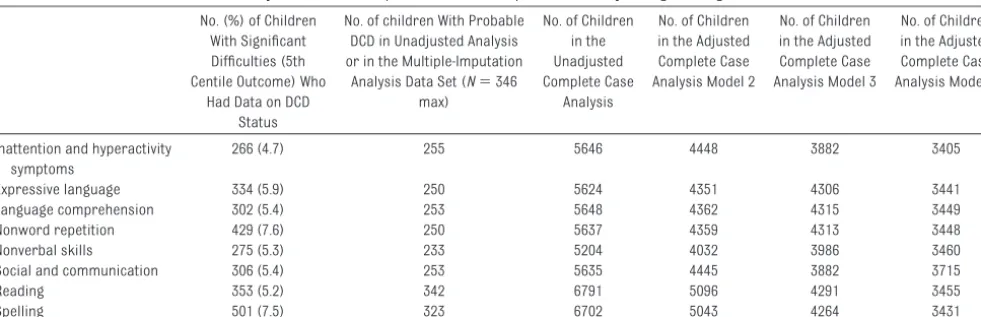
Of a maximum of 6902 children, the number of children who completed de-velopmental outcome tests ranged from 5204 to 6791 (mean: 5863), of which an average of 270 children had probable DCD. In the complete case analysis, the total number of children in the final analysis was additionally reduced when confounding factors were added (illustrated in Fig 1). This was not the case when multiple impu-tation was used, because missing data were accounted for in the confounding factors. Further details on the number of children in each model are presented in Appendix 1 (including Table 6).
The odds ratios (ORs) of having signif-icant difficulties (5th centile) in each developmental trait for children with probable DCD compared with control subjects are presented in Tables 2 and 3, for the complete case set and multi-ple imputation data sets, respectively. Children with probable DCD had signif-icantly increased odds of having diffi-culties in all the developmental do-mains investigated in the unadjusted model (model 1) and after controlling for child and parental factors (model 2). The addition of IQ decreased the ORs, but there still was a significantly increased odds of having difficulties in
TABLE 1 Characteristics of Those Children With Probable DCD Compared to Controls
Control Subjects
Probable DCD
Significance,P
N 6556 max 346 max
Child factors Gender,n(%)
Boys 3255 (49.7) 217 (62.7) ⬍.001a
Girls 3301 (50.4) 129 (37.3)
Gestation,n(%)
ⱖ37 wk 6005 (95.0) 302 (91.8) .01a
⬍37 wk 316 (5.0) 27 (8.2)
n 6321 329
Birth weight,n(%)
⬎2500 g 5956 (95.2) 294 (90.7) ⬍.001a
ⱕ2500 g 301 (4.8) 30 (9.3)
n 6257 324
Ethnicity,n(%)
White 6237 (95.7) 324 (93.6) .07a
Nonwhite 280 (4.3) 22 (6.4)
n 6517 346
IQ, mean (SD) 105.67 (15.4) 93.90 (16.4) ⬍.001b
n 5375 244
Hearing,n(%)
Normal 5606 (92.4) 278 (89.4) .05a
Either side not reaching thresholds 459 (7.6) 33 (10.6)
n 6065 311
Parental and environmental factors,n(%) Highest maternal or paternal social class
I, II, and III nonmanual 4982 (85.5) 222 (76.3) ⬍.001a
IIIM 606 (10.4) 46 (15.8)
IV and V 238 (4.1) 23 (7.9)
n 5826 291
Housing tenure at 8 wk gestation,n(%)
Owned 5077 (84.9) 238 (76.3) ⬍.001a
Rented 900 (15.1) 74 (23.7)
n 5977 312
Maternal education highest qualification,n(%)
A-level/degree 2569 (42.2) 121 (39.0) .001a
O level 2210 (36.3) 94 (30.3)
CSE/vocational 1313 (21.6) 95 (30.7)
n 6092 310
Maternal age at delivery,n(%)
⬍21 y 198 (3.1) 12 (3.7) .60a
ⱖ21 y 6123 (96.9) 317 (96.4)
n 6321 329
Ever smoked in pregnancy,n(%)
Never 4995 (80.0) 246 (75.7) .06a
Ever 1247 (20.0) 79 (24.3)
n 6242 325
Antenatal depression at 32 wk gestation using the Edinburgh Postnatal Depression Scale,n(%)
Not depressed 5166 (87.3) 243 (82.4) .01a
EPDSⱕ12
Depressed 752 (12.7) 52 (17.6)
n 5918 295
EPDSⱖ13
Antenatal anxiety using the Crown Crisp Experimental Index 32 wk gestation,n(%)
Anxiety scoreⱕ9 5101 (88.5) 240 (83.9) .02a
Anxiety scoreⱖ10 660 (11.5) 46 (16.1)
n 5761 286
each domain for those children in the probable-DCD group. Model 4, when using both the multiple imputation and complete case data sets, showed a persistent strong association between probable DCD and difficulties in inat-tention/hyperactivity, nonword repeti-tion, reading, and spelling after adjust-ment for the other traits outside the domain under investigation and an in-creased risk of difficulties in nonver-bal skills and social communication only in the multiple-imputation model. The differences seen between the com-plete case and imputed data sets can be attributed to potential bias intro-duced by missing data, because model 4 of the complete case data
set had ⬎2000 fewer children than
the unadjusted imputed model for each analysis.
6902 children were 7 and 8 y when attending the Focus@7 and completing the ADL questionnaire or handwriting test (IQ < 70 excluded)
5646 children also had results for the DAWBA
2241 children had at least 1 missing factor from the confounding factors in model 4
3405 children had data from exposure, outcome, and all potential confounding factors
1256 children missing from the DAWBA
FIGURE 1
Number of children in the final analysis for inattention and hyperactivity symptoms measured by using the DAWBA.
TABLE 2 ORs (95% CIs) of Significant Difficulties in Developmental Traits (Using the 5th Centile Cutoff) for Children With Probable DCD Compared With Control Subjects by Using the Complete Case Data Set
Model 1, Unadjusted OR
(95% CI)
P Model 2, OR (95% CI)
P Model 3, OR (95% CI)
P Model 4, OR (95% CI)
P
Inattention or hyperactivity (n⫽5646 max) 4.40 (3.07–6.30) ⬍.001 5.22 (3.41–7.97) ⬍.001 4.07 (2.45–6.73) ⬍.001 2.73 (1.34–5.59) .006 Expressive language (n⫽5624 max) 3.18 (2.22–4.57) ⬍.001 2.74 (1.74–4.33) ⬍.001 1.83 (1.13–2.97) .013 1.09 (0.56–2.14) .790 Language comprehension (n⫽5648 max) 2.43 (1.62–3.64) ⬍.001 1.95 (1.14–3.31) .014 1.50 (0.86–2.60) .153 0.83 (0.39–1.79) .636 Nonword repetition (n⫽5637 max) 3.68 (2.68–5.07) ⬍.001 2.78 (1.81–4.27) ⬍.001 2.37 (1.53–3.66) ⬍.001 1.83 (1.06–3.16) .031 Nonverbal skills (n⫽5204 max) 3.22 (2.18–4.76) ⬍.001 2.93 (1.77–4.84) ⬍.001 1.89 (1.11–3.23) .020 1.40 (0.73–2.68) .313 Social and communication (n⫽5635 max) 4.24 (3.01–6.0) ⬍.001 4.33 (2.84–6.59) ⬍.001 3.29 (1.98–5.48) ⬍.001 1.74 (0.89–3.40) .105 Reading (n⫽6791 max) 10.12 (7.77–13.19) ⬍.001 7.56 (5.24–10.91) ⬍.001 4.04 (2.43–6.70) ⬍.001 4.13 (2.25–7.59) ⬍.001 Spelling (n⫽6702 max) 6.91 (5.36–8.93) ⬍.001 4.97 (3.52–7.02) ⬍.001 2.65 (1.70–4.13) ⬍.001 2.18 (1.28–3.74) .004
Model 2 controlled for child factors (gender, age at which test was performed, birth weight, gestation, and hearing) and parental factors (maternal education, housing tenure in pregnancy,
highest parental social class, financial difficulties score, antenatal maternal smoking, antenatal depression, and antenatal anxiety). Model 3 controlled for all the confounding factors in model 2⫹total IQ or performance IQ for language based skills (ie, WOLD, nonword repetition). Model 4 controlled for all confounding factors as in model 3⫹all other developmental traits
not in that developmental domain being tested.
TABLE 3 ORs (95% CIs) of Significant Difficulties in Developmental Traits (Using the 5th Centile Cutoff) for Children With Probable DCD Compared With Control Subjects by Using the Multiple-Imputation Data Set
Model 1, Unadjusted OR
(95% CI)
P Model 2, OR (95% CI)
P Model 3, OR (95% CI)
P Model 4, OR (95% CI)
P
Inattention or hyperactivity (n⫽5646) 4.40 (3.07–6.30) ⬍.001 4.04 (2.78–5.86) ⬍.001 3.18 (2.16–4.69) ⬍.001 1.94 (1.17–3.24) .011 Expressive language (n⫽5624) 3.18 (2.22–4.57) ⬍.001 2.94 (2.02–4.27) ⬍.001 2.02 (1.37–2.98) ⬍.001 1.36 (0.88–2.09) .165 Language comprehension (n⫽5648) 2.43 (1.62–3.64) ⬍.001 2.27 (1.49–3.44) ⬍.001 1.84 (1.20–2.82) .005 1.31 (0.82–2.08) .254 Nonword repetition (n⫽5637) 3.68 (2.68–5.07) ⬍.001 3.46 (2.49–4.82) ⬍.001 2.84 (2.03–3.98) ⬍.001 1.83 (1.26–2.66) .002 Nonverbal skills (n⫽5204) 3.22 (2.18–4.76) ⬍.001 3.08 (2.06–4.60) ⬍.001 2.03 (1.34–3.09) .001 1.58 (1.01–2.48) .044 Social and Communication (n⫽5635) 4.24(3.01–6.0) ⬍.001 3.85 (2.70–5.50) ⬍.001 3.31 (2.29–4.79) ⬍.001 1.87 (1.15–3.04) .012 Reading (n⫽6791) 10.12 (7.77–13.19 ⬍.001 8.71 (6.54–11.61) ⬍.001 4.61 (3.32–6.39) ⬍.001 3.35 (2.36–4.77) ⬍.001 Spelling (n⫽6702) 6.91 (5.36–8.93) ⬍.001 5.88 (4.47–7.72) ⬍.001 3.44 (2.53–4.68) ⬍.001 2.81 (2.03–3.90) ⬍.001
Model 2 controlled for child factors (gender, age at which test was performed, birth weight, gestation, and hearing) and parental factors (maternal education, housing tenure in pregnancy, highest parental social class, financial difficulties score, antenatal maternal smoking, antenatal depression, and antenatal anxiety). Model 3 controlled for all the confounding factors in
The association between probable DCD and the test of nonword repetition pre-sented in Tables 2 and 3 did not control for expressive language or compre-hension. An additional analysis con-trolling for these variables in the multiple-imputation model 4 did not weaken the association of probable DCD and nonword repetition (OR: 1.76 [95% confidence interval (CI): 1.21–2.58]).
None of the likelihood ratio tests for an interaction effect between IQ and prob-able DCD were significant at the 5% level. Results of further exploratory analysis suggested a significant inter-active effect between gender and prob-able DCD for reading difficulties (5th centile cutoff) in model 3 (Pinteraction⫽
.01) and model 4 (P ⫽ .01).
Strata-specific odds according to gender showed that both genders had an
in-creased risk of reading difficulties, but girls had a higher risk than boys (Table 4).
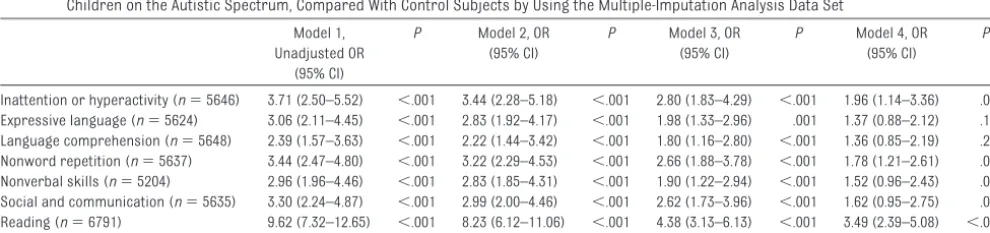
Of the original 346 children with prob-able DCD, 19 were on the autistic spec-trum as compared with 15 control chil-dren. Results of sensitivity analysis excluding these children showed simi-lar results to those obtained with these children included (Table 5). The OR for difficulties with nonverbal skills and social communication decreased after exclusion of those children with ASD, from 1.58 (95% CI: 1.01–2.48) to 1.52 (95% CI: 0.96 –2.43) for nonverbal skills and from 1.87 (95% CI: 1.15–3.04) to 1.62 (95% CI: 0.95–2.75) for social communication skills. For comparison, the ORs of having difficulties in each trait at the 15th centile are presented in Appendices 2 and 3; these showed similar results.
DISCUSSION
Using a large, prospective cohort study, we have shown that, after accounting for potential confounding factors, children with probable DCD have an increased risk of other common developmental dif-ficulties. Our findings build on the exist-ing evidence based on selected samples.
Previous longitudinal work used
teacher-completed questionnaires to screen children for attention, speech and language, and motor difficulties, which makes the results of these studies difficult to interpret in terms of comor-bidity across developmental domains.31–33
Kaplan et al34and Dewey et al35showed
significant overlap between DCD,
attention-deficit/hyperactivity disorder, and learning difficulties in a sample re-cruited from clinics, special schools, and resource classrooms. We, in contrast, used a population-based sample without the use of an initial screening question-naire, which reduced potential referral bias.36 The prospective nature of data
collection in the ALSPAC allowed for appropriate controlling of potential confounding factors, which previous
population-based studies have not
done.5,37,38We also attempted to minimize
the potential bias of missing data by using multiple imputation by chained equations.30
Our case definition of probable DCD used a multistep approach that incor-TABLE 4 Gender-Specific ORs (95% CIs) of Reading Difficulty (5th Centile) in the Complete Case and
Multiple-Imputation Analyses
Complete Case Analysis Model 3 P Model 4 P
Probable DCD
Boys 2.84 (1.58–5.11) ⬍.001 2.67 (1.32–5.42) .006
Girls 11.73 (4.67–29.49) ⬍.001 15.25 (5.19–44.79) ⬍.001 Multiple-imputation analysis
probable DCD
Boys 3.35 (2.26–4.97) ⬍.001 2.25 (1.45–3.49) ⬍.001
Girls 9.62 (5.48–16.87) ⬍.001 7.45 (4.07–13.62) ⬍.001
Model 3 controlled for child factors (gender, age at which test was performed, birth weight, and gestation hearing) and parental factors (maternal education, housing tenure in pregnancy, highest parental social class, financial difficulties
score, antenatal maternal smoking, antenatal depression, and antenatal anxiety)⫹IQ (total) or IQ performance controlled for language-based skills (WOLD, nonword repetition) as a continuous variable. Model 4⫹other developmental traits not
in that developmental domain.
TABLE 5 ORs (95% CIs) of Significant Difficulties in Developmental Traits (Using the 5th Centile Cutoff) for Children With Probable DCD Excluding Those Children on the Autistic Spectrum, Compared With Control Subjects by Using the Multiple-Imputation Analysis Data Set
Model 1, Unadjusted OR
(95% CI)
P Model 2, OR (95% CI)
P Model 3, OR (95% CI)
P Model 4, OR (95% CI)
P
Inattention or hyperactivity (n⫽5646) 3.71 (2.50–5.52) ⬍.001 3.44 (2.28–5.18) ⬍.001 2.80 (1.83–4.29) ⬍.001 1.96 (1.14–3.36) .015 Expressive language (n⫽5624) 3.06 (2.11–4.45) ⬍.001 2.83 (1.92–4.17) ⬍.001 1.98 (1.33–2.96) .001 1.37 (0.88–2.12) .159 Language comprehension (n⫽5648) 2.39 (1.57–3.63) ⬍.001 2.22 (1.44–3.42) ⬍.001 1.80 (1.16–2.80) ⬍.001 1.36 (0.85–2.19) .200 Nonword repetition (n⫽5637) 3.44 (2.47–4.80) ⬍.001 3.22 (2.29–4.53) ⬍.001 2.66 (1.88–3.78) ⬍.001 1.78 (1.21–2.61) .003 Nonverbal skills (n⫽5204) 2.96 (1.96–4.46) ⬍.001 2.83 (1.85–4.31) ⬍.001 1.90 (1.22–2.94) ⬍.001 1.52 (0.96–2.43) .077 Social and communication (n⫽5635) 3.30 (2.24–4.87) ⬍.001 2.99 (2.00–4.46) ⬍.001 2.62 (1.73–3.96) ⬍.001 1.62 (0.95–2.75) .075 Reading (n⫽6791) 9.62 (7.32–12.65) ⬍.001 8.23 (6.12–11.06) ⬍.001 4.38 (3.13–6.13) ⬍.001 3.49 (2.39–5.08) ⬍.001 Spelling (n⫽6702) 6.53 (5.02–8.49) ⬍.001 5.59 (4.22–7.41) ⬍.001 3.30 (2.42–4.50) ⬍.001 2.77 (1.99–3.85) ⬍.001
Model 2 controlled for child factors (gender, age at which test was performed, birth weight, gestation, and hearing) and parental factors (maternal education, housing tenure in pregnancy, highest parental social class, financial difficulties score, antenatal maternal smoking, antenatal depression, and antenatal anxiety). Model 3 controlled for all the confounding factors in
porated both poor motor coordination and impairment in ADL or handwriting.
We considered handwriting as a
marker of academic ability, as recom-mended in the Leeds Consensus State-ment, as opposed to reading and spell-ing, which were defined as outcome
variables in our analysis.7Children did
not have a medical examination as part of their ALSPAC assessment, but we linked ALSPAC-unique identifiers with clinical records and IQ tests to
ex-clude those children with known neu-rologic, chromosomal, and severe
vi-sual difficulties or an IQ of ⬍70. We
were able to consider the independent
association between motor function-ing and each developmental trait, in turn, after controlling for difficulties outside that domain of interest, effec-tively excluding (controlling for)
chil-dren with attention difficulties and so-cial communication difficulties when considering reading skills and vice versa.
In 1966, Clements39proposed the term
minimal brain dysfunction in refer-ence to children of normal intelligrefer-ence
who display “various combinations of impairment in perception, conceptual-ization, language, memory, attention,
or motor function.”40 The
minimal-brain-dysfunction concept has been
criticized as being overinclusive; many studies have identified clusters of symptoms but no overarching syn-drome.40 In 1982, Gillberg et al31
de-scribed the overlap between attention, motor, and perceptual deficits. The ALSPAC data support the strong non-causal association between probable DCD and inattention proposed by
Gill-berg et al but also provide evidence for a broader association, because chil-dren with probable DCD showed in-creased risk of significant problems
with reading, spelling, social, and non-verbal skills, irrespective of hyperac-tivity and inattention.41The strong
as-sociation between probable DCD and reading (which was especially appar-ent in girls) has potappar-ential implications for educational interventions, and ad-ditional research is needed in this area by using more comprehensive reading tests.
The neurobiology of DCD is complex, and different mechanisms have been proposed to explain the motor deficit seen in DCD and the association with other developmental difficulties. The overlap between DCD and attention-deficit/hyperactivity disorder has been supported by results of a recent twin study that pointed to a potential shared genetic etiology.42Fawcett and
Nicholson43 demonstrated impaired
motor control in children with dyslexia and highlighted the potential role of lobules VI and VIIB in the neocerebel-lum to explain these difficulties in
adults.44We documented a strong
as-sociation between probable DCD and reading skills as well as with other de-velopmental difficulties that are hard to explain by a localized deficit in the cerebellum.
There is increasing evidence for a shared genetic etiology of develop-mental conditions, with specific inter-est in the role of downstream gene tar-gets to which proteins bind. In the case of the FOXP2 protein, these down-stream genes have a wide array of functions including neural growth, synaptic plasticity, and
neurotrans-mission.45 Others have hypothesized
that children with DCD and
attention-deficit/hyperactivity disorder share a genetically determined
distur-bance in the dopamine pathway.46,47
Dopamine is thought to be the key neu-rotransmitter in many developmental pathways, including motor planning, working memory, cognitive flexibility, language, reasoning, and sequencing; however, to date, no study has directly examined specific neurotransmitters in children with DCD.48
In summary, the complex difficulties experienced by children with DCD can best be understood by using a dynamic
neuroconstructivist approach in
which genetic, neurologic, and envi-ronmental factors interact multidirec-tionally.49 Future work in the field of
genetic epidemiology may help us un-derstand the neurobiology of this com-mon developmental condition.
For clinicians, although it is desirable to diagnose and accurately classify de-velopmental conditions in which the major impairment is in 1 domain, our results show that many children’s dif-ficulties do not fit into discrete diag-nostic categories. What is needed to inform appropriate interventions is a careful documentation of the child’s strengths and difficulties and an accu-rate formulation of the individuals’ complex multidimensional needs.
CONCLUSIONS
We have shown that children with probable DCD have an increased risk of wide-ranging difficulties outside the motor domain. This has important clin-ical implications for the assessment and management of children with DCD, especially relating to their educational needs. These associations need to be explored in greater depth to under-stand their biological basis, the impli-cations for intervention, and the long-term outcomes for children with DCD.
APPENDIX 1: REPORTING OF MISSING DATA MODEL
The number of children in the
confounding factors and was equal to number of children in the unadjusted complete case analysis.
Multiple-imputation models were used to create data sets to allow for missing data only in the confounding factors. Multiple imputation by chained equa-tions was performed by using the “ICE” command in Stata 9.2. Twenty sepa-rate, stacked data sets were created for the final analysis, which used the MIM command in Stata.
The imputation was done twice, once for model 3 and again for model 4, for each of the outcome variables. For model 3, variables included in the mul-tiple imputation model included all those variables in the final regression model (model 3) plus variables that predicted missingness in the con-founders. Within the ALSPAC, we know that socioeconomic factors affect loss to follow-up. It has been shown that children from lower socioeconomic groups were less likely to attend for assessment than children from more affluent, well-educated families.8
Variables that predicted missingness in the confounding factors were as-sessed by using logistic regression. The following factors were selected for exploration if they were associated
with missingness: family income; age of the mother (binary older or younger than 21 years); use of hot water in the household; index of crowding (ordered categorical variable); parity (3 catego-ries: first infant, second child, or ⱖ3 children); ever used drugs; maternal special-needs schooling; temperature of the house in winter; postnatal de-pression; or anxiety.
Of these factors, family income, age of the mother, use of hot water in the household, crowding, and parity were associated with being missing in the
data set (P ⬍ .01); these variables
were included in the final multiple-imputation model.
In addition, for the multiple-imputation model 4, all the developmental traits were added to create the imputed data set. Binary variables and categorical variables used logistic, ordinal, and multinomial regression, as appropri-ate, specified in the ICE command. IQ was normally distributed and incorpo-rated using linear regression in the imputation model. A significant inter-active effect between gender and prob-able DCD was found for reading in model 3 (Pinteraction⫽.01) and model 4 (Pinteraction ⫽.01). An interaction term,
gender ⫻probable DCD, was
incorpo-rated into the imputation model for this outcome. Strata-specific odds according to gender are presented in Table 4.
The wealth of prospectively collected data in the ALSPAC allows the analysis to not only account for confounding factors but also account for factors that help to explain missingness, thus supporting the “missing-at-random” assumption.
ACKNOWLEDGMENTS
The United Kingdom Medical Research Council, the Wellcome Trust, and the
University of Bristol currently provide core support for the ALSPAC. Dr Lingam is funded by a Personal Award
Scheme Researcher Development
Award from the National Institute for Health Research. This publication is the work of the authors, and Dr Lingam will serve as guarantor for the con-tents of this article.
We are grateful to all the families who took part in this study, the mid-wives for their help in recruiting them, and the whole ALSPAC team, which includes interviewers,
com-puter and laboratory technicians, clerical workers, research scien-tists, volunteers, managers, recep-tionists and nurses.
TABLE 6 Number of Children in the Unadjusted Model Compared With the Complete Case Analysis Logistic Regression Models 2, 3, and 4
No. (%) of Children With Significant Difficulties (5th Centile Outcome) Who
Had Data on DCD Status
No. of children With Probable DCD in Unadjusted Analysis or in the Multiple-Imputation
Analysis Data Set (N⫽346 max)
No. of Children in the Unadjusted Complete Case
Analysis
No. of Children in the Adjusted Complete Case Analysis Model 2
No. of Children in the Adjusted Complete Case Analysis Model 3
No. of Children in the Adjusted Complete Case Analysis Model 4
Inattention and hyperactivity symptoms
266 (4.7) 255 5646 4448 3882 3405
Expressive language 334 (5.9) 250 5624 4351 4306 3441
Language comprehension 302 (5.4) 253 5648 4362 4315 3449
Nonword repetition 429 (7.6) 250 5637 4359 4313 3448
Nonverbal skills 275 (5.3) 233 5204 4032 3986 3460
Social and communication 306 (5.4) 253 5635 4445 3882 3715
Reading 353 (5.2) 342 6791 5096 4291 3455
REFERENCES
1. American Psychiatric Association. Diagnos-tic and StatisDiagnos-tical Manual of Mental Disor-ders, 4th Edition, Text Revision. Washington, DC: American Psychiatric Association; 2000
2. Kaplan BJ, Dewey DM, Crawford SG, Wilson BN. The term comorbidity is of questionable value in reference to developmental disorders: data and theory.J Learn Disabil. 2001;34(6):555–565
3. Hill EL. Non-specific nature of specific lan-guage impairment: a review of the litera-ture with regard to concomitant motor im-pairments.Int J Lang Commun Disord. 2001; 36(2):149 –171
4. Mari M, Castiello U, Marks D, Marraffa C, Prior M. The reach-to-grasp movement in children with autism spectrum disorder.
Philos Trans R Soc Lond B Biol Sci. 2003; 358(1430):393– 403
5. Kadesjö B, Gillberg C. Developmental coor-dination disorder in Swedish 7-year-old children.J Am Acad Child Adolesc Psychia-try. 1999;38(7):820 – 828
6. Golding J, Pembrey M, Jones R. ALSPAC: the Avon Longitudinal Study of Parents and Children: I. study methodology. Paediatr Perinat Epidemiol. 2001;15(1):74 – 87 7. Sugden DA, Chambers M, Utley A. Leeds
con-sensus statement, 2006. University of Leeds. Available at: www.dcd-uk.org/ consensus.html. Accessed January 3, 2010
8. Lingam R, Hunt L, Golding J, Jongmans M, Emond A. Prevalence of developmental co-ordination disorder using the DSM-IV at 7 years of age: a UK population-based study.
Pediatrics. 2009;123(4):e693– e700. Avail-able at: www.pediatrics.org/cgi/content/ full/123/4/e693
9. Henderson SE, Sugden DA.Movement As-sessment Battery for Children Manual. Sid-cup, United Kingdom: Psychological Corporation; 1992
10. Van Waelvelde H, De Weerdt W, De Cock P, Smits-Engelsman BC. Aspects of the validity of the Movement Assessment Battery for Children.Hum Mov Sci. 2004;23(1):49 – 60 11. Geuze RH, Jongmans MJ, Schoemaker MM,
Smits-Engelsman BCM. Clinical and re-search diagnostic criteria for developmen-tal coordination disorder: a review and dis-cussion.Hum Move Sci. 2001;20(1–2):7– 47 12. Goodman R, Ford T, Richards H, Gatward R,
Meltzer H. The Development and Well-being Assessment: description and initial valida-tion of an integrated assessment of child and adolescent psychopathology.J Child Psychol Psychiatry. 2000;41(5):645– 655 13. Rust J.WOLD Wechsler Objective Language
Dimensions Manual. London, United Kingdom: Psychological Corporation; 1996
14. Gathercole SE, Baddeley AD.The Children’s Test of Nonword Repetition. London, United Kingdom: Psychological Corporation; 1996
15. Gathercole SE, Willis CS, Baddeley AD, Emslie H. The Children’s Test of Nonword Repetition: a test of phonological working memory.Memory. 1994;2(2):103–127 16. Nowicki S, Duke MP. Individual differences
in the nonverbal communication of affect: the Diagnostic Analysis of Nonverbal Accu-racy scale.J Nonverbal Behav. 1994;18(1): 9 –35
17. Skuse DH, Mandy WP, Scourfield J. Measur-ing autistic traits: heritability, reliability and validity of the Social and Communica-tion Disorders Checklist.Br J Psychiatry. 2005;187:568 –572
18. Rust J, Golombok S, Trickey G.WORD Wech-sler Objective Reading Dimensions Manual. Sidcup, United Kingdom: Psychological Corporation; 1993
19. Nunes T, Bryant P, Bindman M. Morphologi-cal spelling strategies: developmental stages and processes.Dev Psychol. 1997; 33(4):637– 649
20. Hernan MA, Hernandez-Diaz S, Werler MM, Mitchell AA. Causal knowledge as a prereq-uisite for confounding evaluation: an appli-cation to birth defects epidemiology.Am J Epidemiol. 2002;155(2):176 –184
21. Greenland S. Modeling and variable selec-tion in epidemiologic analysis.Am J Public Health. 1989;79(3):340 –349
22. Weschsler D, Golombok S, Rust J.WISC-IIIUK
Wechsler Intelligence Scale for Children: UK Manual. 3rd ed. Sidcup, United Kingdom: Psychological Corporation; 1992
23. Murray L, Carothers AD. The validation of the Edinburgh Post-natal Depression Scale on a community sample.Br J Psychiatry. 1990;157:288 –290
24. Deave T, Heron J, Evans J, Emond A. The im-pact of maternal depression in pregnancy on early child development.BJOG. 2008; 115(8):1043–1051
25. Birtchnell J, Evans C, Kennard J. The total score of the Crown-Crisp Experiential Index: a useful and valid measure of psychoneu-rotic pathology.Br J Med Psychol. 1988; 61(pt 3):255–266
26. Rutter M, Caspi A, Fergusson D, et al. Sex differences in developmental reading disability: new findings from 4 epidemiolog-ical studies.JAMA. 2004;291(16):2007–2012 27. Paracchini S, Steer CD, Buckingham LL, et al. Association of the KIAA0319 dyslexia
sus-ceptibility gene with reading skills in the general population.Am J Psychiatry. 2008; 165(12):1576 –1584
28. Joinson C, Heron J, von Gontard A. Psycho-logical problems in children with daytime wetting.Pediatrics. 2006;118(5):1985–1993 29. Ambler G, Omar RZ, Royston P. A comparison of imputation techniques for handling miss-ing predictor values in a risk model with a binary outcome. Stat Methods Med Res. 2007;16(3):277–298
30. Sterne JA, White IR, Carlin JB, et al. Multiple imputation for missing data in epidemiolog-ical and clinepidemiolog-ical research: potential and pit-falls.BMJ. 2009;338:b2393
31. Gillberg C, Rasmussen P. Perceptual, motor and attentional deficits in seven-year-old children: background factors. Dev Med Child Neurol. 1982;24(6):752–770
32. Gillberg C, Rasmussen P, Carlstrom G, Sven-son B, Waldenstrom E. Perceptual, motor and attentional deficits in six-year-old children: epidemiological aspects.J Child Psychol Psychiatry. 1982;23(2):131–144 33. Rydelius PA. DAMP and MBD versus AD/HD
and hyperkinetic disorders.Acta Paediatr. 2000;89(3):266 –268
34. Kaplan BJ, Wilson BN, Dewey D, Crawford SG. DCD may not be a discrete disorder.Hum Mov Sci. 1998;17(4 –5):471– 490
35. Dewey D, Kaplan BJ, Crawford SG, Wilson BN. Developmental coordination disorder: As-sociated problems in attention, learning and psychological adjustment. Human Movement Science. 2002;21(5– 6):905–918 36. Caron C, Rutter M. Comorbidity in child
psychopathology: concepts, issues and re-search strategies.J Child Psychol Psychia-try. 1991;32(7):1063–1080
37. Tseng MH, Howe TH, Chuang IC, Hsieh CL. Cooccurrence of problems in activity level, attention, psychosocial adjustment, read-ing and writread-ing in children with develop-mental coordination disorder.Int J Rehabil Res. 2007;30(4):327–332
38. Landgren M, Pettersson R, Kjellman B, G i l l b e r g C . A D H D , D A M P a n d o t h e r neurodevelopmental/psychiatric disorders in 6-year-old children: epidemiology and co-morbidity. Dev Med Child Neurol. 1996; 38(10):891–906
39. Clements SD.Minimal Brain Dysfunction in Children: Terminology and Identification. Washington, DC: US Public Health Service; 1966:9 –10
41. Gillberg C. Deficits in attention, motor con-trol, and perception.Arch Dis Child. 2003; 88(10):904 –910
42. Martin NC, Piek JP, Hay D. DCD and ADHD: a genetic study of their shared aetiology.Hum Mov Sci. 2006;25(1):110 –124
43. Fawcett AJ, Nicolson RI. Performance of dys-lexic children on cerebellar and cognitive tests.J Mot Behav. 1999;31(1):68 –78 44. Nicolson RI, Fawcett AJ, Berry EL, Jenkins IH,
Dean P, Brooks DJ. Association of abnormal
cerebellar activation with motor learning difficulties in dyslexic adults.Lancet. 1999; 353(9165):1662–1667
45. Teramitsu I, White SA. Motor learning: the FoxP2 puzzle piece. Curr Biol. 2008;18(8): R335–R337
46. Fliers E, Rommelse N, Vermeulen SH, et al. Motor coordination problems in children and adolescents with ADHD rated by par-ents and teachers: effects of age and gen-der.J Neural Transm. 2008;115(2):211–220
47. Flouris AD, Faught BE, Hay J, Cairney J. Exploring the origins of developmental disorders.Dev Med Child Neurol. 2005; 47(7):436
48. Previc FH. Dopamine and the origins of hu-man intelligence.Brain Cogn. 1999;41(3): 299 –350
49. Karmiloff-Smith A. Nativism versus neuro-constructivism: rethinking the study of de-velopmental disorders.Dev Psychol. 2009; 45(1):56 – 63
APPENDIX 2 ORs (95% CIs) of Significant Difficulties in Developmental Traits (Using the 15th Centile Cutoff) for Children With Probable DCD Compared With Control Subjects by Using the Complete Case Data Set
Model 1, Unadjusted OR
(95% CI)
P Model 2, OR (95% CI)
P Model 3, OR (95% CI)
P Model 4, OR (95% CI)
P
Any severe inattention or hyperactivity symptoms (n⫽5665 max)
3.37 (2.57–4.43) ⬍.001 3.01 (2.16–4.18) ⬍.001 2.27 (1.54–3.34) ⬍.001 1.68 (1.05–2.69) .030
Expressive language (n⫽5624 max) 2.96 (2.22–3.93) ⬍.001 2.91 (2.04–4.16) ⬍.001 2.08 (1.43–3.02) ⬍.001 1.38 (0.87–2.17) .167 Language comprehension (n⫽5648 max) 2.33 (1.72–3.15) ⬍.001 1.95 (1.33–2.88) .001 1.56 (1.05–2.33) .028 1.43 (0.90–2.26) .130 Short-term memory (n⫽5637 max) 2.87 (2.18–3.78) ⬍.001 2.33 (1.63–3.32) ⬍.001 1.96 (1.37–2.82)a ⬍.001 1.54 (1.0–2.35) .048 Nonverbal skills (n⫽5204 max) 2.86 (2.14–3.83) ⬍.001 2.68 (1.86–3.86) ⬍.001 2.07 (1.42–3.03) ⬍.001 1.79 (1.17–2.75) .008 Social communication skills (n⫽5635 max) 2.82 (2.11–3.77) ⬍.001 2.74 (1.93–3.89) ⬍.001 2.12 (1.41–3.20) ⬍.001 1.49 (0.91–2.44) .111 Reading (n⫽6791 max) 6.41 (5.13–8.02) ⬍.001 4.75 (3.57–6.33) ⬍.001 2.59 (1.79–3.75) ⬍.001 1.96 (1.26–3.04) .003 Spelling (n⫽6702 max) 6.31 (5.01–7.94) ⬍.001 4.74 (3.53–6.38) ⬍.001 2.37 (1.62–3.46) ⬍.001 2.16 (1.39–3.34) .001
aInteraction term probable DCD and IQ (P⫽.03).
Model 2 controlled for child factors (gender, age when test performed, birth weight, gestation and hearing) and parental factors (maternal education, housing tenure in pregnancy, highest
parental social class, financial difficulties score, antenatal maternal smoking, antenatal depression and antenatal anxiety). Model 3 controlled for all the confounding factors in model 2⫹ total IQ or performance IQ for language based skills (ie, WOLD, nonword repetition). Model 4 controlled for all confounding factors as in model 3⫹all other developmental traits not in that
developmental domain being tested.
APPENDIX 3 ORs (95% CIs) of Significant Difficulties in Developmental Traits (Using the 15th Centile Cutoff) for Children With Probable DCD Compared With Control Subjects by Using the Multiple-Imputation Data Set
Model 1, Unadjusted OR
(95% CI)
P Model 2, OR (95% CI)
P Model 3, OR (95% CI)
P Model 4, OR (95% CI)
P
Any severe inattention or hyperactivity symptoms (n⫽5665)
3.37 (2.57–4.43) ⬍.001 3.09 (2.33–4.09) ⬍.001 2.72 (2.04–3.62) ⬍.001 1.88 (1.34–2.63) ⬍.001
Expressive language (n⫽5624) 2.96 (2.22–3.93) ⬍.001 2.70 (2.00–3.64) ⬍.001 1.92 (1.41–2.62) ⬍.001 1.26 (0.90–1.76) .17 Language comprehension (n⫽5648) 2.33 (1.72–3.15) ⬍.001 2.19 (1.60–2.99) ⬍.001 1.76 (1.28–2.42) .001 1.36 (0.97–1.90) .07 Short-term memory (n⫽5637) 2.87 (2.18–3.78) ⬍.001 2.70 (2.03–3.59) ⬍.001 2.24 (1.68–2.30) ⬍.001 1.43 (1.04–1.95) .026 Nonverbal skills (n⫽5204) 2.86 (2.14–3.83) ⬍.001 2.72 (2.02–3.66) ⬍.001 2.10 (1.55–2.86) ⬍.001 1.85 (1.34–2.54) ⬍.001 Social communication skills (n⫽5635) 2.82 (2.11–3.77) ⬍.001 2.64 (1.96–3.56) ⬍.001 2.34 (1.72–3.18) ⬍.001 1.38 (0.96–1.97) .081 Reading (n⫽6791) 6.41 (5.13–8.02) ⬍.001 5.74 (4.53–7.27) ⬍.001 3.60 (2.76–4.71) ⬍.001 2.93 (2.19–3.90) ⬍.001 Spelling (n⫽6702) 6.31 (5.01–7.94) ⬍.001 5.51 (4.31–7.04) ⬍.001 3.50 (2.67–4.59) ⬍.001 2.85 (2.14–3.81) ⬍.001
Model 2 controlled for child factors (gender, age when test performed, birth weight, gestation and hearing) and parental factors (maternal education, housing tenure in pregnancy, highest parental social class, financial difficulties score, antenatal maternal smoking, antenatal depression and antenatal anxiety). Model 3 controlled for all the confounding factors in model 2⫹
DOI: 10.1542/peds.2009-2789 originally published online October 18, 2010;
2010;126;e1109
Pediatrics
Alan Emond
Services
Updated Information &
http://pediatrics.aappublications.org/content/126/5/e1109 including high resolution figures, can be found at:
References
http://pediatrics.aappublications.org/content/126/5/e1109#BIBL This article cites 41 articles, 6 of which you can access for free at:
Subspecialty Collections
al_issues_sub
http://www.aappublications.org/cgi/collection/development:behavior
Developmental/Behavioral Pediatrics
following collection(s):
This article, along with others on similar topics, appears in the
Permissions & Licensing
http://www.aappublications.org/site/misc/Permissions.xhtml in its entirety can be found online at:
Information about reproducing this article in parts (figures, tables) or
Reprints
DOI: 10.1542/peds.2009-2789 originally published online October 18, 2010;
2010;126;e1109
Pediatrics
Alan Emond
Raghu Lingam, Jean Golding, Marian J. Jongmans, Linda P. Hunt, Matthew Ellis and
Developmental Traits
The Association Between Developmental Coordination Disorder and Other
http://pediatrics.aappublications.org/content/126/5/e1109
located on the World Wide Web at:
The online version of this article, along with updated information and services, is
by the American Academy of Pediatrics. All rights reserved. Print ISSN: 1073-0397.