Variability in Antibiotic Use at Children’s Hospitals
WHAT’S KNOWN ON THIS SUBJECT: National organizations recommend the implementation of antimicrobial stewardship programs (ASPs) to help facilitate the judicious use of antibiotics within hospitals. Establishing guidelines for an ASP relies on the comparison of use across equivalent institutions to identify high-impact targets for improvement.
WHAT THIS STUDY ADDS: Both the quantity and type of antibiotic-prescribing ranged broadly across US children’s hospitals. These data will help establish benchmarks for the judicious use of antibiotics within children’s hospitals and help target research to identify reasons for such variability.
abstract
BACKGROUND:Variation in medical practice has identified opportuni-ties for quality improvement in patient care. The degree of variation in the use of antibiotics in children’s hospitals is unknown.
METHODS:We conducted a retrospective cohort study of 556 692 con-secutive pediatric inpatient discharges from 40 freestanding chil-dren’s hospitals between January 1, 2008, and December 31, 2008. We used the Pediatric Health Information System to acquire data on anti-biotic use and clinical diagnoses.
RESULTS:Overall, 60% of the children received at least 1 antibiotic agent during their hospitalization, including⬎90% of patients who had surgery, underwent central venous catheter placement, had prolonged ventilation, or remained in the hospital for⬎14 days. Even after adjust-ment for both hospital- and patient-level demographic and clinical characteristics, antibiotic use varied substantially across hospitals, including both the proportion of children exposed to antibiotics (38%– 72%) and the number of days children received antibiotics (368 – 601 antibiotic-days per 1000 patient-days). In general, hospitals that used more antibiotics also used a higher proportion of broad-spectrum antibiotics.
CONCLUSIONS:Children’s hospitals vary substantially in their use of antibiotics to a degree unexplained by patient- or hospital-level factors typically associated with the need for antibiotic therapy, which reveals an opportunity to improve the use of these drugs.Pediatrics2010;126: 1067–1073
AUTHORS:Jeffrey S. Gerber, MD, PhD,a,bJason G.
Newland, MD,cSusan E. Coffin, MD, MPH,a,b,dMatt Hall,
PhD,eCary Thurm, PhD,ePriya A. Prasad, MPH,aChris
Feudtner, MD, PhD, MPH,b,d,fand Theoklis E. Zaoutis, MD,
MSCEa,b,d
Divisions ofaInfectious DiseasesfGeneral Pediatrics, and the bCenter for Pediatric Clinical Effectiveness, Children’s Hospital of Philadelphia, Philadelphia, Pennsylvania;dCenter for Clinical Epidemiology and Biostatistics, University of Pennsylvania School of Medicine, Philadelphia, Pennsylvania;cDivision of Infectious Diseases, Children’s Mercy Hospital, Kansas City, Missouri; andeChild Health Corporation of America, Shawnee Mission, Kansas
KEY WORDS
antimicrobials, children, hospital, variability
ABBREVIATIONS
PHIS—Pediatric Health Information System CMI—case-mix index
ICD-9—International Classification of Diseases, Ninth Revision DOT—days of therapy
www.pediatrics.org/cgi/doi/10.1542/peds.2010-1275
doi:10.1542/peds.2010-1275
Accepted for publication Aug 13, 2010
Address correspondence to Jeffrey S. Gerber, MD, PhD, Division of Infectious Diseases, Children’s Hospital of Philadelphia, CHOP North, Suite 1518, Philadelphia, PA 19104. E-mail: gerberj@email. chop.edu
PEDIATRICS (ISSN Numbers: Print, 0031-4005; Online, 1098-4275).
Copyright © 2010 by the American Academy of Pediatrics
FINANCIAL DISCLOSURE:The authors have indicated they have no financial relationships relevant to this article to disclose.
Funded by the National Institutes of Health (NIH).
temic antibiotic agents, is a major pub-lic health and patient safety issue. Most hospitalized patients receive an-tibiotics,1– 4and roughly one-half of all
antibiotic use is unnecessary.5
Antibi-otic overuse promotes the emergence and expansion of antibiotic-resistant organisms,5,6and infections caused by
resistant pathogens have a significant impact on patient morbidity and mor-tality,7–9with an estimated cost of $4
billion to $5 billion annually.10In
addi-tion, the range and frequency of ad-verse drug effects caused by antibiotic use have been well documented.11–17
Professional guidelines strongly rec-ommend the judicious use of antibiot-ics to prevent the emergence and transmission of multidrug-resistant organisms.6In addition, the Infectious
Diseases Society of America has urged action to combat the epidemic of antibiotic-resistant infections and has published guidelines for developing in-stitutional programs to enhance anti-microbial stewardship.5,18 Supported
by many professional organizations, including the Pediatric Infectious Dis-eases Society, the primary goal of these guidelines is to optimize clinical outcomes and reduce the drug toxicity and antimicrobial resistance associ-ated with the excessive use of these agents.5
Establishing specific prescribing benchmarks to guide antimicrobial stewardship programs for hospital-ized children relies on the comparison of use across equivalent institutions to identify high-impact targets for im-provement. To begin this process, we constructed a large, geographically di-verse cohort to describe the variability in antibiotic use in US children’s hospi-tals. The results of our analyses will help identify high-impact targets for focused efforts to optimize use of these agents in children.
Study Design and Data Source
We conducted a retrospective cohort study of pediatric inpatients using the Pediatric Health Information System (PHIS), an administrative database managed by the Child Health Corpora-tion of America that contains inpatient data from ⬎40 freestanding US chil-dren’s hospitals. We included all pa-tients discharged from the 40 PHIS hospitals that contributed pharmacy data between January 1, 2008, and De-cember 31, 2008. The PHIS database contains detailed information for each patient hospitalization, including de-mographics, diagnoses, medications, procedures, and laboratory tests. Member hospitals represent 17 of the 20 major metropolitan areas across the United States, with only 1 chil-dren’s hospital representing each city. On the basis of estimates from the National Association of Children’s Hos-pitals and Related Institutions (Alexan-dria, VA), 70% of freestanding pediat-ric acute care hospital admissions in the United States is reported in the PHIS database.
Data quality and reliability are assured through a joint effort between Child Health Corporation of America, a data manager (Thomson-Reuters, Durham, NC), and participating hospitals. PHIS data are deidentified at the time of submission (before data extraction and analysis) and are accepted into the database only when classified er-rors occur in fewer than 2% of a hos-pital’s quarterly data. During the study, 100% of drug use data from all hospitals that submit resource use data was included.
Independent Variables
Institution-level variables included geo-graphic location, average daily census, and number of staffed beds. Patient-level variables identified for each hospital admission included age (0 –29 days,
Hispanic white, non-Hispanic black, His-panic, Asian, and other), and discharge disposition. Resource use data included length of hospital stay and case-mix in-dex (CMI), a widely used surrogate for severity of illness and risk of mortality. CMI in PHIS is based on all patient-refined diagnosis-related group catego-ries and severity levels and is calculated by Thomson-Reuters as the ratio of the average charge for patients in a particu-lar all patient-refined diagnosis-related group category/severity level combina-tion to the average charge for all pa-tients who use their national pediatric database. Mechanical ventilation status (yes/no), ventilation days (0, 1–3, 4 –18,
⬎18), and ICU stay (yes/no) were based on charge data.
International Classification of Diseases, Ninth Revision(ICD-9) diagnosis or pro-cedure codes were used to identify the occurrence of infection (defined by the presence or absence of any code(s) for microbial, fungal, viral, or parasitic in-fections), surgery (yes/no), and central-line catheter placement (yes/no). The presence of concurrent chronic ill-nesses was assessed by using an estab-lished and validated method for charac-terizing ICD-9-based pediatric complex chronic conditions, represented by 9 cat-egories: neuromuscular, cardiovascu-lar, respiratory, renal, gastrointestinal, hematologic or immunologic, metabolic, malignancy, and genetic or other con-genital defect conditions, described by Feudtner et al.19
Dependent Variables
moxifloxa-cin, gatifloxacin), and linezolid to be “broad-spectrum” agents. Although clas-sifying antibiotics by breadth of activity is inherently subjective and, conse-quently, reasonably debated, our intent was to identify drugs most commonly used to empirically treat critically ill pa-tients, or those used for the targeted or empiric therapy of antibiotic-resistant infections. Dependent variables included receipt of any systemic antibiotic agent or broad-spectrum antibiotic agent (yes/ no) and the number of days the patient received any antibiotic agent or broad-spectrum antibiotic agent.
Statistical Analysis
Categorical variables were summa-rized using frequencies and percents for all patients included in the study, including (1) the proportion of pa-tients in each group who received any antibiotics and (2) the proportion of antibiotic orders that were broad-spectrum (as defined above). Adjusted hospital-specific use rates (the per-centage of patients who received anti-biotic agents or per 1000 patient-days) were calculated using generalized linear mixed effects models, control-ling for hospital clustering and allow-ing for the presence of correlated data (within hospitals), nonconstant vari-ability (across hospitals), and re-sponses that are not normally distrib-uted. Quasi-likelihood estimation for proportions with unknown distribu-tions was used to model the duration of antibiotic use, defined as the pro-portion of total days of an admission that a patient received antibiotic ther-apy, for all patients and for only those patients who received antibiotic agents. Proportional use and 95% con-fidence intervals are reported by hos-pital. Discharge level resource use was controlled for by use of length of stay as an independent variable.
SAS 9.1 (SAS Institute, Inc, Cary, NC) was used for all analyses, andP⬍.001
was considered statistically signifi-cant because of the large sample sizes used to conduct the analysis.
RESULTS
A total of 556 692 discharges from 40 children’s hospitals from January 1, 2008, through December 31, 2008, were analyzed. Hospital characteris-tics including census region, average daily census, and number of beds are summarized in Table 1. The demo-graphic and clinical characteristics of these children and the hospitals from which they were discharged, as well as the proportion of children with each of these characteristics who were given antibiotics, are displayed in Table 2.
Unadjusted analyses revealed that 60% of hospitalized children received at least 1 dose of an antibiotic, and, on average, antibiotics were given for 468 per 1000 patient-days. Antibiotics were ordered for at least 90% of patients who had surgery, underwent central venous catheter placement, had pro-longed ventilation, or remained in the hospital for⬎14 days. Of children who received antibiotics, broad-spectrum agents were chosen more often in those who stayed in the ICU, received prolonged ventilation, underwent cen-tral venous catheter placement, had a longer length of stay, or received care in an institution with a higher CMI (Table 2).
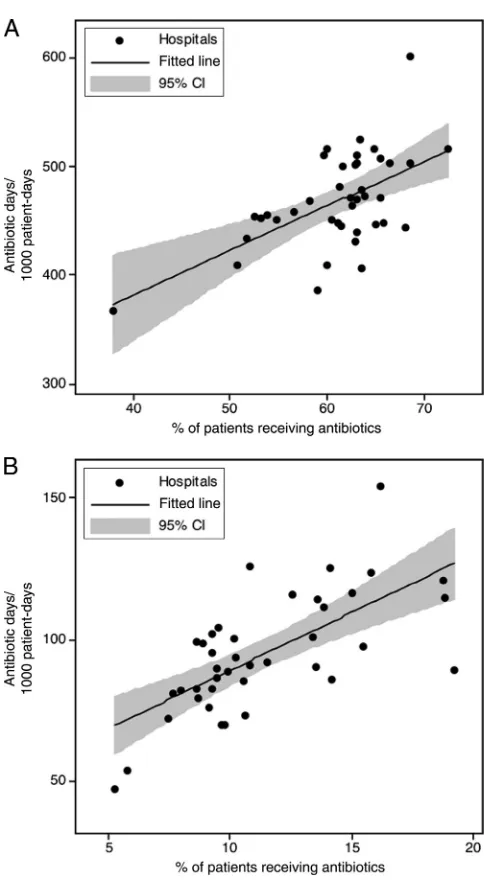
To compare use across hospitals, we adjusted for the patient-level and hospital-level characteristics listed in Table 2. After adjusting for these fac-tors, significant variability in antibiotic use remained. To illustrate this, we used 2 different measures of adjusted antibiotic use. First, considering the proportion of children who were pre-scribed an antibiotic at any point dur-ing their hospitalization, the adjusted institutional rate of antibiotic use was calculated (overall use). As illustrated in Fig 1A (x-axis), adjusted use ranged from 38% to 72% of admissions. By this measure, children admitted to the highest-using quartile of hospitals were, on average, 27% more likely to receive an antibiotic than those admit-ted to the bottom quartile of hospitals, and children admitted to the highest-using 10% of hospitals were, on aver-age, 44% more likely to receive an an-tibiotic than those admitted to the lowest-using 10% of hospitals.
Second, accounting for the same patient-level and hospital-level vari-ables, we calculated the adjusted days of antibiotic exposure in children (Fig 1A, y-axis). Using this metric, adjusted use ranged from 368 to 601 per 1000 patient-days. By this measure, children admitted to the highest-using quartile of hospitals were 25% more likely to receive an antibiotic than those admit-ted to the bottom quartile of hospitals, and children admitted to the highest-using 10% of hospitals were 37% more likely to receive an antibiotic than those admitted to the lowest-using 10% of hospitals. Examining the rela-tionship between overall use and days of therapy revealed a positive correla-tion between these 2 metrics; thus, in general, hospitals that exposed more individual patients to antibiotics also exposed their patients to more days of therapy (Fig 1A;P⬍.001).
To further explore the differences in an-tibiotic use across institutions, we re-TABLE 1 Hospital Characteristics
No. (%) of Hospitals (N⫽40) Census region
Northeast 5 (12.5)
South 15 (37.5)
North central 11 (27.5)
West 9 (22.5)
Average daily census
⬍150 10 (25.0)
150–200 17 (42.5)
⬎200 13 (32.5)
No. of beds
⬍200 9 (22.5)
200–300 22 (55.0)
⬎300 9 (22.5)
peated these adjusted analyses consid-ering exposure to broad-spectrum antibiotic agents (as a subset of children exposed to antibiotics). As illustrated in Fig 1B, variation in the use of
broad-spectrum antibiotics mirrored that seen with overall antibiotic use, as measured by both overall use and days of therapy. As was the case when con-sidering all antibiotic classes, the
rela-otics again revealed a positive correla-tion between these 2 metrics (Fig 1B; P ⬍ .001). In addition, there was a positive correlation between the pro-portion of children prescribed any an-tibiotics and the proportion given broad-spectrum agents (P ⫽ .017), which indicates that, in general, insti-tutions that prescribe more antibiotics also used more broad-spectrum anti-biotics (inconsistent with the notion that more overall antibiotic exposure was compensated for by the preferred use of narrow-spectrum therapy). Al-though all patient and clinical vari-ables listed in Table 2 were adjusted for in these analyses, the standardized
coefficients derived from these ad-justments revealed that performance of a surgical procedure (0.32), pres-ence of an infection code (0.32), and hospital CMI (0.18) were most influen-tial; all other standardized  values wereⱕ0.7.
DISCUSSION
To our knowledge, this study is the first to compare antibiotic use across chil-dren’s hospitals. We found that 60% of hospitalized children are prescribed at least 1 antibiotic, and that antibiot-ics were given for an average of 468 of 1000 inpatient-days. When examined by hospital, however, significant vari-ability in antibiotic use becomes ap-parent: after extensive adjustment for both patient and hospital level charac-teristics, children at some institutions were 44% more likely to receive antibi-otics or, using an alternative metric, were exposed to antibiotics for 37% more days when compared with other institutions.
Although outpatient antibiotic-prescribing has been relatively well characterized,20–25
the data that describes inpatient anti-biotic use are limited. Antianti-biotic use has been measured among networks
Descriptor Overall,n(%) Received Any Antibiotic,n(%)
Received Broad-Spectrum Antibiotics,n(%)
Total 556 692 (100) 336 088 (60.4) 70 037 (20.8)
Infection diagnosis 208 268 (37.4) 162 256 (77.9) 46 730 (28.8) ICU stay 104 728 (18.8) 81 599 (77.9) 27 825 (34.1) Female 249 979 (44.9) 152 207 (60.9) 31 202 (20.5) Surgical status 143 294 (25.7) 128 644 (89.8) 27 015 (21) Central-line catheter 41 844 (7.5) 39 431 (94.2) 20 386 (51.7) Non-Hispanic white 265 595 (49) 159 038 (59.9) 35 147 (22.1) Non-Hispanic black 115 027 (21.2) 65 707 (57.1) 12 222 (18.6) Hispanic 104 113 (19.2) 66 719 (64.1) 13 611 (20.4)
Asian 13 405 (2.5) 8053 (60.1) 1667 (20.7)
Other 43 679 (8.1) 26 944 (61.7) 5470 (20.3)
Ventilation
0 d 533 351 (95.8) 315 099 (59.1) 60 499 (19.2)
1–3 d 13 059 (2.3) 11 137 (85.3) 3876 (34.8)
4–18 d 8075 (1.5) 7668 (95.0) 3949 (51.5)
⬎19 d 2207 (0.4) 2184 (99.0) 1795 (82.2)
Disposition
Home 527 623 (95) 31 4217 (59.6) 60 015 (19.1)
Died 4513 (0.8) 3997 (88.6) 2666 (66.7)
Other 23 168 (4.2) 17 266 (74.5) 7131 (41.3)
Complex chronic conditions diagnoses
Neurologic 49 046 (8.8) 32 143 (65.5) 10 543 (32.8) Cardiovascular 49 531 (8.9) 36 525 (73.7) 12 711 (34.8) Respiratory 15 702 (2.8) 11 526 (73.4) 4495 (39)
Renal 9274 (1.7) 8013 (86.4) 1827 (22.8)
Gastrointestinal 11 473 (2.1) 8616 (75.1) 2947 (34.2)
Metabolic 9364 (1.7) 6333 (67.6) 2831 (44.7)
Hematologic/immunologic 8613 (1.5) 5513 (64.0) 2145 (38.9) Malignancy 44 849 (8.1) 33 062 (73.7) 12 365 (37.4) Congenital/genetic 25 355 (4.6) 19 412 (76.6) 5416 (27.9) Length of stay
1–2 d 194 643 (35) 86 435 (44.4) 7174 (8.3)
3–7 d 269 811 (48.5) 171 273 (63.5) 27 575 (16.1)
8–14 d 51 252 (9.2) 41 030 (80.1) 13 950 (34)
⬎14 d 40 986 (7.4) 37 350 (91.1) 21 140 (56.6)
Age group
0–29 d 120 044 (21.6) 68 167 (56.8) 16 019 (23.5) 30 d–364 d 62 008 (11.1) 39 541 (63.8) 7987 (20.2)
1–4 y 98 726 (17.7) 59 695 (60.5) 11 641 (19.5)
5–11 y 145 259 (26.1) 89 572 (61.7) 18 273 (20.4) 12–17 y 130 655 (23.5) 79 113 (60.6) 15 506 (19.6) Census region
Northeast 69 230 (12.4) 43 442 (62.8) 10 122 (23.3) South 218 457 (39.2) 132 246 (60.5) 26 846 (20.3) North central 157 805 (28.3) 92 380 (58.5) 18 199 (19.7)
West 111 200 (20) 68 020 (61.2) 14 828 (21.8)
CMI
Low 99 525 (17.9) 30 384 (30.5) 1914 (6.3)
Moderately low 165 430 (29.7) 88 580 (53.5) 10 984 (12.4) Moderately high 149 834 (26.9) 94 295 (62.9) 14 710 (15.6)
of hospitals, including Centers for Dis-ease Control and Prevention initiatives such as the National Nosocomial Infec-tion Surveillance System26and Project
Intensive Care Antimicrobial Resis-tance Epidemiology;27 however, these
programs analyzed exclusively ICU ad-missions and a relatively small propor-tion of children. In addipropor-tion, antibiotic use in these reports is quantified as “defined daily doses” per 1000 patient-days, a metric unsuitable for children because children’s medications are
dosed on the basis of weight. More re-cently, the number of days of therapy (DOT) has been proposed as an alter-native measure of antimicrobial use that may allow more appropriate com-parisons of antimicrobial use between adults and children.1Adopting this
ap-proach, investigators found that 60% of hospitalized adults received at least 1 dose of antibiotic therapy and that inpatients received an average of 776 per 1000 patient-days of therapy. Com-paring use across these hospitals in a
subsequent analysis, the same group reported that the proportion of inpa-tients who received at least 1 dose of an antibiotic agent during their hospi-talization demonstrated a range across hospitals of 44.4% to 73.6%, whereas the mean total rate of antibi-otic use ranged between 454 and 1153 per 1000 patient-days (multiple antibi-otics on the same day each count indi-vidually as 1 DOT, which allows the to-tal DOT numerator to exceed 1000).2
Again, however, these studies analyzed adult patients without subset analyses of children.
Only 2 studies have focused exclusively on antibiotic use in hospitalized chil-dren. A point prevalence survey, which included only ICU patients, identified that⬃71% of NICU patients and 43% of PICU patients were receiving antibiot-ics at the time of the survey.28The
au-thors of the lone pediatric-specific study of all hospitalized children (not confined to the ICU) described dis-charges from 20 academic hospitals throughout the United States.29 This
study identified a mean of 33% of chil-dren as exposed to at least 1 antibiotic during their hospitalization and⬃550 DOT per 1000 patient-days. These aca-demic hospitals, however, served pri-marily adult patients and, after exclud-ing adults from the analysis, there were 30-fold fewer children per year than were included in our study of 40 freestanding children’s hospitals. In addition, the analysis did not compare antibiotic use between institutions.
The striking variability in antibiotic use revealed by our analysis persisted de-spite adjustment for patient charac-teristics associated with an increased need for antibiotic therapy or prophy-laxis (infection diagnosis, surgical pro-cedures, ICU stay, ventilator days, and underlying chronic conditions) as well as for hospital characteristics (sum-marized by the CMI), suggestive of an institution that may provide more ad-FIGURE 1
Adjusted antibiotic use per 1000 patient-days versus any use during a hospitalization. A, All antibiotics; B, broad-spectrum antibiotics.
empiric or targeted antibiotic therapy. In addition, our analysis included children who were admitted to exclu-sively freestanding children’s hospi-tals throughout an entire year, repre-senting a relatively homogeneous group of centers with respect to the need and expertise available for the treatment of infectious diseases. In ad-dition, hospitals that exposed a higher proportion of patients to antibiotics also used more days of therapy, a relationship inconsistent with the no-tion that instituno-tions at which more patients are exposed to antibiotics use these drugs for shorter periods of time, or vice versa. Also, hospitals that used more antibiotics, measured ei-ther by overall use or days of ei-therapy, tended to (aggregately) use more vancomycin, cefepime, piperacillin/ta-zobactam, ticarcillin/clavulanate, car-bapenems, fluoroquinolones, and lin-ezolid as a proportion of total antibiotic use than did lower-using centers, negating the possibility that antibiotic quantity was generally offset by limiting patient exposure to these broad-spectrum drugs (and the asso-ciated increased antibiotic resistance pressure and cost).
Although it is unclear what factors spe-cifically drove increased antibiotic use within higher-using hospitals, variabil-ity was apparent in both the percent-age of children who received an antibi-otic agent at any time during their hospitalization as well as in total days of antibiotics received. Thus, either a lower threshold to institute treatment with antibiotics or a longer length of therapy for a given condition (or both) could have contributed. Notably, many
for infection. Although some of these patients may have received appropri-ate surgical prophylaxis, variability in the threshold to begin (or continue) antibiotics for conditions ultimately not diagnosed as infectious could ac-count for this phenomenon.
Although not surprising, such pro-found variability in antibiotic use is troubling. If variability remains after normalizing for differences in illness severity and patient complexity, it fol-lows that either children at some hos-pitals are undertreated with antibiot-ics and, therefore, are unnecessarily at risk of treatment failure or, the more likely alternative, that some hos-pitalized children receive excessive antibiotic therapy and therefore are unnecessarily at risk of developing antibiotic-resistant infections and drug-related adverse effects while in-curring inappropriate hospital costs. In addition to highlighting the need to establish effective antibiotic steward-ship programs in children’s hospitals, a setting in which there remains con-siderable opportunity for improve-ment,30 these data provide further
impetus to perform comparative effec-tiveness studies to determine the ap-propriate therapy, particularly with re-spect to duration of antibiotic therapy, for common pediatric infections.31
More detailed analyses of these data to identify specific agents and indica-tions associated with the greatest vari-ability will provide high-impact targets for improvement.
Our study has limitations. The PHIS da-tabase offers the unique advantage of detailed, national-level, pediatric data from the majority of US metropolitan
provides more diagnosis data per pa-tient than most administrative data sets. This database, however, may not be generalizable to nontertiary care, freestanding children’s hospitals. For example, because of referral bias, PHIS
may overrepresent the true incidence of some medically complicated or se-vere infections. Also, administrative data sources such as PHIS are limited with specific regard to the possibility of miscoded or inaccurate informa-tion. Although generally specific, iden-tification based on ICD-9 Clinical Modi-fication may not have ideal sensitivity. In this study, however, we did not rely heavily on ICD-9-based coding, includ-ing the dependent and the majority of
independent variables, and the use of ICD-9 codes to identify chronic complex conditions has been validated.19In
ad-dition, all data benefited from an es-tablished mechanism of validity and reliability checks performed by the data vendor. Antibiotic use data are de-rived from antibiotic orders; there-fore, any drugs that were ordered and not administered to children would misclassify those children with re-spect to antibiotic use.
CONCLUSIONS
We found that the majority of pa-tients admitted to children’s hospitals
were exposed to antibiotics. Individual hospitals varied significantly, how-ever, in their use of antibiotic agents. Establishing benchmarks for antibi-otic use will help to inform hospital and public policy aimed to treat chil-dren with known or presumed infec-tions judiciously.
REFERENCES
1. Polk RE, Fox C, Mahoney A, Letcavage J, MacDougall C. Measurement of adult an-tibacterial drug use in 130 US hospitals: comparison of defined daily dose and
days of therapy. Clin Infect Dis. 2007; 44(5):664 – 670
2. MacDougall C, Polk RE. Variability in rates of use of antibacterials among 130 US
hospi-tals and risk-adjustment models for inter-hospital comparison.Infect Control Hosp Epidemiol. 2008;29(3):203–211
Edmond M, Polk RE. Diversity of antimicro-bial use and resistance in 42 hospitals in the United States.Pharmacotherapy. 2008; 28(7):906 –912
4. Pakyz AL, MacDougall C, Oinonen M, Polk RE. Trends in antibacterial use in US academic health centers: 2002 to 2006.Arch Intern Med. 2008;168(20):2254 –2260
5. Dellit TH, Owens RC, McGowan JE Jr, et al. Infectious Diseases Society of America and the Society for Healthcare Epidemiology of America guidelines for developing an insti-tutional program to enhance antimicrobial stewardship.Clin Infect Dis. 2007;44(2): 159 –177
6. Shlaes DM, Gerding DN, John JF Jr, et al. Society for Healthcare Epidemiology of America and Infectious Diseases Society of America Joint Committee on the Prevention of Antimicrobial Resistance: guidelines for the prevention of antimicrobial resistance in hospitals.Clin Infect Dis. 1997;25(3): 584 –599
7. Paterson DL. “Collateral damage” from cephalosporin or quinolone antibiotic ther-apy. Clin Infect Dis. 2004;38(suppl 4): S341–S345
8. Cosgrove SE. The relationship between antimicrobial resistance and patient outcomes: mortality, length of hospital stay, and health care costs.Clin Infect Dis. 2006; 42(suppl 2):S82–S89
9. Macgowan AP. Clinical implications of anti-microbial resistance for therapy.J Antimi-crob Chemother. 2008;62 (suppl 2): ii105–ii114
10. Medicine Io, ed.Antimicrobial Resistance: Issues and Options. Washington, DC: Na-tional Academy Press; 1988
11. Bartlett JG. Clinical practice: antibiotic-associated diarrhea.N Engl J Med. 2002; 346(5):334 –339
12. Bartlett JG. Narrative review: the new epi-demic ofClostridium difficile-associated en-teric disease.Ann Intern Med. 2006;145(10): 758 –764
13. Park-Wyllie LY, Juurlink DN, Kopp A, et al. Outpatient gatifloxacin therapy and dysgly-cemia in older adults.N Engl J Med. 2006; 354(13):1352–1361
14. Gholami K, Parsa S, Shalviri G, Sharifzadeh M, Assasi N. Anti-infectives-induced adverse drug reactions in hospitalized patients. Pharmacoepidemiol Drug Saf. 2005;14(7): 501–506
15. Budnitz DS, Pollock DA, Weidenbach KN, Mendelsohn AB, Schroeder TJ, Annest JL. National surveillance of emergency depart-ment visits for outpatient adverse drug events.JAMA. 2006;296(15):1858 –1866 16. Shehab N, Patel PR, Srinivasan A, Budnitz
DS. Emergency department visits for antibiotic-associated adverse events.Clin Infect Dis. 2008;47(6):735–743
17. Gandhi TK, Weingart SN, Borus J, et al. Ad-verse drug events in ambulatory care.N Engl J Med. 2003;348(16):1556 –1564 18. Spellberg B, Guidos R, Gilbert D, et al. The
epidemic of antibiotic-resistant infections: a call to action for the medical community from the Infectious Diseases Society of America.Clin Infect Dis. 2008;46(2):155–164 19. Feudtner C, Christakis DA, Connell FA. Pedi-atric deaths attributable to complex chronic conditions: a population-based study of Washington State, 1980 –1997. Pe-diatrics. 2000;106(1 pt 2):205–209 20. Nyquist AC, Gonzales R, Steiner JF, Sande
MA. Antibiotic prescribing for children with colds, upper respiratory tract infections, and bronchitis. JAMA. 1998;279(11): 875– 877
21. Finkelstein JA, Metlay JP, Davis RL, Rifas-Shiman SL, Dowell SF, Platt R. Antimicrobial use in defined populations of infants and young children.Arch Pediatr Adolesc Med. 2000;154(4):395– 400
22. Nash DR, Harman J, Wald ER, Kelleher KJ. Antibiotic prescribing by primary care phy-sicians for children with upper respiratory tract infections.Arch Pediatr Adolesc Med. 2002;156(11):1114 –1119
23. McCaig LF, Besser RE, Hughes JM. Trends in antimicrobial prescribing rates for chil-dren and adolescents.JAMA. 2002;287(23): 3096 –3102
24. Steinman MA, Gonzales R, Linder JA, Land-efeld CS. Changing use of antibiotics in community-based outpatient practice, 1991–1999.Ann Intern Med. 2003;138(7): 525–533
25. Grijalva CG, Nuorti JP, Griffin MR. Antibiotic prescription rates for acute respiratory tract infections in US ambulatory settings. JAMA. 2009;302(7):758 –766
26. National Nosocomial Infections Surveil-lance (NNIS) System Report, data summary from January 1992 through June 2004, is-sued October 2004.Am J Infect Control. 2004;32(8):470 – 485
27. Fridkin SK, Steward CD, Edwards JR, et al. Surveillance of antimicrobial use and anti-microbial resistance in United States hospitals: project ICARE phase 2. Project In-tensive Care Antimicrobial Resistance Epi-demiology (ICARE) hospitals.Clin Infect Dis. 1999;29(2):245–252
28. Grohskopf LA, Huskins WC, Sinkowitz-Cochran RL, Levine GL, Goldmann DA, Jarvis WR. Use of antimicrobial agents in United States neonatal and pediatric intensive care patients. Pediatr Infect Dis J. 2005;24(9):766 –773
29. Pakyz AL, Gurgle HE, Ibrahim OM, Oinonen MJ, Polk RE. Trends in antibacterial use in hospitalized pediatric patients in United States academic health centers.Infect Con-trol Hosp Epidemiol. 2009;30(6):600 – 603 30. Hersh AL, Beekmann SE, Polgreen PM,
Zaou-tis TE, Newland JG. Antimicrobial steward-ship programs in pediatrics.Infect Control Hosp Epidemiol. 2009;30(12):1211–1217 31. Rice LB. The Maxwell Finland Lecture: for the
duration-rational antibiotic administration in an era of antimicrobial resistance and Clostridium difficile.Clin Infect Dis. 2008; 46(4):491– 496
DOI: 10.1542/peds.2010-1275 originally published online November 15, 2010;
2010;126;1067
Pediatrics
A. Prasad, Chris Feudtner and Theoklis E. Zaoutis
Services
Updated Information &
http://pediatrics.aappublications.org/content/126/6/1067
including high resolution figures, can be found at:
References
http://pediatrics.aappublications.org/content/126/6/1067#BIBL
This article cites 30 articles, 0 of which you can access for free at:
Subspecialty Collections
http://www.aappublications.org/cgi/collection/therapeutics_sub
Therapeutics
http://www.aappublications.org/cgi/collection/pharmacology_sub
Pharmacology
http://www.aappublications.org/cgi/collection/hospital_medicine_sub
Hospital Medicine
following collection(s):
This article, along with others on similar topics, appears in the
Permissions & Licensing
http://www.aappublications.org/site/misc/Permissions.xhtml
in its entirety can be found online at:
Information about reproducing this article in parts (figures, tables) or
Reprints
http://www.aappublications.org/site/misc/reprints.xhtml
DOI: 10.1542/peds.2010-1275 originally published online November 15, 2010;
2010;126;1067
Pediatrics
A. Prasad, Chris Feudtner and Theoklis E. Zaoutis
Jeffrey S. Gerber, Jason G. Newland, Susan E. Coffin, Matt Hall, Cary Thurm, Priya
Variability in Antibiotic Use at Children's Hospitals
http://pediatrics.aappublications.org/content/126/6/1067
located on the World Wide Web at:
The online version of this article, along with updated information and services, is
by the American Academy of Pediatrics. All rights reserved. Print ISSN: 1073-0397.