IMPURITY PROFILING OF TOLVAPTAN TABLETS USING NEW STABILITY INDICATING UPLC METHOD
5
0
0
Full text
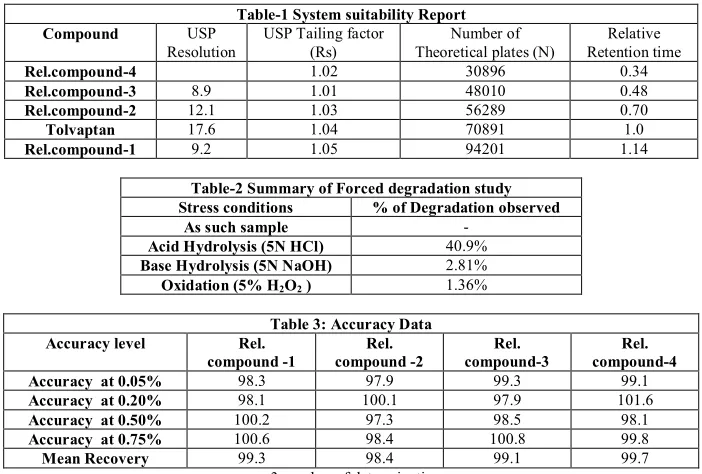
(2) Lanka A. Rama Prasad et al. IRJP 2012, 3 (11) Specificity Specificity is the ability to assess unequivocally the analyte in the presence of components which may be expected to be present. Typically these might include impurities, degradants, matrix, etc. Specificity was tested by injecting the sample by spiking with appropriate levels of impurities and demonstrating the separation of these impurities individually and/or from other components in the sample matrix. Moreover, identification of each impurity was confirmed with relative retention times as compared with those of pure standards. Forced degradation studies Forced degradation studies were performed to provide an indication of the stability indicating property and specificity of the proposed method. Intentional degradation was attempted to stress conditions like thermal degradation (at 105° C), acid hydrolysis (using 5N HCl), base hydrolysis (using 5N NaOH), and oxidative degradation (using 5% H2O2) to evaluate the ability of the proposed method to separate degradation products from each other and active ingredients as well. To check and ensure the homogeneity (peak purity) of Tolvaptan peak in the stressed sample solutions, photo diode array detector was employed. Precision The precision of the related substance method was checked by injecting six individual sample preparations of (500µg/ml) Tolvaptan spiked with 0.5% of Related compound-1, Related compound, Related compound -3 and Related compound -4 with respect to analyte concentration .%R.S.D. of area for Related compound -1, Related compound -2, Related compound -3 and Related compound -4 was calculated. The intermediate precision of the method was also evaluated using different analyst, different day and different make instrument in the same laboratory. Limit of detection (LOD) and limit of quantification (LOQ) The LOD and LOQ for Related compound -1, Related compound -2, Related compound -3 and Related compound 4 were estimated at a signal-to-noise ratio of 3:1 and 10:1, respectively by injecting a series of diluted solutions with known concentration]. Precision study was also carried at the USP Resolution. Compound Rel.compound-4 Rel.compound-3 Rel.compound-2 Tolvaptan Rel.compound-1. 8.9 12.1 17.6 9.2. LOQ level by injecting six individual preparations of Related compound -1, Related compound -2, Related compound -3 and Related compound -4 and calculating the % R.S.D. of the area. Linearity The linearity of the method was tested in order to demonstrate proportional relationship of response versus analyte concentration over the working range. It is usual practice to perform linearity experiments over a wide range of analyte. This gives confidence that the response and concentration are proportional and consequently ensures that calculations can be performed using a single reference standard/working standard, rather than the equation of a calibration line. The linearity of detector response to different concentrations of impurities was studied by preparing a series of solutions using Tolvaptan and its related impurities at five different concentration levels ranging from 0.05% to 0.75%w/w of test concentration (500µg/mL). The data were subjected to statistical analysis using a linear-regression model. Accuracy The accuracy of the related impurities method for the quantification of all four impurities in formulation samples. The study was carried out in triplicate at 0.05%, 0.1%, 0.2% 0.5% and 0.75% of the analyte concentration (500µg/ml). The % recoveries for Related compound -1, Related compound -2, Related compound -3 and Related compound C were calculated from the slope and Y-intercept of the calibration curve. Robustness To determine the robustness of the developed method, the chromatographic conditions were deliberately altered and the resolution between Tolvaptan and Related compound -1 was evaluated. To study the effect of flow rate on the resolution, the same was altered by 0.1 units, i.e. from 0.50 to 0.70 ml/min. The effect of pH on resolution of impurities was studied by varying ±0.2 pH units (at 2.8 and 3.2 buffer pH). The effect of column temperature on resolution was studied at 25 and 35°C instead of 30°C. All the other mobile phase components were held constant.. Table-1 System suitability Report USP Tailing factor Number of (Rs) Theoretical plates (N) 1.02 30896 1.01 48010 1.03 56289 1.04 70891 1.05 94201. Relative Retention time 0.34 0.48 0.70 1.0 1.14. Table-2 Summary of Forced degradation study Stress conditions % of Degradation observed As such sample 40.9% Acid Hydrolysis (5N HCl) 2.81% Base Hydrolysis (5N NaOH) 1.36% Oxidation (5% H2O2 ). Accuracy level Accuracy at 0.05% Accuracy at 0.20% Accuracy at 0.50% Accuracy at 0.75% Mean Recovery. Table 3: Accuracy Data Rel. Rel. compound -1 compound -2 98.3 97.9 98.1 100.1 97.3 100.2 98.4 100.6 99.3 98.4 n=3 number of determinations. Rel. compound-3 99.3 97.9 98.5 100.8 99.1. Rel. compound-4 99.1 101.6 98.1 99.8 99.7. Page 146.
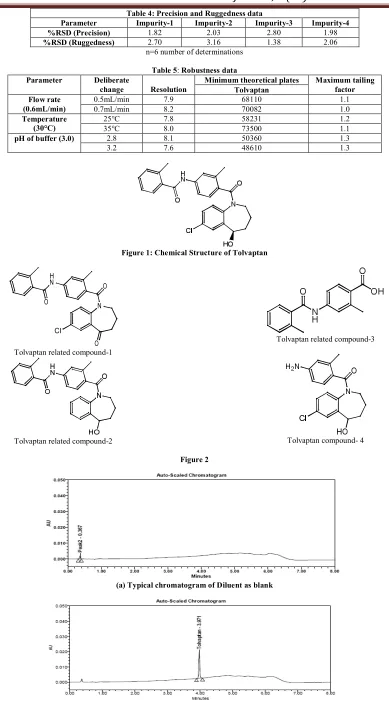
(3) Lanka A. Rama Prasad et al. IRJP 2012, 3 (11) Parameter %RSD (Precision) %RSD (Ruggedness). Parameter Flow rate (0.6mL/min) Temperature (30°C) pH of buffer (3.0). Table 4: Precision and Ruggedness data Impurity-1 Impurity-2 Impurity-3 2.03 2.80 1.82 3.16 1.38 2.70 n=6 number of determinations. Deliberate change 0.5mL/min 0.7mL/min 25°C 35°C 2.8 3.2. Table 5: Robustness data Minimum theoretical plates Resolution Tolvaptan 7.9 68110 8.2 70082 7.8 58231 8.0 73500 8.1 50360 7.6 48610. Impurity-4 1.98 2.06. Maximum tailing factor 1.1 1.0 1.2 1.1 1.3 1.3. Figure 1: Chemical Structure of Tolvaptan H N. O. O. N Cl. Tolvaptan related compound-3. O. Tolvaptan related compound-1. Tolvaptan compound- 4. Tolvaptan related compound-2 Figure 2. (a) Typical chromatogram of Diluent as blank. (b) Typical chromatogram of diluted standard. Page 147.
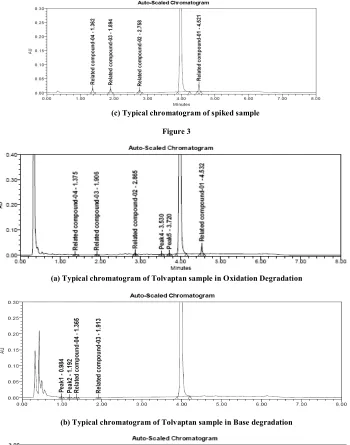
(4) Lanka A. Rama Prasad et al. IRJP 2012, 3 (11). (c) Typical chromatogram of spiked sample Figure 3. (a) Typical chromatogram of Tolvaptan sample in Oxidation Degradation. (b) Typical chromatogram of Tolvaptan sample in Base degradation. (c) Typical chromatogram of Tolvaptan sample in Acid degradation Figure 4. RESULTS AND DISCUSSION Optimization of chromatographic conditions The potential impurities present in bulk samples produced by Hetero Labs, Hyderabad, India. The main target of the chromatographic method is to get the separation of all impurities and degradants generated from analyte peak. Impurities were co-eluted by using different stationary phases like C18 and C8 and different mobile phases containing buffers like diluted ortho phosphoric acid, potassium phosphate and sodium per-chlorate with different pH and using organic modifiers like acetonitrile and methanol in the mobile phase. The elution order and peak shapes of related. compounds are largely dependent on salt concentration and pH. The separation between tolvaptan & related compound 1 was achieved by optimizing gradient programme. Satisfactory chromatographic separation was achieved using a mobile phase mobile phase A consists of 10mM phosphate buffer with pH adjusted to 3.0 with dilute ortho phosphoric acid and acetonitrile in the ratio of (85:15%v/v). The mobile phase B consists of acetonitrile and water (9:1). The UHPLC gradient was set as: T/%B: 0/28, 1.5/40, 3.0/52, 4/76, 5.5/76, 5.8/28 and 8.0/28. In the optimized conditions the Tolvaptan, related compound-1, related compound -2, related compound -3 and related compound-4 were well separated with a Page 148.
(5) Lanka A. Rama Prasad et al. IRJP 2012, 3 (11) resolution of greater than 7.9 and the typical retention times of related compound -1, related compound -2, related compound -3, related compound -4 and Tolvaptan were about 4.5minutes, 2.7minutes, 1.9miutes, 1.3minutes and 4 minutes (Figure 3) respectively. The system suitability results were given in Table 1 and the developed LC method was found to be specific for Tolvaptan and its three impurities, namely related compound -1, related compound -2, related compound -3 and related compound -4. Results of forced degradation studies Tolvaptan tablet dosage form samples were subjected to forced degradation. To identify interference from excipient. Placebo samples were also subjected to similar stress conditions and chromatograms were compared with that of formulation samples. The degradation of active ingredient was observed during oxidative stress, acid and base hydrolysis (Figure 4). Tolvaptan was found to be prone to degradation in acid stress condition when compared to base and oxidative stress conditions. All the degradation products were well separated, homogeneity and purity of all the peaks monitored using PDA detector. The mass balance of stressed samples was close to 98.7% (Table 2). This confirms the stability indicating power of the developed method. Results of method validation experiments Precision The % R.S.D. of area of related compound -1, related compound -2, related compound -3 and related compound-4 in related substance method precision study was within 4% confirming good precision of the method. Limit of detection (LOD) and limit of quantification (LOQ) The limit of detection (LOD) of related compound -1, related compound -2, related compound -3 and related compound -4 were 0.0060%, 0.0033%, 0.042% and 0.0026% (of analyte concentration, i.e. 500µg/ml) for 5µl injection volume. The limit of quantification (LOQ) of related compound -1, related compound -2, related compound -3 and related compound-5 were 0.018%, 0.011%, 0.013 and 0.009% (of analyte concentration, i.e.0.5mg/ml) for 2µl injection volume. The method precision for related compound -1, related compound -2, related compound -3 and related compound -4 at LOQ level was below 5% R.S.D. Linearity Linear calibration plot for related substance method was obtained over the calibration ranges tested, i.e. 0.05% to 0.75% for related compound, related compound -2, related compound -3 and related compound -4. The correlation coefficient obtained was greater than 0.996. The results show that an excellent correlation existed between the peak area and concentration of related compound, related compound -2, related compound -3 and related compound -4.. Accuracy The percentage recovery of related compound -1, related compound -2, related compound -3 and related compound -4 in formulation samples was ranged from 97.3 to 101.6 (Table-3 & 4) HPLC chromatograms of blank, pure sample and all four impurities spiked in Tolvaptan formulation sample were shown in Fig. 3 (Blank, sample, spiked). Robustness In all the deliberate varied chromatographic conditions (flow rate, pH and column temperature) the resolution between tolvaptan and related compound -1 was greater than 7, illustrating the robustness of the method. Stability of Analytical solutions The stability of the standard and sample solutions was tested at regular intervals. The stability of solutions was determined by comparing results with freshly prepared standard solutions. The differences in values were within 0.05% for identified and unidentified impurities and 0.2% for total impurities up to 48hrs. CONCLUSION The validated stability-indicating UPLC method has proved to be rapid, simple, accurate, precise and reliable. The proposed method provides a good resolution between all the related compounds and potential degradants. The behavior of tolvaptan under various stress conditions were studied and presented for the first time. The information presented herein could be very useful for quality monitoring as well as impurity profiling of formulation samples during stability studies. ACKNOWLEDGEMENT The authors would like to thank the management of Hetero Labs Ltd., Hyderabad, India, for their support to carry out this investigation. REFERENCES 1. Hauptman PJ, Zimmer C, Udelson J, Shoaf SE, Mallikaarjun S, Bramer SL, Orlandi C. Comparison of two doses and dosing regimens of tolvaptan in congestive heart failure. J Cardiovasc Pharmacol. 2005 46(5): 609-14. 2. Sojeong Yi, Hyewon Jeon, Seo Hyun Yoon, Joo-Youn Cho, Sang-Goo Shin, In-Jin Jang, Kyung-Sang Yu. Pharmacokinetics and pharmacodynamics of oral tolvaptan administered in 15- to 60-mg single doses to healthy Korean men J Cardiovasc Pharmacol. 2012 59 (4):31522 3. Chaudhari BG, Patel C, Development and Validation of UV Spectrophotometric Method for the Estimation of Tolvaptan in Bulk and Tablet Dosage Form IJPRS, ,2012:1(3): 193-198 4. Chakravarthy VK, Gowrishankar D, Development And Validation of RP-HPLC Method for Estimation of Tolvaptan in Bulk And its Pharmaceutical Formulation, Rasayan J.Chem., 2011, 4(1), 165-171 5. Shoaf SE, Wang Z, Bricmont P, Mallikaarjun S, Effect of grapefruit juice on the pharmacokinetics of tolvaptan, a non-peptide arginine vasopressin antagonist, in healthy subjects J. Clin. Pharmacol. 2007, 47, 1498-1507 6. Validation of Analytical Procedures: Methodology (Q2B), ICH Harmonized Tripartite Guideline. Source of support: Nil, Conflict of interest: None Declared. IRJP is an official publication of Moksha Publishing House. Website: www.mokshaph.com. All rights reserved.. Page 149.
(6)
Figure
Related documents
Second hillslope experiment under steady flow conditions: tracer breakthrough curves for uranine and NaCl at the cut-bank, discharge at the cut-bank, tracer BTCs of uranine and NaCl
Als Kontrollversuch wurde das Trigeminus-Ganglion nach einer Tracerinjektion in die Konjunktiva auf die gleichen Marker untersucht, um zu beurteilen, ob die im
Based on the review of various experimental investigations of stabilized peat, it was found that the unconfined compressive strength gain of the stabilized soil increased with
Diorganotin dicarboxylates generally exist as monomeric molecules in which the carboxylate groups chelate in an aniso- bidentate manner (Tiekink, 1991; 1994). The R 2 Sn unit is
Relationship between respiratory variations in left ventricular stroke area (ΔSA) (top left panel), respiratory variations in pulse pressure (ΔPP) (top right panel), left
Average sequence similarity relationship trees constructed for all 10 proteomes, based on POFs or PDFs (Figure 3b), revealed that the divergence of POFs among the 10 different
In relation to end of life care the centre had assessed itself as having a minor non- compliance with the Health Act 2007 (Care and Welfare of Residents in Designated Centres for
