University of Pennsylvania
ScholarlyCommons
Publicly Accessible Penn Dissertations
1-1-2013
Cellular Mechanisms of Mammalian Liver
Regeneration
Kilangsungla Yanger
University of Pennsylvania, kilangyanger@gmail.com
Follow this and additional works at:http://repository.upenn.edu/edissertations
Part of theCell Biology Commons,Developmental Biology Commons, and theMolecular Biology Commons
This paper is posted at ScholarlyCommons.http://repository.upenn.edu/edissertations/949
For more information, please contactlibraryrepository@pobox.upenn.edu.
Recommended Citation
Cellular Mechanisms of Mammalian Liver Regeneration
Abstract
ABSTRACT
CELLULAR MECHANISMS OF MAMMALIAN LIVER REGENERATION
Kilangsungla Yanger
Ben Z. Stanger
The liver is an essential organ that aids in metabolic processes, protein synthesis and detoxification of harmful substances. As the centre for detoxification, the liver is able to compensate for this routine damage with its robust regenerative ability. All vertebrate livers, for example, can make up for tissue mass loss (via surgical excision of a portion of the liver) by replication of their differentiated cells within the remnant lobes. These differentiated cells include parenchymal cells such as the hepatocytes and biliary epithelial cells (BECs) and also non-parenchymal cells. Despite the proliferative capacity exhibited by hepatocytes, the mechanism for how the liver regenerates after toxin injuries is debated. The liver is thought to utilize facultative stem cells (FSCs) originating from the BECs, often referred to as "oval cells," for regeneration following toxin-based injury. However, the notion that oval cells act as stem cells has been based largely on in vitro studies and transplantation models; where lineage tracing has been employed, results have been conflicting. This thesis work employs multiple genetic tools to lineage trace the origin and contribution of various cell populations to liver regeneration in vivo. The findings reveal that contrary to stem cell-based models of regeneration, virtually all new hepatocytes come from pre-existing hepatocytes with no evidence of BECs functioning as FSCs. Instead, hepatocyte lineage tracing reveals in addition to replication, they can function as FSCs. Upon perturbations including toxin injuries, they undergo a hepatocyte-to-BEC reprogramming process in vivo. Cellular reprogramming is the ability to interconvert distinct cell types with defined factors. This
phenomenon has rarely been observed in vivo without exogenous factors. However, a detailed in vivo analysis reveals hepatocytes undergoing this cellular reprogramming process in a robust and step-wise manner involving both morphological and transcriptional changes. This hepatocyte-to-BEC reprogramming requires Notch signalling, similar to how the pathway functions in BEC-specification during liver development. These results provide direct evidence that mammalian regeneration prompts extensive and dramatic changes in cellular identity under various perturbations and thus can also serve as a cellular source for various diseases and potentially for therapy involving BEC paucity and dysfunction.
Degree Type
Dissertation
Degree Name
Doctor of Philosophy (PhD)
Graduate Group
Cell & Molecular Biology
First Advisor
Ben Z. Stanger
Second Advisor
Patrick Seale
Keywords
Liver, Progenitor, Regeneration, Reprogramming, Stem cells, Transdifferentiation
Subject Categories
Cell Biology | Developmental Biology | Molecular Biology
CELLULAR MECHANISMS OF MAMMALIAN LIVER REGENERATION
Kilangsungla Yanger
A DISSERTATION
in
Cell & Molecular Biology
Presented to the Faculties of the University of Pennsylvania
In Partial Fulfillment of the Requirements for the Degree of Doctor of Philosophy
2013
Supervisor of Dissertation
________________________
Ben Z. Stanger, MD, PhD, Assistant Professor, Medicine
Graduate Group Chairperson
_________________________
Daniel S. Kessler, PhD, Associate Professor, Cell and Developmental Biology
Dissertation Committee
F. Bradley Johnson, MD, PhD, Associate Professor, Pathology and Laboratory Medicine
Klaus H. Kaestner, PhD, Thomas and Evelyn Suor Butterworth Professor, Genetics
Patrick Seale, PhD, Assistant Professor, Cell and Developmental Biology
Nancy A. Speck, PhD, Professor, Cell and Developmental Biology
ii Dedication
I would like to dedicate my thesis to my grandparents, Mr. and Mrs. N. Talitemjen Jamir and the late Mr. and Mrs. L. T. Yanger.
Both my grandfathers were government administrative officers in the early days
of Indian independence from the British. They were assigned difficult tasks to open and
establish civil administration in remote and dangerous frontiers within the young country.
Armed with their strong sense of duty and courage, they accepted these postings that took
them and their young families to faraway places, away from the comfort of home and
loved ones, often at the risk of their own lives.
Despite the myriad limitations they faced, my grandmothers always made sure
their children did not lack anything, and as a couple, sacrificed much and prioritized
education for their children. My own parents mirrored this sentiment and thus two
generations later, I am one of the many grandchildren who have reaped the fruits of my
grandparents’ foresight and labour. They have been my source of inspiration and I hope
iii
ACKNOWLEDGMENT
I would like to thank many people who have played an important role in bringing
me thus far with my academic pursuits. Firstly, I am extremely grateful to my thesis
advisor, Dr. Ben Stanger, for giving me the opportunity to be his student for the past five
years. I could not have asked for a better mentor, who besides supporting and guiding me
throughout my Ph.D. training, has also implicitly taught me numerous valuable lessons
through his patience, generosity and kindness.
It has been a pleasure to work with such amiable colleagues. I would like to thank
the past and current members of the lab: Dr. Alfredo Penzo, Dr. Ravi Maddipati, Dr.
Yi-Ju Chen, Zhewei Shen, Nicole Aiello, Chenghua Yang, Erin Dekleva, Laura Murillo, Dr.
Yiwei Zong, Lara Maggs, Archana Panikkar, Matt Emmett, Dr. Andy Rhim, Dr. Tao Gao
and Emily Mirek. I would especially like to thank Dr. Yiwei Zong with whom I worked
closely on studying Notch signalling discussed in Chapter 3.
I would like to thank members of my thesis committee - Dr. Brad Johnson, Dr.
Klaus Kaestner, Dr. Patrick Seale and Dr. Nancy Speck for their valuable time, input and
for having my best interests in mind.
My gratitude goes to Dr. Andrei Thomas-Tikhonenko, Dr. Celeste Simon and Dr.
Brian Keith for their invaluable guidance over the years. I would also like to thank the
larger Cancer Biology sub-group and the Cell & Molecular Biology body for their strong
student support and the fantastic scientific opportunities available.
I am grateful to Dr. Nelson Christensen at Carleton College for formally initiating
my foray into the life sciences, and thus research, by nominating me for an undergraduate
iv
My friends and family have been an integral part of my happiness. I want to thank
them for being my biggest cheerleaders. Whether near or far, the space and distance in
between has not hindered their ability to encourage me and bring plenty of laughter and
perspective into my life.
Last but not least, I would like to thank my parents, Toshimenla and Imtiwati
Yanger. Words cannot adequately express my gratitude and awe of them. Their
dedication, sacrifice and hard work in the interest of their children’s personal pursuits
v ABSTRACT
CELLULAR MECHANISMS OF MAMMALIAN LIVER REGENERATION
Kilangsungla Yanger
Ben Z. Stanger
The liver is an essential organ that aids in metabolic processes, protein
synthesis and detoxification of harmful substances. As the centre for detoxification,
the liver is able to compensate for this routine damage with its robust regenerative
ability. All vertebrate livers, for example, can make up for tissue mass loss (via
surgical excision of a portion of the liver) by replication of their differentiated cells
within the remnant lobes. These differentiated cells include parenchymal cells such
as the hepatocytes and biliary epithelial cells (BECs) and also non-parenchymal
cells. Despite the proliferative capacity exhibited by hepatocytes, the mechanism
for how the liver regenerates after toxin injuries is debated. The liver is thought to
utilize facultative stem cells (FSCs) originating from the BECs, often referred to as
“oval cells,” for regeneration following toxin-based injury. However, the notion that
oval cells act as stem cells has been based largely on in vitro studies and
transplantation models; where lineage tracing has been employed, results have been
conflicting. This thesis work employs multiple genetic tools to lineage trace the
origin and contribution of various cell populations to liver regeneration in vivo. The
findings reveal that contrary to stem cell-based models of regeneration, virtually all
vi
functioning as FSCs. Instead, hepatocyte lineage tracing reveals in addition to
replication, they can function as FSCs. Upon perturbations including toxin injuries,
they undergo a hepatocyte-to-BEC reprogramming process in vivo. Cellular
reprogramming is the ability to interconvert distinct cell types with defined factors.
This phenomenon has rarely been observed in vivo without exogenous factors.
However, a detailed in vivo analysis reveals hepatocytes undergoing this cellular
reprogramming process in a robust and step-wise manner involving both
morphological and transcriptional changes. This hepatocyte-to-BEC reprogramming
requires Notch signalling, similar to how the pathway functions in
BEC-specification during liver development. These results provide direct evidence that
mammalian regeneration prompts extensive and dramatic changes in cellular
identity under various perturbations and thus can also serve as a cellular source for
vii
TABLE OF CONTENTS
ACKNOWLEDGMENT... III
ABSTRACT ... V
LIST OF TABLES ... IX
LIST OF FIGURES ... X
1 INTRODUCTION ... 1
1.1 Overview of tissue regeneration and homeostasis ... 2
1.1.1 Stem cells ... 2
1.1.2 Stem cell assays ... 5
1.2 Modes of liver regeneration ... 11
1.2.1 Cellular mechanisms of liver regeneration after partial hepatectomy... 11
1.2.2 Molecular mechanisms of liver regeneration after partial hepatectomy ... 16
1.2.3 Liver regeneration in toxin injury and origins of FSC model ... 18
1.2.4 In vitro experiments of FSC ... 19
1.2.5 Cell transplantation assays of FSC ... 20
1.2.6 In vivo studies of FSC ... 21
1.2.7 Summary ... 23
2 ADULT HEPATOCYTES ARE GENERATED BY SELF-DUPLICATION RATHER THAN STEM-CELL DIFFERENTIATION... 24
2.1 Introduction ... 25
2.2 Results ... 27
2.2.1 ADC-inducing injuries ... 27
2.2.2 Lineage tracing biliary epithelial cells in vivo ... 32
2.2.3 Lineage tracing atypical ductal cells in vivo ... 37
2.2.4 Determining hepatocyte neogenesis in vivo ... 40
2.3 Summary ... 53
viii
3.1 Introduction ... 57
3.2 Results ... 58
3.2.1 Notch mediated reprogramming... 58
3.2.2 Injury mediated reprogramming... 58
3.2.1 Notch signalling is required for reprogramming ... 74
3.3 Summary ... 80
4 DISCUSSION ... 81
5 APPENDIX 1 : ROLE OF NOTCH SIGNALLING IN HEPATOCELLULAR CARCINOMA ... 101
5.1 Introduction ... 102
5.2 Results ... 104
5.2.1 Liver-Specific Activation of Notch Pathway Promotes Oncogenesis ... 104
5.2.2 Notch-Induced Tumors Exhibit Insulin-Like Growth Factor 2 Promoter Reactivation ... 109
5.2.3 Activation of the Notch Pathway Occurs Frequently in Human HCC ... 113
5.2.4 The Notch Signature Coclusters Within the Proliferation Class and Predicts Response to Selective Notch Inhibition ... 127
5.3 Discussion ... 133
6 MATERIALS AND METHODS ... 138
ix
LIST OF TABLES
x
LIST OF FIGURES
FIGURE 1.1MECHANISMS FOR MAINTAINING HOMEOSTASIS AND REGENERATION ... 3
FIGURE 1.2SCHEMATIC OF ALTERNATIVE CELLULAR MECHANISMS OF REGENERATION ... 7
FIGURE 1.3SCHEMATIC VIEW OF FSCS LOCATION IN THE LIVER... 12
FIGURE 1.4MECHANISMS FOR MAINTAINING HOMEOSTASIS AND REGENERATION IN THE LIVER ... 14
FIGURE 2.1EXAMPLE OF LIVER INJURY RESULTING IN AN ATYPICAL DUCTAL CELL RESPONSE AND CESSATION AFTER RECOVERY ... 28
FIGURE 2.2EXAMPLE OF TOXIN INJURY ASSOCIATED WITH SIGNIFICANT CELLULAR TURNOVER ... 30
FIGURE 2.3MECHANISMS FOR LINEAGE TRACING BILIARY EPITHELIAL CELLS ... 33
FIGURE 2.4BECS LACK DETECTABLE PROGENITOR CELL ACTIVITY IN VIVO ... 35
FIGURE 2.5ADCS DO NOT GIVE RISE TO HEPATOCYTES ... 38
FIGURE 2.6TM ADMINISTRATION TO KRT19-CREER/R26YFP MICE RESULTS IN EQUAL LABELLING OF PROLIFERATING AND NON-PROLIFERATING ADCS ... 41
FIGURE 2.7A PULSE-CHASE SYSTEM FOR DETERMINING THE ORIGIN OF REGENERATING HEPATOCYTES ... 43
FIGURE 2.8THE AAV2/8 SEROTYPE SPECIFICALLY TRANSDUCES HEPATOCYTES ... 46
FIGURE 2.9TESTING AAV2/8 SEROTYPE BY FLUORESCENCE-ACTIVATED CELL SORTING (FACS)... 48
FIGURE 2.10HEPATOCYTE PULSE-CHASE OUTCOMES ... 51
FIGURE 3.1APPEARANCE OF “INTERMEDIATE” CELLS EXPRESSING BOTH BILIARY AND HEPATOCYTE MAKERS UPON INJURY ... 60
FIGURE 3.2LOW EXPRESSION OF KRT19 IN HEPATOCYTES DURING INJURY ... 62
FIGURE 3.3DIRECT EVIDENCE FOR HEPATOCYTE-TO-ADC REPROGRAMMING IN VIVO ... 64
FIGURE 3.4HEPATOCYTES EXPRESS BILIARY CELL MARKERS IN MULTIPLE LIVER TOXIN INJURIES ... 67
FIGURE 3.5HUMAN LIVER DISEASES EXHIBIT “INTERMEDIATE” CELL PHENOTYPE ... 70
xi
FIGURE 3.7MOLECULAR ANALYSES OF HEPATOCYTE-DERIVED/REPROGRAMMED BECS .. 75
FIGURE 3.8HEPATOCYTE REPROGRAMMING REQUIRES NOTCH SIGNALLING ... 78
FIGURE 4.1SOX9-CREER LABELS BECS AND HEPATOCYTES ... 87
FIGURE 4.2MODEL FOR HEPATOCYTE-TO-ADC REPROGRAMMING ... 91
FIGURE 4.3BILIARY DEVELOPMENT IN ALAGILLE MICE... 97
FIGURE 4.4INTERMEDIATE CELLS IN DOUBLE MUTANT ALAGILLE LIVERS ... 99
FIGURE 5.1ACTIVATED NOTCH INDUCES LIVER ONCOGENESIS IN VIVO ... 105
FIGURE 5.2PHENOTYPIC CHARACTERIZATION OF NOTCH-INDUCED PROLIFERATION OF OVAL-SHAPED CELLS ... 107
FIGURE 5.3INSULIN-LIKE GROWTH FACTOR 2(IGF2) PROMOTER REACTIVATION IN NOTCH -INDUCED TUMOURS ... 111
FIGURE 5.4NOTCH ACTIVATION AND DE-REGULATION IN HUMAN HCC ... 114
FIGURE 5.5PREDICTION OVERLAP BETWEEN NOTCH TUMOUR AND NEW-BORN SIGNATURES IN HUMAN HCC ... 116
FIGURE 5.6HEY1 ALTERATIONS IN HUMAN HCC ... 119
FIGURE 5.7DEREGULATION OF THE NOTCH TARGET GENE SOX9 IN HCC ... 122
FIGURE 5.8SOX9 REGULATION BY MIR-30 IN HCC ... 125
FIGURE 5.9SIGNATURE-BASED ACTIVATION OF NOTCH ACROSS HCC DATA SETS ... 128
1
1 INTRODUCTION1
1 This chapter, containing excerpts with modifications, has been published: Yanger, K., Stanger, B.Z.
2
1.1 Overview of tissue regeneration and homeostasis
1.1.1 Stem cells
Stem cells are distinct from other mature cellular populations due to their unique
ability to both self-renew (give rise to more stem cells) and differentiate into other cell
types (Potten and Loeffler, 1990). The latter ability becomes more restricted as
development progresses, resulting in a stem cell hierarchy based on the extent of potency
(Slack, 2008). For instance, early on in development, cells from the inner cell mass of the
blastocyst are considered to be pluripotent stem cells because they are able to give rise to
all cell lineages except for extra embryonic tissues. With the onset of organogenesis later
in development, stem cell potential becomes restricted as commitment to distinctive
tissue-specific lineages occurs (Eckfeldt et al., 2005; Slack, 2008). An example of this is
the male germline, in which the potential of self-renewing spermatogonial stem cells is
limited to spermatogonia for the lifetime of a male organism (de Rooij, 2001). Adult
tissues have two main mechanisms for replacing cells lost during routine cellular
turnover. In some tissues, adult stem cells are the source of new cells throughout life,
while other tissues are devoid of adult stem cells and maintain homeostasis through
replication of existing cells. The skin, intestine, and blood are examples of tissues that
continuously generate new cells from stem cells, while bone, kidney, and cartilage are
examples of tissues in which stem cells play a limited, if any, role in normal organ
3
4
Figure 1.1 Two classical mechanisms for tissue homeostasis/regeneration involve
differentiation of a stem/progenitor population (red box) or proliferation of differentiated
cells (blue box). Hematopoietic stem cells have an apparently unlimited self-renewal
capacity that enables them to continuously supply new blood cells, while cellular
maintenance of the cartilage anlagen occurs by means of chondrocyte proliferation within
5
In contrast to normal tissue turnover, regeneration describes the process whereby
new cells arise to replace those lost by injury. As with normal homeostasis, both stem
cell-dependent and stem cell-independent mechanisms for regeneration are used by
different tissues. However, under conditions of both homeostasis and injury, the relative
balance between stem cell-dependent and – independent mechanisms of recovery has not
been quantified. Thus, for most tissues, the relative degree to which stem cells contribute
to tissue maintenance and regeneration remains undefined. The nature of the injury may
also play a role in determining the recovery mechanism used by a given tissue. It has
been postulated that following particular types of injury, a subset of differentiated cells
can, in certain tissues, adopt a “stem cell-like” fate (Zipori, 2004). These cells have been
termed facultative stem cells (FSCs) due to their ability to acquire multipotent qualities
during conditions other than homeostasis, despite being initially unipotent (Figure 1.2).
Such a potential blurs the stem cell-progeny paradigm that has been used by
developmental biologists for decades. Thus, the biology of FSCs has relevance not only
for tissue regeneration but could also serve to greatly inform our understanding of the
multipotent or pluripotent state. Despite the potential importance of FSCs, the evidence
supporting their existence is based mainly on in vitro models.
1.1.2 Stem cell assays
Historically, three major assays have been used to document stem cell activity: 1)
clonogenic (in vitro) growth, 2) cellular transplantation, and 3) lineage tracing (Slack,
6
growth can provide evidence of self-renewal and multilineage differentiation. Moreover,
7
8
Figure 1.2 As opposed to a unidirectional hierarchy resulting in mature cells through
stem-cell differentiation or replication (black arrows), other mechanisms could account
for tissue restoration (blue box expanded). These putative mechanisms include both the
FSC model and other alternatives. (A) A mature, differentiated cell (green square) could
dedifferentiate and acquire a progenitor identity (orange triangle), thus functioning as a
FSC. (B) Mature cells could undergo reprogramming, which would allow them to
interchange/transdifferentiate into other differentiated cells. Such a mechanism could be
difficult to distinguish from the dedifferentiation–redifferentiation model in (A) unless
the fates of the differentiated cells were followed with precision. (C) Finally, simple
replication of existing differentiated cells could account for restoration of tissue mass. In
this scenario, putative FSCs could simply be “bystanders” and not formally contribute to
9
However, such assays do not necessarily indicate “stemness” in vivo. Moreover,
growth assays assume that the progeny of the putative stem cell are “stable” in vitro. This
latter point is critical, because the appearance of multiple cell types in a colony arising
from a single cell is commonly taken as evidence of multipotency, yet this interpretation
would be incorrect if differentiated cells placed in culture have the capacity to
interconvert or “transdifferentiate.” Likewise, cell transplantation assays have been
tremendously important in the identification and study of stem cells, particularly
hematopoietic stem cells. However, transplantation assays can also be subject to
confounding phenomena. One of the most important of these confounders is cell fusion,
which can occur with many different types of cells and which can give a false impression
regarding potency (Wagers and Weissman, 2004).
The use of in vivo lineage tracing is a key technique for determining the origin of
new cells. The most commonly used technique for lineage tracing in a mouse is Cre-Lox
technology, which permits labelling to occur in a cell-type-specific manner. Additionally,
a variant of the Cre recombinase fused to a mutated oestrogen receptor (Cre-ERT2) allows temporal control, labelling cells at a desired time point during development or adulthood.
Through such genetic labelling, a cell’s subsequent fate and that of its progeny can be
followed, as genetic lineage labelling constitutes a heritable marking. Such labelling of
putative stem cell populations allows for stringent testing of stem cell properties of
self-renewal and pluripotency, and can provide insight into the cellular mechanisms of
regeneration. However, Cre-Lox-based cell labelling uses the use of “tissue-specific”
10
promoters. Moreover, the inducible Cre-ERT2 variant requires tight regulation in order to avoid false labelling, particularly for FSC-studies. Hence, studies which use lineage
labelling to determine whether stem cells contribute to homeostasis and/or regeneration
are ultimately constrained by the specificity of the particular promoters and mouse strains
11
1.2 Modes of liver regeneration
1.2.1 Cellular mechanisms of liver regeneration after partial hepatectomy
For several decades, the liver has stood as the model organ for mammalian
regenerative studies. The liver has multiple functions in normal physiology – including
production of plasma proteins, synthesis of bile for fat emulsification, and detoxification,
and liver failure is incompatible with life. The liver’s regenerative ability is apparent
when, after removing two-thirds of its mass (partial hepatectomy, PHx), the remnant third
is able to grow back to its original size and restore normal function (Higgins, 1931). The
liver consists of several cellular components – two epithelial cell types (hepatocytes and
biliary epithelial cells, or BECs) and several “non-parenchymal cell” (endothelial cells,
macrophage-like “Kuppfer cells,” and fibroblasts) – organized into structures referred to
as hepatic lobules. Hepatocytes comprise the vast majority of cells in the centre of the
lobule, while BEC-lined bile ducts are found in regions known as portal tracts at the
periphery of the lobule. Bile made by hepatocytes drains into the bile ducts through
tubular structures known as the “Canals of Hering,” which constitutes a transitional zone
between hepatocytes and BECs (Figure 1.3)
The dominant cellular mechanism by which the liver regrows is proliferation
(Figure 1.4 A) (Michalopoulos, 2007). In rats, normal liver mass is attained completely
within 1 week while the mouse takes an additional week to do so. Studies using
12
13
Figure 1.3 Schematic depiction of a portal tract in the liver. Bile made by hepatocytes
drains into the canalicular space and subsequently through the Canals of Hering into the
bile duct. The precursors of oval cells in the liver have been proposed to reside within the
Canals of Hering, the transitional zone between hepatocytes and biliary cells. HA, hepatic
14
15
Figure 1.4 Following partial hepatectomy (PHx; A), differentiated liver cells undergo
replication to make-up for the surgical loss of mass. In a toxin injury (B), a new cell type
known as an “oval cell” is proposed to arise from BECs and function as a bipotent
16
demonstrated that cell replication following partial hepatectomy follows reproducible
kinetics (Grisham, 1962). Hepatocytes constitute the first cell population to enter the cell
cycle, followed by the biliary epithelial cells and then non-parenchymal cells
(Michalopoulos and DeFrances, 1997; Taub, 2004).
In addition to cell proliferation, cellular hypertrophy has been shown to be
another important regenerative mechanism dependent on the degree of injury and the
state of the animal. Older mice have impaired liver regenerative capability compared to
younger mice due to decreased proliferative ability (Iakova et al., 2003; Timchenko,
2009). However, this defect in ageing female mice is reversed during pregnancy. Older,
pregnant mice utilize cellular hypertrophy instead of cell proliferation, to recover at rates
comparable to its younger control animals (Gielchinsky et al., 2010). Additionally, the
degree of the surgical excision has been shown to induce hypertrophy in addition to cell
proliferation (Miyaoka et al., 2012).
1.2.2 Molecular mechanisms of liver regeneration after partial hepatectomy
The exact mechanism of how organs such as the liver ‘senses’ and controls its
regenerative size is not known (Stanger, 2008). However, studies allude to both intrinsic
and extrinsic signalling mechanisms being involved in PHx regeneration (Michalopoulos
and DeFrances, 1997; Taub, 2004). For example, factors as diverse as interleukin-6
(IL-6) and the bile acid receptor, FXR, have been reported to be important (Cressman et al.,
1996; Huang et al., 2006). Both IL-6 and FXR knockout mice after PHx display many
anomalies during its regenerative process. Mortality rates during recovery are higher in
17
replication appears to be compromised in both knockout animals as bromodeoxyuridine
(BrdU) staining is greatly reduced in hepatocytes following injury. In IL-6 -/- animals
this appears to be hepatocyte-specific as the nonparenchymal cells such as the endothelial
and Kupffer cell proliferate normally and are comparable to wildtype livers (Cressman et
al., 1996). This suggests that nonparenchymal cells do not need IL-6 for this process.
However, mitogenic signals such as endothelial vascular growth factor (VEGF) are
secreted by hepatocytes for sinusoidal endothelial cell proliferation in PHx recovery, thus
revealing the existence of a paracrine relationship (Shimizu et al., 2001).
Many IL-6 -/- animals that recover after a PHx are jaundiced, have smaller and
highly necrotic livers (Cressman et al., 1996). However, despite the IL-6 knockout, not
all animals display these pockets of necrosis, potentially indicating the ability of the liver
to compensate for this mutation. Indeed, wildtype hepatocytes have been shown to be
able to clonally repopulate ~95% of the liver in urokinase-type plasminogen activator
(uPA) transgenic mice (Sandgren et al., 1991). The replicative ability of hepatocytes has
been displayed in serial transplantation studies, with calculations suggesting that a single
hepatocyte is competent to give rise to many entire livers (Overturf et al., 1997).
Transplantation assays allude to species-specific intrinsic regenerative
mechanisms. For example, rat hepatocytes transplanted into mice livers that undergo a
PHx exhibit entry into the cell cycle sooner than mouse hepatocytes. Despite being in a
mouse-specific cellular milieu, the rat hepatocytes label with BrdU within 24 hours like
18
Sandgren, 2000). Thus hepatocytes display a certain degree of species-specific cell
autonomous features.
1.2.3 Liver regeneration in toxin injury and origins of FSC model
Despite the robust regenerative capacity of hepatocytes, it is widely believed that
an alternative mechanism for adult regeneration, involving FSCs, is used following
certain types of liver injury (Figure 1.3). This hypothesis initially emerged from studies
in which the rat liver was forced to regenerate following exposure to one of several
hepatotoxic carcinogens. In rats, it is believed these cells emerge as a result of impaired
hepatocyte replication, although in the mouse, counterparts of these cells still appear in
injured livers despite the ability of hepatocytes to proliferate (Ghoshal et al., 1983; Wang
et al., 2003a). Under such conditions, a distinctive histological picture was noted,
characterized by the emergence of a heterogeneous population of small oval-shaped cells
with biliary properties (Farber, 1956). Subsequent work revealed that cells with a similar
appearance are observed in many or most models of hepatocarcinogenesis or
toxin-induced injury (Lee et al., 2006; Roskams et al., 2003). These cells have been referred to
by many different names including “ductular hepatocytes,” “intermediate hepatobiliary
cells,” “atypical ductular proliferation,” or more commonly as “oval cells,” a term
adopted from rodent studies (Factor et al., 1994; Gerber et al., 1983; Preisegger et al.,
1999; Zhou et al., 2007). They are characterized by small size, an ovoid nucleus, scant
cytoplasm, poorly defined lumen, and lack of basement membranes (Factor et al., 1994;
Gerber et al., 1983; Preisegger et al., 1999). Although debated, oval cells are proposed to
19
Campbell, 2003) (Figure 1.2) and, after injury, are thought to interpose themselves
between biliary ductules and so-called “intermediate hepatocytes,” cells which share
characteristics of both hepatocytes and oval cells (Factor et al., 1994; Preisegger et al.,
1999). This transitory morphology and proximity of the hepatocytes to oval cells has
been taken as evidence of differentiation of the latter into the former, and static
visualization by light microscopy is consistent with that view (Factor et al., 1994).
1.2.4 In vitro experiments of FSC
Several in vitro experiments performed in the 1980s demonstrated that cultured
oval cells could adopt either hepatocyte or biliary features depending upon culture
conditions, a phenomenon similar to that observed with culture of fetal rat hepatocytes
that have bona fide multipotent properties (Germain et al., 1988a; Germain et al., 1985;
Germain et al., 1988b). Similar results were obtained by investigators who derived cell
lines with “oval” cell properties (Tsao et al., 1984) and subsequently many such lines
have been derived which are referred to as “liver epithelial cell lines” or BMEL cells
(“bipotential mouse embryonic liver”; (Strick-Marchand et al., 2004)). Nevertheless,
there is conflicting lineage-based evidence to confirm such ontological conclusions about
bipotentiality (Taub, 2004; Zaret and Grompe, 2008). One of the difficulties in doing
lineage tracing experiments with oval cells has been the lack of oval cell-specific
markers. Although several features that distinguish oval cells from normal biliary
epithelial cells have been reported (e.g.(Sirica et al., 1990)), immunohistologic studies
with antibodies are unable to distinguish between oval cells and BECs (Fausto and
20
includes both epithelial-derived and bone marrow-derived cells that exhibit distinct cell
surface profiles (Dorrell et al., 2008; Okabe et al., 2009). Recent efforts have sought to
identify novel cell-surface antibodies that are oval cell specific (Dorrell et al., 2008), but
these and other studies have often yielded antibodies that also recognize normal BECs.
Thus, at least based on immunostaining data, there is no compelling evidence that oval
cells represent a distinct cell type that is not present in the normal liver.
1.2.5 Cell transplantation assays of FSC
Cell transplantation experiments provide another line of evidence in support of
oval cell bipotentiality. Again, because of a paucity of markers, oval cell isolation for
initial studies have been forced to rely on cell fractionation techniques based on the
smaller size of the oval cell (Fausto and Campbell, 2003). Cells isolated in this fashion,
although contaminated with others cells such as hematopoietic cells, can rescue
fumarylacetoacetate hydrolase mutant (FAH-/-) mice as effectively as hepatocytes,
indicating that this population has robust hepatocyte differentiation-reconstitution
capacity (Wang et al., 2003a). This study, however, does not specifically address whether
new biliary cells emerged from these transplanted cells. Lineage tracing studies also give
support to the notion that nonhepatocytes can give rise to hepatocytes during
toxin-mediated injury (Pichard et al., 2009).
During the late 1990s, it was proposed that bone marrow (BM) derived cells
might serve as facultative stem cells for liver regeneration and might even give rise to
oval cells (Petersen et al., 1999). However, subsequent studies showed that this
21
2003; Wang et al., 2003b). This fusion was shown by transplanting Cre-expressing bone
marrow cells to R26-LacZ reporter mice that require Cre recombination for LacZ
expression. β-Gal (5-bromo-4-chloro-3-indolyl-β-D-galactoside) staining occurs in cells
positive for LacZ. Hepatocytes in the liver were found to be β-Gal positive, signifying a
recombination event with the fusion of a Cre-expressing and a R26-LacZ cell
(Alvarez-Dolado et al., 2003). Another study using female donors and male recipients confirmed
cell fusion using karyotype analysis. Hepatocytes in transplanted male animals were
found to consist of XXXY and XXXXYY karyotypes (Wang et al., 2003b) . These cell
fusion events occur with low frequency, but in the appropriate selective environment,
hepatocytes generated by a fusion event are capable of significant expansion through
simple replication. Thus, while there may be a small degree of cell-fusion occurring with
bone marrow cells, the frequency and extent of this phenomenon is considered to be of
non-physiological significance (Oertel and Shafritz, 2008; Wang et al., 2003a).
1.2.6 In vivo studies of FSC
Electron microscopy studies reveal that following injury with the hepatotoxin
Dipin, a series of “transitional” cells – cells with ultrastructural features of both ductular
cells and hepatocytes – were found (Factor et al., 1994). These cells were larger than oval
cells but smaller than hepatocytes, had variable nucleocytoplasmic rations, mitochondrial
content, and glycogen rosettes (Factor et al., 1994). Thus, at the ultrastructural level, oval
cells do seem to comprise a heterogeneous population of cells, with some exhibiting
22
One marker used for lineage tracing study which supports the view that oval cells
can exhibit bipotentiality was the Foxl1 marker, in which Foxl1-Cre mice were used to
label putative progenitor cells (Sackett et al., 2009). Foxl1 is a mesenchymal marker, and
mice in which the Foxl1 lineage was labeled (using a lacZ lineage ‘reporter’) exhibited
β-Gal activity in both hepatocytes and biliary cells following injury. This result does not
distinguish between the possibility that a single bipotential progenitor cell was labeled vs.
the alternative explanation that hepatocytes and biliary cells both independently activated
the Foxl1 promoter (leading to cell labelling) upon injury, and additional experiments
will be needed to resolve these issues.
More recent studies utilizing inducible-Cre promoters have been used to
lineage trace oval cells in vivo, though they have also led to disparate results
(Friedman and Kaestner, 2011). For instance, studies utilizing similar Sox9-CreER
strains result in opposing findings, with one favouring a stem role for Sox9+ BECs (Furuyama et al., 2011) while another did not find evidence of this (Carpentier et
al., 2011). Cre-based labelling employing osteopontin (Opn) or Lgr5- inducible
drivers have supported the idea of bipotent oval cells (Espanol-Suner et al., 2012;
Huch et al., 2013). In both cases, inheritance of the label was found in hepatocytes,
though in low amounts. However, other in vivo lineage tracing studies come to
opposing conclusions, of which has been shown by other studies (Malato et al.,
23
1.2.7 Summary
In summary, the liver is believed to have two mechanisms for regeneration
depending upon the mechanism of injury (Figure 1.3). Following partial extirpation
(PHx), remaining hepatocytes re-enter the cell cycle, undergoing one or two rounds of
cell division resulting in a complete recovery of liver size. This cellular mechanism for
regrowth is well established, and several of the signalling pathways that mediate this
growth response have been identified (although the identity of the size “sensor” that
informs the liver that regrowth is needed remains elusive). By contrast, injury with
hepatotoxins results in the emergence of numerous small cells – most commonly referred
to as oval cells – that arise in the portal tracts and make their way into the lobules. Cell
transplantation studies and in vitro differentiation experiments suggest that these cells
exhibit multipotency under these experimental conditions, but in vivo studies exhibit
opposing views and thus definitive evidence that these cells act as multipotent progenitor
cells remains deficient. Likewise, although these cells are commonly believed to arise
from BECs within the Canals of Hering, their precise origins also remain uncertain. Such
a cell type holds much promise for regenerative medicine in light of the acute shortage of
24
2 ADULT HEPATOCYTES ARE GENERATED BY SELF-DUPLICATION
25
2.1 Introduction
Tissue homeostasis in adult tissues is maintained via replication of
differentiated cells or stem cell differentiation. In addition to these well-established
paradigms, it has been proposed that select tissues contain a population of so-called
“facultative stem cells.” By definition, facultative stem cells (FSC) lack stem cell
activity during normal tissue turnover but are thought to be recruited during specific
types of injury to behave like stem cells (Yanger and Stanger, 2011). The
mammalian liver is widely viewed as a paradigm for regeneration via
FSC-mediated recovery. In response to various disease states and toxin-induced injuries,
rodents and humans exhibit an accumulation of atypical ductal cells (ADCs) –
commonly referred to as “oval cells” – within the liver parenchyma (Farber, 1956;
Popper et al., 1957). ADCs have a ductal morphology, but their arrangement into an
intricate anastomosing configuration that extends into the hepatic lobule gives them
a histologic appearance that is distinct from that of normal biliary epithelial cells
(BECs) (Desmet, 1985). ADCs are thought to arise from BECs within the Canals of
Hering, structures that reside at the interface of the intrahepatic bile ducts and
hepatocyte-lined canaliculi (Factor et al., 1994; Preisegger et al., 1999).
Based on in vitro studies, ultrastructural analysis and cell transplantation
assays, ADCs have been proposed to function as bipotent FSCs, giving rise to both
hepatocytes and BECs, during toxin-mediated liver injury, although this issue is
controversial (Espanol-Suner et al., 2012; Fausto and Campbell, 2003; Friedman
26
Zaret and Grompe, 2008). Furthermore, adult hepatocytes exhibit significant
plasticity in vivo (Michalopoulos et al., 2005; Yanger et al., 2013), a phenomenon
that may give the appearance of stem cell-mediated differentiation. In order to
obtain evidence for liver stem cell activity in vivo, I specifically labelled distinctive
cell populations in the liver – BECs and hepatocytes, and transit amplifying cells
(the results of the latter done in collaboration will be discussed briefly) – using both
direct genetic and unbiased nucleoside analogue-based lineage labelling tools under
multiple ADC-inducing injury conditions. Our results suggest that hepatocytes, not
27
2.2 Results
2.2.1 ADC-inducing injuries
The liver was injured in several ways to induce ADCs including chow
containing DDC (3,5-diethoxycarbonyl-1,4-dihydrocollidine) (Wang et al., 2003a),
CDE diet (choline-deficient ethionine supplemented) (Carpentier et al., 2011), CCl4
administration (carbon tetrachloride) (Malato et al., 2011), and ANIT
(alpha-naphthyl-isothiocyanate) (Faa et al., 1998), all of which act as hepatotoxins that has
been used extensively for studies of ADC/oval cell biology (henceforth, the term
ADCs will be used to refer to cells with an “oval cell” or “progenitor” phenotype).
As expected, I observed the emergence of numerous ADCs within 2 weeks of DDC,
ANIT and CCl4 treatment and within 4 days of CDE treatment. ADCs first arose in
the portal regions and expressed both “classical” ADC markers (e.g. A6 and
KRT19) as well as a number of newly-generated ADC markers (Figure 2.1;
(Dorrell et al., 2008; Wang et al., 2003a)). Based on pilot experiments, I adopted a
regimen whereby animals received a normal diet for 3-5 weeks following DDC
treatment and 2 weeks after CDE and ANIT diet, a protocol that resulted in a return
to near-normal liver histology. All hepatotoxins were associated with substantial
hepatocyte death as assessed by cleaved caspase 3 staining and proliferation with
BrdU incorporation (Figure 2.2). Thus, all treatment regiments were associated with
a robust ADC response during which a substantial fraction of hepatocytes
28
29
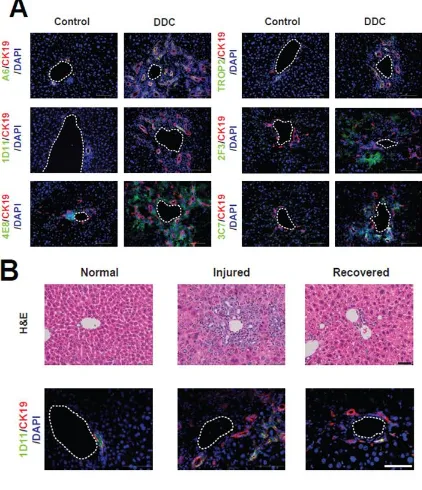
Figure 2.1 (A) DDC treatment is associated with an expansion of liver cells
expressing a variety of oval cell/ADC markers compared to control livers. Several
markers of “non-parenchymal” cells (2F3 and 3C7) were expressed only following
DDC treatment, whereas all epithelial-specific markers (A6, 1D11, Trop2, and
KRT19) were expressed in both normal ducts and oval cells/ADCs. (B) The
injury-recovery protocol (2 weeks of DDC followed by 5 weeks of normal diet) is
associated with an expansion and regression of the KRT19+1D11+ population.
30
31
Figure 2.2 (A) Administration of a DDC diet leads to an ADC response, characterized
by the expansion of small BEC-like cells from the peri-portal region into the lobule.
Animals given BrdU in the drinking water for two weeks with either regular chow
(Normal) or in combination with a DDC-containing diet (DDC) exhibit marked
proliferation of both BECs, marked by CK19 (B, arrowheads), and hepatocytes, marked
by HNF4α (C, arrowheads). (D) DDC treatment also leads to a significant increase in
32
2.2.2 Lineage tracing biliary epithelial cells in vivo
It has been proposed that BECs residing within the Canals of Hering serve
as precursors of liver progenitor cells (Figure 2.3 (Factor et al., 1994; Wang et al.,
2003a)). Therefore, I crossed inducible cytokeratin-19 promoter (Krt19) CreER
knock-in mice (Means et al., 2008) to Rosa26YFP reporter mice (Srinivas et al.,
2001) to label cells from the BEC lineage – prior to injury – to look for evidence
that these cells could give rise to hepatocytes (Figure 2.3). Bigenic
Krt19-CreER/R26YFP mice animals were given tamoxifen (TM), resulting in pulse
labelling of BECs with an efficiency of 36.2±8.7% (Figure 2.4 A, top, n=4),
including cells within the Canals of Hering (Figure 2.4 A, side panels). Importantly,
labelling was completely restricted to BECs, as previously reported (Figure 2.4 A;
(Scholten et al., 2010)).
I then tested whether labelled BECs give rise to hepatocytes under injury or
homeostatic conditions. 6-8 week old bigenic animals were given TM and after a
washout period were subjected to either an injury-recovery protocol with various
ADC-inducing injury models including DDC, CDE diet, CCl4 administration, and
ANIT or left uninjured. Under all injury-recovery circumstances, YFP+ cells co-stained for biliary markers but not hepatocyte markers, indicating that labelled
BECs did not give rise to hepatocytes (Figure 2.4 B and data not shown; DDC:1191
cells counted, n=3; CDE: 1157 counted, n=3). I next determined whether BECs
33
34
Figure 2.3 Schematic view of BEC labelling using Krt19-CreER; R26YFPmice.
Cells are marked in a mosaic fashion upon TM injection (“Pulse”), and the ability
of labelled BECs to give rise to hepatocytes is assessed following injury and
35
36
Figure 2.4 (A) YFP-labelling at “pulse.” Labelling occurs exclusively in BECs -
encompassed BECs lining ducts (arrowhead) as well as BECs within the Canal of
Hering (side panels). (B) Following injury-recovery, a similar pattern and degree of
labelling is observed after the chase; no YFP label is observed in hepatocytes
(“Chase” – DDC and CDE). Unperturbed livers studied after 9 months do not show
any hepatocytes bearing the YFP label (“Chase” = 9 months). The images shown
are representative of multiple experiments (Pulse: n=7; DDC: n=8; CDE: n=3; 9
months chase group: n=5). CV, central vein; PV, portal vein; HA, hepatic artery;
37
reported forSox9+ BECs (Furuyama et al., 2011). Following a 9 month labelling
“chase,” all YFP+
cells expressed biliary markers (1154 counted; n=4) but not
hepatocyte markers or morphology (Figure 2.4 B, 4773 counted). Hence,
KRT19-expressing BECs do not appear to give rise to hepatocytes following injury or
during normal liver turnover.
2.2.3 Lineage tracing atypical ductal cells in vivo
It is possible that KRT19+ADCs arise from a unique cell population that is not labelled in the quiescent state. To this end, I administered TM to
Krt19-CreER/R26YFP animals during the second-half of DDC injury, thus labelling
newly-formed ADCs (Figure 2.5 A). Injury alone (in the absence of TM) did not induce
recombination of the reporter allele, an important control to verify the stringency of
the inducible promoter (Figure 2.5 B). TM administration during DDC treatment
resulted in YFP labelling of 22.7±4.6% of K19+ cells, including A6+ ADCs (“Pulse”; n=3; Figure 2.5 C). Labelling encompassed cells within large
mature-appearing ductal structures as well as isolated ductal cells that penetrated the lobule.
Labelling was highly specific for ADCs, as all labelled cells (1010 counted, n=6)
exhibited a biliary morphology and stained positive for ADC/biliary markers, but
lacked a hepatocyte morphology and were negative for HNF4α (Figure 2.5 C).
Following a 3-week recovery (“Chase”), YFP+ cells were readily detected in
the livers of Krt19-CreER/R26YFP mice (Figure 2.5 D). Consistent with our results
38
39
Figure 2.5 (A) Schematic view of lineage tracing of ADCs. An idealized
hexagonally-shaped lobule is shown on the left. A blow-up of one portal tract
illustrates the interface between biliary epithelial cells (BECs; blue) and
hepatocytes (crimson). Treatment of animals with the toxin DDC (“Injury”) leads to
the emergence of ADCs in the lobule (blue cells mingled with hepatocytes).
Lineage labelling (“Pulse”) results in the heritable marking of ADCs (green) but not
hepatocytes, whose progeny can be followed after recovery (2 weeks DDC
followed by 5 weeks normal chow; “Chase”). (B) DDC-treated Krt19-CreER;
R26YFP mice do not exhibit YFP expression in the absence of TM. (C) The Krt19
-CreER transgene permits specific labelling of KRT19+ and A6+ ADCs after DDC treatment. No hepatocytes were labelled during the pulse. (D) Following recovery
40
with a hepatocyte morphology or HNF4α expression (2474 counted; n=5). YFP+
cells in the recovery group resembled normal BECs, exhibiting a biliary
morphology and staining with biliary markers (Figure 2.5 D). As some
stem/progenitor cell populations undergo replication rates that differ from that of
surrounding cells (Blanpain et al., 2007), I ensured there was equal YFP labelling
of proliferating and non-proliferating ADCs using Ki-67 (Figure 2.6). These results
indicate that ADCs labelled during injury do not give rise to hepatocytes. Taken
together, the results reveal that neither ADCs nor BECs (their presumptive cell of
origin), give rise to hepatocytes under homeostatic conditions or after
toxin-mediated injury.
2.2.4 Determining hepatocyte neogenesis in vivo
These experiments do not rule out the possibility that hepatocytes arise from
progenitor cells that were not marked by the Krt19-CreER labelling approach
(including “marker negative” cells). To test this possibility, I labelled differentiated
hepatocytes and determined the contribution of “non-hepatocytes” to recovery
following injury (Figure 2.7 A). The rationale for the approach follows from the
expectation that unlabelled stem cells contributing to liver regeneration would give
rise to unlabelled progeny, resulting in decreased hepatocyte-labelling index (Figure
2.7 B (i)). Alternatively, if new hepatocytes are derived solely from existing
hepatocytes, then the hepatocyte labelling index would remain unchanged (Figure
41
42
Figure 2.6 I sought to ensure that TM administration to Krt19-CreER/R26YFP mice
resulted in equal labelling of proliferating and non-proliferating ADCs. Hence, I used
Ki-67 to compare the fraction of proliferating cells in (A) both YFP- (arrows) and YFP+
(arrowheads) ADCs with (B) with equal frequency of Ki-67+ cells comprising
43
44
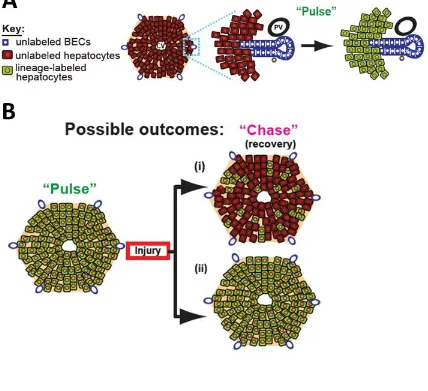
Figure 2.7 (A) Schematic view of lineage tracing hepatocytes. Lineage labelling
(“Pulse”) results in the heritable marking of hepatocytes (green) but not BECs. (B)
Predictions from different models of liver regeneration. After injury and recovery
(“Chase”), stem cell-based repair would result in a decrease in the hepatocyte
labelling index (i), while hepatocyte-mediated recovery would result in no change
45
to which putative stem/progenitor cells contribute to tissue regeneration when
markers of such cells are lacking (Dor et al., 2004).
Hepatocyte labelling specificity
To label hepatocytes – defined here as postnatal cells expressing HNF4α but
not expressing BEC markers – we utilized a recombinant adeno-associated virus
serotype 2/8 expressing Cre recombinase driven by the hepatocyte-specific
promoter (thyroid hormone-binding globulin, AAV8-TBG-Cre) (Figure 2.8 A).
This transduction was highly specific and effective, as all YFP+ labelled cells
expressed HNF4α, a hepatocyte marker (>99%, 3948 YFP+ cells examined, N = 4
mice), while none expressed KRT19, a BEC marker (2056 KRT19+ cells examined,
N=6 mice) (Figure 2.8 A; (Gao et al., 2006; Malato et al., 2011; Wang et al., 2010;
Yanger et al., 2013; Zincarelli et al., 2008)). This labelling pattern was true for liver
analysed 9 months later (Figure 2.8 B). As an additional controlled, R26YFP mice
were administered with AAV8-Cre virus under the control of the ubiquitous
cytomegalovirus (CMV) promoter (AAV8-CMV-Cre). Efficient marking of
hepatocytes (HNF4α+ cells) with no marking of BECs (KRT19+ cells) was observed
under both conditions demonstrating that viral tropism (and not the TBG promoter)
accounts for hepatocyte-specific labelling (Figure 2.8 C-D). Additionally, all YFP+ labelled cells were found to be positive for HNF4α with no labelling of
non-hepatocytes (Figure 2.8 E).
I further confirmed AAV-specificity by fluorescence-activated cell sorting
46
47
Figure 2.8 (A) Hepatocyte labelling was achieved by administrating AAV2/8 viruses
containing Cre recombinase to R26YFPmice under the control of the hepatocyte-specific
thyroid binding globulin (TBG) promoter (AAV8-TBG-Cre) to determine the specificity,
sensitivity, and tropism of viral infection. Immunofluorescent images show specific and
efficient labelling of hepatocytes. Labelling of BECs was never observed following AAV
(right panel, n= 6). (B) AAV8-TBG-Cre also results in persistent specific labelling of
hepatocytes 9 months after infection; again there is no labelling of CK19+ BECs with this virus. (C, D) AAV2/8 viruses containing Cre recombinase under the control of the
ubiquitous cytomegalovirus (CMV) promoter was used to further assess viral tropism.
The images depict YFP+ lineage-labelled cells either 2 weeks (C) or 10-months (D) after injection of AAV8-CMV-Cre virus into R26YFP animals. (E) Additionally, all YFP+ cells
resulting from AAV8-TBG-Cre recombination (3948 cells counted) were HNF4α+. Scale
48
49
Figure 2.9 (A) BEC marker,EpCAM, overlaps and is co-expressed in CK19+ cells.
(B) Uninjected (control) and injected (YFP+) R26YFP animal livers were perfused and stained for EpCAM. Double positive cells for YFP and EpCAM were not
50
previously demonstrated (Okabe et al., 2009) (Figure 2.9). EpCAM overlaps and
marks KRT19+ BECs (Figure 2.9 A). AAV-TBG-Cre injected R26YFP mice were
subjected to liver perfusion and further assessed by FACS to find no overlap
between YFP+ cells and EpCAM+ cells, thus confirming BECs are not transduced.
Hepatocyte pulse-chase outcome
I then subjected lineage-labelled AAV8-TBG-Cre; R26YFP mice (“Pulse”) to
the injury-recovery protocols used previously (“Chase”). Under these conditions,
the percentage of labelled hepatocytes remained unchanged (Figure 2.10 B, C).
Specifically, the labelling index for the pulse group (99.36±0.96%, 11,359 counted)
did not decrease following recovery after DDC (99.31±1.00%, 5830 counted), CDE
(99.83±0.17%, 1838 counted), CCl4 (99.75±0.38%, 1677 counted) or ANIT (100%,
1944 counted). As a control, we performed 2/3 partial hepatectomy which also
showed no change in the YFP labelling index (99.71±0.36%, 695 counted). Thus,
by this sensitive labelling technique, I failed to find evidence that hepatocytes arise
from non-hepatocytes after recovery from multiple models of ADC-inducing
51
52
Figure 2.10 (A) Liver histology (haematoxylin and eosin, left panel) and
immunofluorescence (right panel) of uninjured “pulse” liver. (B) Liver histology
returns to normal following injuries with DDC, CDE, CCl4, ANIT and PH with no
appreciable change in the frequency of hepatocyte labelling. Scale bar=50µm. (C)
Quantification of hepatocyte labelling following AAV injection (“Pulse”) and
recovery from DDC, CDE, CCl4, ANIT and PH injuries. Labelling index was
quantified from 6, 6, 4, 4, 2 and 2 animals for each of the conditions, respectively
(mean ± SD). Absolute numbers of cells counted for pulse and chase are provided
53
2.3 Summary
In this study, I have used two distinct lineage tracing approaches to test the
hypothesis that regeneration from toxin-induced liver damage is mediated by FSCs.
First, I genetically labelled KRT19-expressing BECs and ADCs – the tissue
compartment in which liver stem cells are believed to reside – and found no
evidence that these cells give rise to hepatocytes in the four injury models tested.
Second, we labelled hepatocytes with high efficiency and specificity, and found that
there was no decrease in the labelling index with the same types of injury, a result
that is consistent with the notion that new hepatocytes are derived from pre-existing
hepatocytes.
In addition, in collaboration with Dr. David Knigin in Dr. Eli Pikarsky’s
laboratory at the Hebrew University, Israel, we utilized an unbiased approach using
nucleoside analogue labelling to trace the fate of highly proliferative liver cells.
Stem cells contribute to tissue homeostasis and regeneration by generating
rapidly-dividing progeny – referred to as transient amplifying (TA) cells – which expand
prior to final differentiation (Blanpain et al., 2007). ADCs with their high
proliferative index are characterized as liver TA cells (Alison et al., 2004; Hu et al.,
2007; Jensen et al., 2004). Teta et al. have previously reported that TA cells (Teta et
al., 2007) can be labelled by incorporation of two thymidine analogues (i.e.
dual-labelling) when administered in succession. Adopting these methods for the liver,
we found no evidence that rapidly-dividing non-hepatocytes differentiated into
54
suggest that ADCs and other non-hepatocyte populations do not contribute
significantly to hepatocyte neogenesis during liver regeneration, complementing the
results from our genetic approaches.
Our results do not eliminate the possibility that under more demanding
circumstances ADCs could exhibit bipotency. Likewise, we cannot rule out the
possibility that our lineage labelling techniques have labelled a small subset of
hepatocyte-like cells that remain multipotent. However, the finding that all cells labelled
with AAV8-TBG-Cre (out of nearly four thousand examined) exhibit a mature
hepatocyte phenotype argues against this possibility. Moreover, IdU/CldU labelling
experiments failed to reveal such a rapidly dividing (and expanding) subset of
hepatocytes. Thus, our data are most consistent with a scenario in which ADCs play a
very minor, if any, role undetectable using our tools with new adult hepatocytes coming
from pre-existing hepatocytes, not only following partial hepatectomy but in the setting
of toxin injuries as well.
Finally, these conclusions have not fully addressed the data from electron
microscopy studies which reveal that following injury with hepatotoxins, cells with
ultrastructural features of both ductular cells and hepatocytes, a “transitional” cell
phenotype, emerge within the liver lobule (Factor et al., 1994). Due to their median size
compared to other ADCs and hepatocytes, and variable nucleocytoplasmic rations,
mitochondrial content, and glycogen rosettes, these observations allude to ADCs being a
55
exhibiting features “between” hepatocytes and BECs will be addressed in the next
56
3 ROBUST CELLULAR REPROGRAMMING DURING LIVER
REGENERATION2
2 This chapter, with modifications, has been published: Yanger, K., Zong, Y., Maggs, L.R., Shapira, S.N.,
57
3.1 Introduction
In adult tissues, rates of cell birth and death are tightly controlled to
maintain tissue mass. During amphibian regeneration, de-differentiation and/or
transdifferentiation is a major source of new cells (Nacu and Tanaka, 2011). By
contrast, mammalian regeneration is driven by the replication of existing cells or
differentiation from stem cells. Transdifferentiation, or cellular reprogramming, has
been observed in mammals following the introduction of defined factors in vivo
(Xie et al., 2004; Zhou et al., 2008), but spontaneous inter-conversion of
differentiated cells seems to occur only in the setting of strong selective pressure
(Thorel et al., 2010). “Metaplasia” – a condition in which the replacement of one
tissue type with another predisposes to cancer – may involve cellular
reprogramming, but the connection between metaplasia at the tissue level and
transdifferentiation at the cellular level remains unresolved (Slack, 2009).
The mammalian liver is exceptional among regenerative organs in that the
mode of injury is thought to dictate the cellular mechanism of recovery. Following
partial removal of the liver (partial hepatectomy; PHx), liver mass is restored by
replication and/or growth of existing cells (Miyaoka et al., 2012), whereas
following toxin-mediated injury, animals and humans exhibit an accumulation of
atypical ductal cells (ADCs) within the liver, often referred to as “oval cells”
(Farber, 1956; Popper et al., 1957). In this study, we sought to determine whether
58
3.2 Results
3.2.1 Notch mediated reprogramming
In new-born mice, immature hepatocytes remain responsive to Notch signals
and undergo a fate switch, becoming biliary epithelial cells (BECs) upon ectopic
activation of the pathway (Zong et al., 2009). To determine whether this plasticity
and competence was true in the adult animal, we induced Notch signalling in adult
hepatocytes. We bred R26YFP mice to R26NICD mice, which harbour a Cre-inducible
constitutively active form of Notch1 (Murtaugh et al., 2003; Zong et al., 2009).
Next, we simultaneously labelled cells and induced Notch signalling using the same
AAV8-TBG-Cre virus. As predicted, infection of bigenic R26NICD/YFP mice with
AAV8-TBG-Cre resulted in the activation of Notch signalling (assessed by Hes1
expression) in more than 95% of hepatocytes. Over the course of Notch signalling,
lineage-labelled cells started to express KRT19 and by 6 weeks, 23% of all KRT19
cells were YFP+. Hence, adult hepatocytes retain this plasticity and ectopic
activation of Notch signalling is sufficient to reprogram a subset of hepatocytes into
BEC-like cells (Yanger et al., 2013).
3.2.2 Injury mediated reprogramming
Injury induced “intermediate cells”
Toxic liver injuries result in an atypical ductal cell (ADC) or “oval cell”
response. ADCs have a biliary phenotype, but their arrangement into an intricate
anastomosing configuration that extends into the hepatic lobule gives them a
59
noted that the reprogrammed BEC-like cells resulting from Notch activation
resembled ADCs, prompting us to hypothesize that some ADCs might be
hepatocyte-derived. To test this possibility, I administered AAV8-TBG-Cre to
R26YFP mice and, following a washout period, treated animals with the hepatotoxin
DDC (3,5-diethoxycarbonyl-1,4-dihydrocollidine). As previously shown, DDC
treatment was associated with a robust ADC response during which a substantial
fraction of hepatocytes and BECs underwent turnover. Within 1-2 weeks of DDC
exposure, cells that co-stained with biliary and hepatocyte markers were readily
detectable. These bi-phenotypic “intermediate” cells were most abundant in
peri-portal regions and many were binucleated (for example, 41% of A6+HNF4α+ cells
had two nuclei; Figure 3.1 A). Staining for the YFP lineage marker demonstrated
that these intermediate cells were of hepatocyte origin, appearing within 2 weeks
(Figure 3.1 B)
Conversion of hepatocytes into mature BECs
After 2-3 weeks of DDC treatment, YFP-labelled hepatocytes started
expressing the mature BEC marker, KRT19. YFP+ KRT19lo cells (weak KRT19
expression) appeared first at this time point (Figure 3.2A). After 6 weeks of DDC
treatment, a time-point when ADCs were most plentiful, I observed that many YFP+
cells had assumed a biliary morphology and co-stained with OPN, A6, Sox9, or
KRT19 (Figure 3.3 A). At this time-point, YFP+ cells with strong KRT19 staining
60
61
Figure 3.1 (A) Mice treated with DDC for 1 week exhibit co-staining with a hepatocyte
marker (HNF4α and one of three biliary markers (OPN, Sox9, A6). Double positive cells
have a hepatocyte morphology (arrowheads) and many are binucleated (arrows). The
images are representative of multiple experiments. (B) “Intermediate” cells emerge early
following treatment with DDC (2 weeks). Most YFP+ cells with co-staining for the
biliary markers Sox9, OPN, or A6 (arrowheads) retain a hepatocyte morphology at this
62
63
Figure 3.2 (A) Hepatocyte-derived CK19+ cells following injury (6 weeks of DDC) can be divided into CK19lo cells and CK19hi cells based on the intensity of staining
(arrowheads denote CK19lo and arrow denotes CK19hi). (B) All CK19lo cells are YFP+ (100%), while a fraction of CK19hi cells are also YFP+ (4.4%) (N=4 animals). CK19lo cells are never observed in control livers and appear early in the injury process (after 2-3
64
65
Figure 3.3 (A) Co-staining of the biliary markers (i) OPN, (ii) Sox9, (iii) A6 and (iv)
CK19 with the YFP lineage label is observed following DDC treatment (6 weeks), BDL
(2 weeks), or PHx (2 weeks); co-stained cells are denoted with arrowheads. Note that
many of the co-stained cells are smaller than neighbouring hepatocytes. (B) Biliary
markers are induced in a stepwise fashion following injury. The percentage of marker+
cells (i.e. cells that stained positive for OPN, Sox9, A6, or CK19) which co-express the
YFP lineage label is shown. Both CK19hi and CK19lo cells were included in the analysis. Double positive cells were not detected in vehicle-treated livers. Each bar represents the
mean (+/- SE) of at least 3 mice; a minimum of 950 marker+ cells were examined for