R E S E A R C H A R T I C L E
Open Access
Self-rated oral health status, oral health service
utilization, and oral hygiene practices among
adult Nigerians
Adeyemi Oluniyi Olusile
1*†, Abiola Adetokunbo Adeniyi
2†and Olufemi Orebanjo
3†Abstract
Background:There is scarce information available on oral health service utilization patterns and common oral hygiene practices among adult Nigerians. We conducted the 2010–2011 national oral health survey before the introduction of the national oral health policy to determine the prevalence of oral health service utilization, patterns of oral hygiene practices, and self reported oral health status, among adults in various social classes, educational strata, ethnic groups and geopolitical zones in Nigeria.
Methods:We conducted a cross-sectional survey in North-Central, North-West, South-East, South-South and South-West geopolitical zones of Nigeria. Multi-stage cluster sampling method was used for the sample selection. We administered a structured questionnaire to a total of 7,630 participants. Information on the socio-demographic characteristics, oral hygiene practices and oral health services utilization pattern of participants was obtained. Results:We interviewed 7, 630 participants (55.6% female). The participants ages ranged between 18 and 81 years, mean age was 37.96 (SD = 13.2). Overall 21.2% of the participants rated their oral health status as very good, 37.1% as good and 27.4% as fair. Only 26.4% reported having visited the dentist at least once prior to the conduct of the survey. More than half of these visits (54.9%) were for treatment purpose. Utilization of oral health services was significantly (p < 0.05) associated with being older, more educated and being engaged in a skilled profession. More educated persons, females and younger persons used toothbrushes for daily tooth cleaning. Age, sex, marital status, level of education and occupation were significantly related to daily frequency of tooth cleaning (p < 0.05).
Conclusion:Our results show that while most Nigerian adults have a positive view of their oral health status, majority reported poor oral health utilization habits. Older persons resident in the northern zones of the country and less educated persons displayed poorer oral hygiene practices. The study findings suggest that there is low oral health service utilization among adult Nigerians and that socio-demographic variables influence oral health utilization habits and oral hygiene behavior among adult Nigerians Further studies to identify other factors influencing oral health behavior are suggested.
Keywords:Socio-demographic factors, Oral health, Oral hygiene, Toothbrushing, Dental attendance, Nigerians
* Correspondence:niyiolusile@yahoo.co.uk †Equal contributors
1
Department of Restorative Dentistry, Faculty of Dentistry, Obafemi Awolowo University, Ile-Ife, Osun State, Nigeria
Full list of author information is available at the end of the article
Background
Oral health is an important tool for achieving good gen-eral health [1]. Oral diseases and disorders often result in physical discomfort, pain, infection and sometimes tooth loss [2]. They also frequently cause difficulty in chewing; swallowing; speaking, and can disrupt sleep and product-ivity [1,2]. Consequently, oral diseases and disorders not only affect the victim’s life as well as their social networks, the community at large and productivity of the citizens at the national level [2-4].
The promotion of good oral hygiene at the population level is advocated and supported by the World Health Organisation (WHO) and the International Federation of Dentists (FDI) [5-8]. The adoption of preventive strat-egies both at the individual and population level helps reduce the negative impact of oral diseases including im-proving quality of life. One critical tool identified for achieving good oral health is the institution of effective and efficient oral hygiene practices [1,5,9]. The value of good oral hygiene practices has increased over the years.
Research indicates that the removal of bacteria plaque is essential for the prevention of the two most prevalent dental conditions namely dental caries and periodontal disease [5,9]. To achieve and maintain good oral hygiene, and prevent dental caries regular tooth brushing using fluoride containing toothpaste at least twice a day is recommended. [8] The use of dental floss for cleaning of interproximal surfaces is also crucial for effective plaque removal [7,8].
In Nigeria, information on oral health service utilization patterns and common oral hygiene practices among adult Nigerians is sparse. Most of the available information is from research localized to south west Nigeria or to spe-cific sub-populations such as pregnant women and school going children [10-12]. Research reports have consistently confirmed that a large proportion (more than 70%) of adult Nigerians have periodontal disease [11,13], a condi-tion strongly associated with oral hygiene status. Although in the last two decades reports using the decayed, missing and filled teeth (DMFT) index, show a low dental caries prevalence of 10% to 20%, dental caries remain a public health concern because most carious lesions remain untreated [10-13]. Reports also indicate poor awareness of oral health, irregular tooth brushing and generally poor oral hygiene among Nigerians [10,13]. Other data indi-cates that very few Nigerians (less than 20%) visit a dentist regularly [10-12]. This may be related to the inadequate number and poor geographical distribution of oral health care providers countrywide; factors which do not favor adequate access to oral health care services [10,12].
Elsewhere evidence shows that oral health care utilization patterns and oral hygiene habits are influenced by socio-demographic characteristics [2,3]. Persons with higher education and a higher social economic status have been
reported to exhibit better oral hygiene habits and oral health utilization habits [2,3,14-16]. However, the effect of socio-demographic characteristics on oral health service utilization in Nigeria is not documented. To our know-ledge this is the first national survey conducted to assess the oral health service utilization pattern and oral hygiene practices of adult Nigerians.
This survey was conducted before the introduction of the national oral health policy in Nigeria [12] with an overall goal to provide veritable information for the implementation, monitoring and evaluation of the pro-posed national oral health policy. The study also aimed at determining the association between socioeconomic status, educational status, ethnic groups and geopolitical zones in Nigeria with the prevalence of oral health service utilization and pattern of oral hygiene practices among adults in Nigeria.
Methods Study design
The study was carried out between Jan 2010 and June 2011. The study was population based and using a rapid assessment survey method. This approach was adopted because there was limited time and resources for col-lecting the data before the introduction of the national oral health policy. The survey tool was a questionnaire to assess the oral health service utilization and pattern of oral hygiene practices of participants. The survey tool was administered in person and had a target length of fifteen minutes. It was developed and refined by the au-thors with input from Dentists in other parts of the country. It was designed for ease of use with minimal interviewer training.
Study population
The estimated total population of Nigeria at the time of conducting this study was 159 million, out of which 54.94% are aged 18 to 64 years while 3% are aged 65 years and older [17]. The target population for this survey was approximately 92 million persons aged 18 years and older.
Study location
Sampling method
We used a multi-stage cluster sampling method to conduct this survey. Five states in the north-eastern geo-political zone that were experiencing socio-political problems (namely Adamawa, Zamfara, Plateau, Borno, and Yobe) during the data collection period were excluded from the sampling frame. Eighteen out of the remaining 31 States were randomly selected for the study. The selected states included Abia, Anambra, Bayelsa, Benue, Ekiti, Enugu, Imo, Kaduna, Kano, Kogi, Kwara, Lagos, Nasarawa, Niger, Ogun, Ondo, Osun and Oyo. One LGA per three senatorial districts in each of the 18 states was randomly selected using the list of LGA’s in the state as the sampling frame. In total, 54 LGA’s were visited during data collection.
Sample selection
The research assistants were dentists resident in each of the selected states. They regularly met with the health care team in the selected LGA to obtain permission to conduct the study. Before the visit, community leaders were informed of the proposed study, their consent sought and they were encouraged to mobilise partici-pants from their locality for the study. Participartici-pants were sequentially recruited based on the following criteria: must be an 18 years or older, should reside in the LGA and be willing to participate in the research. Subjects 18 years and below or who were unwilling to participate were excluded from the study.
Data collection
Data collection was done in a central location in the com-munity (local government headquarters or town hall). Data on demographic characteristics, oral health service utilisation, patterns of oral hygiene practices, and self-reported oral health status were collected using a struc-tured questionnaire. The occupation was recoded for data entry using the UK registrar’s occupation classification [18] while age was recoded using the decades of life. The second section asked questions on oral hygiene practices and oral health services utilization patterns. Under oral hygiene practices, we specifically enquired about the tools used for cleaning the mouth, frequency of daily mouth cleaning, use of adjunct tools such as dental floss and mouthwash and the estimated duration of mouth clean-ing. Under oral health service utilization, we enquired about history of previous visits to oral health care units and reasons for those visits.
Literate participants completed the questionnaire per-sonally while trained interviewers assisted illiterate sub-jects using pidgin English (a local form of English in the country) or one of the three main languages in the coun-try. The survey instrument was translated and back trans-lated to pidgin and three other major languages including
Yoruba, Ibo and Hausa. The translated versions were used during the training and standardization of the inter-viewers. Interviewers used the translated versions strictly for illiterate persons. The questionnaire was pretested to ensure simplicity and ease of understanding by the partici-pants. Changes were made to the questionnaire before data collection.
Ethical considerations
Ethical clearance for the study was obtained from the Ethical Review Committee of the College of Health Sciences Obafemi Awolowo University Ile-Ife Nigeria. In addition, permissions to conduct the study were also obtained from the chairpersons of all the selected LGAs, through the directors of primary health care. The re-searchers explained to all study participants the scope, aims and objectives of the study as well as their rights to participate or withdraw from the study with no penalty. All study participants gave verbal consent and were assured that their confidentiality would be maintained.
Data analysis
Data entry and analysis was done using SPSS statistical software version 16.0. Univariate analysis was carried out; means, standard deviation were computed for quan-titative variables and frequency distributions generated for qualitative variables. Bivariate analysis to identify asso-ciations between oral hygiene habits (i.e. the dependent variables namely frequency of tooth brushing, tool used and duration of toothbrushing) and sex, age, geo-political zone, and educational status (the independent variables) of the study participants was also carried out. The chi-squared test was used as test of significance for comparing proportions for more than 2 groups while the fishers exact was used for comparing differences in proportion between two groups. The student t-test was used to compare differ-ences in age. Logistic regression analysis was conducted to identify factors independently associated with adequate tooth brushing frequency in the population (defined as brushing two or more times daily). Associations were con-sidered significant when the p-values were equal or less than 0.05.
Results
Perception of oral health status and oral health service utilization patterns
Overall 21.2% of the participants rated their oral health status as very good, 37.1% as good, 27.4% as fair, 9.0% as poor or very poor while the remaining were not sure of their oral health status. Only 26.4% reported having vis-ited the dentist prior to the conduct of this survey. More than half of these visits (54.9%) were for treatment, 24.9% were for check-up only and the remaining partici-pants reported visiting for both treatment and check-up.
Oral hygiene practices
The oral hygiene tool used by the largest proportion of participants was the toothbrush and toothpaste (81% of participants). Other tools used included chewing stick (9.6%), salt (0.6%), water only (0.5%) and cotton wool (0.3%). Some participants (5.6%) reported using multiple tools. The commonest combination used was the tooth-brush and chewing stick (81.4% of those who used multiple tools).
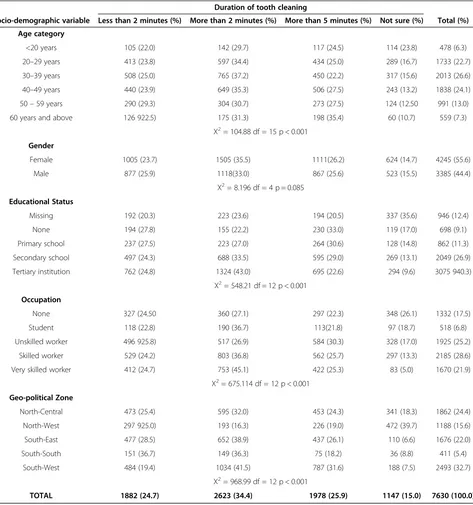
About 20% of the participants reported using fluoride-containing toothpastes, 10.5% used toothpastes without fluoride while the remaining (69.6%) was unsure of the fluoride content of their dentifrice. Only 10.5% of the participants reported using dental floss or other oral hy-giene aids such as mouthwashes. Also, 42.0% of partici-pants reported cleaning their mouth twice daily while 37.1% clean their mouth once a day. Participants also reported on the amount of time spent cleaning their mouths: 24.7% spend 1–2 minutes, 34.4% spend between 3 and 4 minutes, 25.9% spend more than 5 minutes while the remaining were uncertain.
Association between socio-demographic features, oral health service utilization and oral hygiene practices
Persons in older age categories (i.e. 50 years and older) reported having visited the dentist before this study was conducted significantly more than those in the younger age categories (p < 0.001). Similarly, persons who had more education i.e. tertiary education (p < 0.001) as well as persons in more skilled professions (p < 0.001) re-ported significantly more utilization of oral health services (Table 2). Sex and geopolitical zoning were not significantly associated with previous utilization of oral health services. The use of toothbrush was significantly related to age (p < 0.001), sex (p < 0.001), educational status (p < 0.001), and occupation (p < 0.001). Younger persons (p < 0.001), females (p < 0.001) and more educated persons (p < 0.001) used toothbrushes for daily tooth cleaning. Similarly all the socio-demographic characteris-tics were significantly related (p < 0.001) to daily frequency of tooth cleaning (Table 3). Table 4 displays the relation-ship between duration of mouth cleaning and socio demo-graphic characteristics. Sex was not significantly related to the duration of tooth cleaning. The relationship between duration of tooth cleaning and the tool used was signifi-cant (p < 0.001), persons using toothbrush reported significantly less tooth cleaning time than those using other tools.
Regression analysis indicates that the relationship be-tween the socio-demographic characteristics of the study population and their frequency of tooth cleaning was significant (p <0.001). Persons with 12 or more years of education were 15.7% more likely to clean their teeth at least twice daily; those from the southern part of the
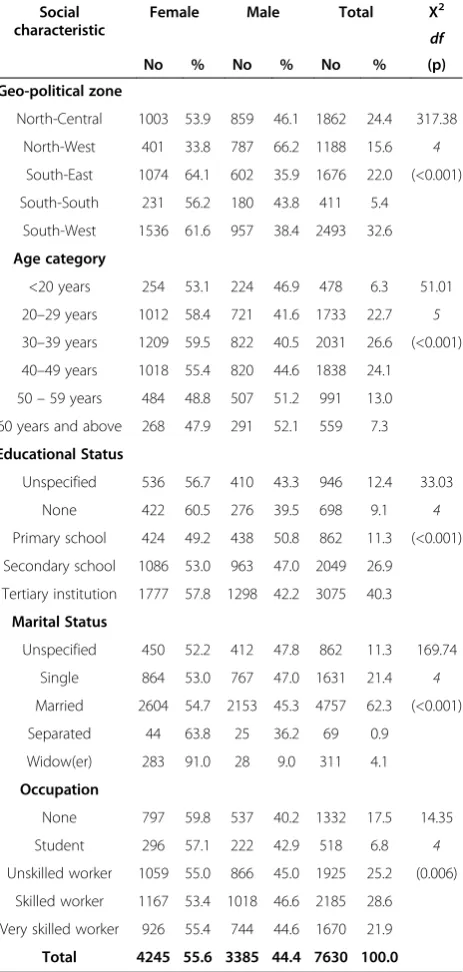
Table 1 Showing socio-demographic characteristics of participants by gender
Social characteristic
Female Male Total Χ2
df
(p)
No % No % No %
Geo-political zone
North-Central 1003 53.9 859 46.1 1862 24.4 317.38
North-West 401 33.8 787 66.2 1188 15.6 4
South-East 1074 64.1 602 35.9 1676 22.0 (<0.001)
South-South 231 56.2 180 43.8 411 5.4
South-West 1536 61.6 957 38.4 2493 32.6
Age category
<20 years 254 53.1 224 46.9 478 6.3 51.01
20–29 years 1012 58.4 721 41.6 1733 22.7 5
30–39 years 1209 59.5 822 40.5 2031 26.6 (<0.001)
40–49 years 1018 55.4 820 44.6 1838 24.1
50–59 years 484 48.8 507 51.2 991 13.0
60 years and above 268 47.9 291 52.1 559 7.3
Educational Status
Unspecified 536 56.7 410 43.3 946 12.4 33.03
None 422 60.5 276 39.5 698 9.1 4
Primary school 424 49.2 438 50.8 862 11.3 (<0.001)
Secondary school 1086 53.0 963 47.0 2049 26.9
Tertiary institution 1777 57.8 1298 42.2 3075 40.3
Marital Status
Unspecified 450 52.2 412 47.8 862 11.3 169.74
Single 864 53.0 767 47.0 1631 21.4 4
Married 2604 54.7 2153 45.3 4757 62.3 (<0.001)
Separated 44 63.8 25 36.2 69 0.9
Widow(er) 283 91.0 28 9.0 311 4.1
Occupation
None 797 59.8 537 40.2 1332 17.5 14.35
Student 296 57.1 222 42.9 518 6.8 4
Unskilled worker 1059 55.0 866 45.0 1925 25.2 (0.006)
Skilled worker 1167 53.4 1018 46.6 2185 28.6
Very skilled worker 926 55.4 744 44.6 1670 21.9
country were 5.2% more likely to brush at least twice daily. With every year increase in age there was 1.7% re-duction in the likelihood of twice daily cleaning. While a previous dental visit or exposure to oral health education also increased the likelihood of twice-daily tooth cleaning by 42.3% (Table 5).
Discussion
This is the first national study to be conducted on oral health care service utilization and oral hygiene practices
among adult Nigerians resident in the different geopolit-ical regions. Most of the earlier studies have been local-ized to specific regions in the country or have targeted specific populations such as pregnant women or school children [19-22]. Our results reveal that adult Nigerians view their oral health status positively but have poor regular oral health utilization habits and oral hygiene habits. A good number of the participants do not clean twice their teeth daily (52.0%) or brush for at least two minutes each time (39.7%).
Table 2 Showing the relationship between socio-demographic features, dental attendance and oral hygiene tools used
Have you ever been to a dentist? Oral hygiene tools used Total (%)
Socio-demographic variable Yes (%) No (%) Toothbrush (%) Other tools (%)
Age category
<20 years 86 (18.0) 392 (82.0) 440 (92.1) 38 (7.9) 478 (6.3)
20–29 years 352 (20.3) 1381 (79.7) 1520 (87.7) 213 (12.3) 1733 (22.7)
30–39 years 512 (25.2) 1519 (74.8) 1680 (82.7) 351 (17.3) 2031 (26.6)
40–49 years 559 (30.4) 1279 (69.6) 1454 (79.1) 384 (20.9) 1838 (24.1)
50–59 years 338 (34.1) 653 (65.9) 733 (74.0) 258 (26.0) 991 (13.0)
60 years and above 169 (30.2) 390 (69.8) 336 (60.1) 223 (39.9) 559 (7.3)
Χ2= 101.64 p < 0.001
Χ2= 284.35 p < 0.001
Gender
Female 1144 (26.9) 3161 (73.1) 3582 (84.4) 663 (15.6) 4245 (55.6)
Male 872 (25.8) 2513 (74.2) 2581 (76.2) 804 (23.8) 3385 (44.4)
p = 0.250 p < 0.001
Educational Status
Unspecified 226 (23.9) 720 (76.1) 736 (77.8) 210 (22.2) 946 (12.4)
None 133 (19.1) 565 (80.9) 424 (60.7) 274 (39.3) 698 (9.1)
Primary school 219 (25.4) 643 (74.6) 587 (68.1) 275 (31.9) 862 (11.3)
Secondary school 467 (22.8) 1582 (77.2) 1674 (81.7) 375 (18.3) 2049 (26.9)
Tertiary institution 971 (31.6) 2104 (68.4) 2742 (89.2) 333 (10.8) 3075 (40.3)
Χ2= 78.99 p < 0.001
Χ2= 415.61 p < 0.001
Occupation
Unspecified 317 (23.8) 1015 (76.2) 1028 (77.2) 304 (22.8) 1332 (17.5)
Student 90 (17.4) 428 (82.6) 463 (89.4) 55 (10.6) 518 (6.8)
Unskilled worker 432 (22.4) 1493 (77.6) 1355 (70.4) 570 (29.6) 1925 (25.2)
Skilled worker 622 (28.5) 1563 (71.5) 1851 (84.7) 334 (15.3) 2185 (28.6)
Very skilled worker 555 (33.2) 1115 (66.8) 1466 (87.8) 204 (12.2) 1670 (21.9)
Χ2= 86.77 p < 0.001
Χ2= 244.17 p < 0.001
Geo-political Zone
North-Central 488 (26.2) 1374 (73.8) 1652 (88.7) 210 (11.3) 1862 (24.4)
North-West 336 (28.3) 852 (71.7) 775 (65.2) 413 (34.8) 1188 (15.6)
South-East 459 (27.4) 1217 (72.6) 1302 (77.7) 374 (22.3) 1676 (22.0)
South-South 108 (26.3) 303 (73.7) 352 (85.6) 59 (14.4) 411 (5.4)
South-West 625 (25.1) 1868 (74.9) 2082 (83.5) 411 (16.5) 249 (32.7)
Χ2= 53.1 p = 0.257
Χ2= 289.06 p < 0.001
A good proportion (58.3%) of the study participants viewed their oral health status as good or very good. This perception may explain the apathy displayed towards oral health service utilization as just over a quarter of the participants had ever visited a dentist. Anecdotal reports suggest that Nigerians generally asso-ciate not visiting a health facility with good health and similarly not visiting a dentist with good oral health. Therefore, it is common to visit the dentist only when they have symptoms that have not responded to home
therapies. Furthermore, there is a tendency for adults to initially seek the attention of alternative health care practitioners before visiting a health facility. This in our view may explain the low utilization rates recorded. However, it is worth noting that the fact that oral health services are not readily available in all communities may limit the utilization of oral health services by most Nigerians [10-12].
We recorded a higher percentage (26.4%) of previous dental visits in this study than has been reported previously
Table 3 Showing the relationship between socio-demographic features and daily frequency of tooth cleaning
Socio-demographic variable
Daily frequency of tooth cleaning Total (%)
Varies (%) Not daily (%) Once (%) Twice (%) More than twice (%)
Age category
<20 years 74 (15.5) 3 (0.6) 131 (27.4) 234 (49.0) 36 (7.5) 478 (6.3)
20–29 years 277 (16.0) 21 (1.2) 546 (31.5) 786 (45.4) 103 (5.9) 1733 (22.7)
30–39 years 306 (15.0) 16 (0.8) 770 (37.9) 830 (40.9) 111 (5.5) 2031 (26.6)
40–49 years 220 (12.0) 20 (1.1) 696 (37.9) 824 (44.8) 78 (4.2) 1838 (24.1)
50–59 years 123 (12.4) 15 (1.5) 435 (43.9) 346 (34.9) 72 (7.3) 991 (13.0)
60 years and above 57 (10.2) 10 (1.8) 254 (45.4) 187 (33.5) 51 (9.1) 559 (7.3)
Χ2= 137.13 df = 20 p < 0.001
Gender
Female 569 (13.4) 23 (0.5) 1550 (36.5) 1906 (45.0) 197 (4.6) 4245 (55.6)
Male 486 (14.4) 62 (1.8) 1282 (37.9) 1301 (38.4) 254 (7.5) 3385 (44.4)
Χ2= 75.14 df = 4 p < 0.001
Educational Status
Unspecified 44 (4.7) 11 (1.2) 285 (30.1) 399 (42.2) 44 (4.7) 946 (12.4)
None 52 (7.4) 23 (3.3) 270 (38.7) 245 (35.1) 52 (7.4) 698 (9.1)
Primary school 51 (5.9) 9 (1.0) 363 (42.1) 307 (35.6) 51 (5.9) 862 (11.3)
Secondary school 143 (7.4) 28 (1.4) 701 (34.2) 896 (43.7) 143 (7.0) 2049 (26.9)
Tertiary institution 161 (5.2) 14 (0.5) 1213 (39.4) 1360 (44.2) 161 (5.2) 3075 (40.3)
Χ2= 173.72 df = 16 p < 0.001
Occupation
Unspecified 274 (20.60 13 (1.0) 439 (33.0) 530 (39.8) 76 (5.7) 1332 (17.5)
Student 98 (18.9) 2 (0.4) 159 (30.7) 233 (45.0) 26 (5.0) 518 (6.8)
Unskilled worker 301 (15.6) 43 (2.2) 713 (37.0) 753 (39.1) 113 (6.0) 1925 (25.2)
Skilled worker 314 (14.4) 17 (0.8) 804 (36.8) 901 (41.2) 149 (6.8) 2185 (28.6)
Very skilled worker 68 (4.1) 10 (0.6) 717 (42.9) 790 (47.3) 85 (5.1) 1670 (21.9)
Χ2= 254.95 df = 16 p < 0.001
Geo-political Zone
North-Central 306 (16.4) 13 (0.7) 617 (33.1) 832 (44.7) 94 (5.0) 1862 (24.4)
North-West 258 (21.7) 36 (3.0) 305(25.7) 483 (40.7) 106 (8.9) 1188 (15.6)
South-East 73 (4.4) 24 (1.4) 666 (39.7) 784 (46.8) 129 (7.7) 1676 (22.0)
South-South 13 (3.2) 8 (1.9) 172 (41.8) 195 (47.4) 23 (5.6) 411 (5.4)
South-West 405 (16.2) 4 (0.2) 1072 (43.0) 913 (36.6) 99 (4.0) 2493 (32.7)
Χ2= 439.3 df = 16 p < 0.001
[23]. Differences in the results obtained may be because the earlier study was conducted at household level and was restricted to one town in south west Nigeria. However, oral health service utilization rates in our study were lower than previously reported in other countries [24-26]. A pattern of not visiting the dentist regularly has been reported among various groups in Nigeria [11-13,18,19,21,22] indicating a need to actively promote the utilization of dental services in the country as part of a strategy for achieving good over-all health. One suggested approach for achieving increased
utilization of dental services is the institution of national guidelines regarding dental visits e.g. integration of oral health into other essential medical services such as ante-natal and postante-natal care, as well as services for medically compromised persons and the elderly.
We also observed that age group, educational status and occupational status were associated with utilization of dental services, a finding reported in other countries [27,28]. The fact that older persons reported significantly more previous dental visits than younger persons was
Table 4 Showing the relationship between socio-demographic features and duration of tooth cleaning
Duration of tooth cleaning
Socio-demographic variable Less than 2 minutes (%) More than 2 minutes (%) More than 5 minutes (%) Not sure (%) Total (%)
Age category
<20 years 105 (22.0) 142 (29.7) 117 (24.5) 114 (23.8) 478 (6.3)
20–29 years 413 (23.8) 597 (34.4) 434 (25.0) 289 (16.7) 1733 (22.7)
30–39 years 508 (25.0) 765 (37.2) 450 (22.2) 317 (15.6) 2013 (26.6)
40–49 years 440 (23.9) 649 (35.3) 506 (27.5) 243 (13.2) 1838 (24.1)
50–59 years 290 (29.3) 304 (30.7) 273 (27.5) 124 (12.50 991 (13.0)
60 years and above 126 922.5) 175 (31.3) 198 (35.4) 60 (10.7) 559 (7.3)
Χ2= 104.88 df = 15 p < 0.001
Gender
Female 1005 (23.7) 1505 (35.5) 1111(26.2) 624 (14.7) 4245 (55.6)
Male 877 (25.9) 1118(33.0) 867 (25.6) 523 (15.5) 3385 (44.4)
Χ2= 8.196 df = 4 p = 0.085
Educational Status
Missing 192 (20.3) 223 (23.6) 194 (20.5) 337 (35.6) 946 (12.4)
None 194 (27.8) 155 (22.2) 230 (33.0) 119 (17.0) 698 (9.1)
Primary school 237 (27.5) 223 (27.0) 264 (30.6) 128 (14.8) 862 (11.3)
Secondary school 497 (24.3) 688 (33.5) 595 (29.0) 269 (13.1) 2049 (26.9)
Tertiary institution 762 (24.8) 1324 (43.0) 695 (22.6) 294 (9.6) 3075 940.3)
Χ2= 548.21 df = 12 p < 0.001
Occupation
None 327 (24.50 360 (27.1) 297 (22.3) 348 (26.1) 1332 (17.5)
Student 118 (22.8) 190 (36.7) 113(21.8) 97 (18.7) 518 (6.8)
Unskilled worker 496 925.8) 517 (26.9) 584 (30.3) 328 (17.0) 1925 (25.2)
Skilled worker 529 (24.2) 803 (36.8) 562 (25.7) 297 (13.3) 2185 (28.6)
Very skilled worker 412 (24.7) 753 (45.1) 422 (25.3) 83 (5.0) 1670 (21.9)
Χ2= 675.114 df = 12 p < 0.001
Geo-political Zone
North-Central 473 (25.4) 595 (32.0) 453 (24.3) 341 (18.3) 1862 (24.4)
North-West 297 925.0) 193 (16.3) 226 (19.0) 472 (39.7) 1188 (15.6)
South-East 477 (28.5) 652 (38.9) 437 (26.1) 110 (6.6) 1676 (22.0)
South-South 151 (36.7) 149 (36.3) 75 (18.2) 36 (8.8) 411 (5.4)
South-West 484 (19.4) 1034 (41.5) 787 (31.6) 188 (7.5) 2493 (32.7)
Χ2= 968.99 df = 12 p < 0.001
not surprising. Older persons tend to have more dental problems [2,27,28], since most of the reported visits were sequel to the onset of dental symptoms it can inferred that the visits were made by older persons. As expected, more educated persons and more skilled workers also reported higher prevalence of previous dental visits than those with less education and those in less skilled professions. How-ever gender and geo-political zone were not related to previous dental visits.
Majority of the participants reported using toothbrushes for cleaning. Generally, a higher proportion of older persons utilized other tools especially the chewing stick for cleaning. This finding may be an indication of a shift towards the use of modern tools such as the toothbrush among Nigerian adults. Persons in the younger age groups may have been influenced by information obtained from school and the media as they had received more education and more were engaged in skilled professions. In addition, there were more younger persons in some geo-political zones that in others. This was confirmed by the statisti-cally significant effect of the sex, educational status, occupation and geopolitical zoning on the tools used for mouth cleaning.
An interesting finding in our study was the fact that many participants using toothpaste were unaware of the fluoride content of their dentrifice. This is less than sat-isfactory and should be addressed urgently. It is import-ant for people to be able to correctly determine the amount of fluoride they require based on the fluoride content of their water and dentrifices. Although a large number of the dentrifices available in the Nigerian mar-ket contain fluoride, there are areas with high levels of fluoride in Nigeria [29] and persons resident in such areas would require lower levels of fluoride in their dentrifices. The lack of knowledge displayed could on one hand result in worse cases of fluorosis in endemic areas or caries in areas where fluoride is inadequate.
A few participants reported using items such as cotton wool, water and salt for mouth cleaning. This is similar
to other findings [19,20,22], which indicate that a variety of items are used for oral hygiene among Nigerians. There is no scientific evidence on the efficacy of such tools and promotion of their use should be done with caution. The use of other aids such as dental floss and mouthwash was not very common. This is probably because they are not readily available in many parts of the country espe-cially in the rural communities. There is need to increase the availability of these tools as a step towards promoting their use countrywide.
It was surprising to note that more than a third of the participants reported twice-daily mouth cleaning. This is higher than has been observed in previous studies [19-22] but lower that what is reported in other countries [24,25,30]. Interestingly, all socio-demographic character-istics examined namely age; educational status and geo-political zoning were significantly related to frequency of tooth-brushing. Accordingly, we suggest that efforts at promoting good oral hygiene should focus on older persons and persons with less education as they are more likely to have poor oral hygiene practices. A finding also reported in earlier studies [19,20,22]. A more sustainable and productive approach may be the promotion of good oral hygiene habits early in life. This is because habits are formed early in life and become difficult to change later in life [31]. This approach is likely to yield better results in the long term. The finding that oral hygiene practices were generally poorer in the northern zones may be unconnected with lower literacy levels in the region [17]. Therefore increased exposure to education may lead to increased oral health awareness in the region.
This study is not without limitations, the major limita-tion is its dependence on self-reported informalimita-tion; such information is often subject to response bias due to the different interpretations individuals can give to the ques-tions [32]. Also, the responses may have been influenced by the social acceptability of their responses [33]. Another possible source of bias was the fact the survey was conducted in a predetermined location (often the local government headquarters), thus increasing the possibility of excluding persons who are unable to reach the specified location. This was especially noticeable in the south-south geopolitical zone, which comprises many riverine commu-nities accessible only via the waterways. A better approach would have been the conduct of household surveys to re-duce bias. The absence of clinical oral health data to com-pare the impact of perceived and normative oral health status limits the applicability of the results. Despite these limitations, the large sample size as well as the wide national coverage makes this data invaluable and the study provides veritable information on the oral health service utilization and common oral hygiene practices among adult Nigerians as well as socio-demographic factors possibly influencing the observed patterns.
Table 5 Regression analysis of factors determining frequency of toothbrushing
Variable Frequency of tooth cleaning
Odds ratio Lower CI Upper CI p-value
Age −0.017 −0.976 0.990 <0.001
Gender −0.322 0.605 0.868 <0.001
Geo-political zone (North Vs South)
0.052 0.863 1.286 0.609
Educational status 0.157 1.034 1.324 0.013
Previous visit to the dentist
0.423 1.261 1.847 <0.001
Previous oral health education
Conclusion
Presently, most Nigerians assess their oral health status positively and majority report using toothbrushes for maintaining good oral hygiene but display poor dental vis-iting habits. The study findings suggest that although age, sex, educational status, occupation are important determi-nants of oral hygiene behavior among Nigerians, other factors may play an important role as well. Further studies to identify other factors influencing oral health behavior are suggested, as the high level of non-attendance demon-strated by the participants is undesirable.
Competing interests
The authors declare that they have no competing interests.
Authors’contributions
AOO initiated the idea, actively participated in the data collection and edited the writing. AAA analysed the data, wrote the first draft and edited the article. OO participated in the data collection process, supervised and edited the writing. All authors have read and approved the final manuscript.
Acknowledgements
We would like to acknowledge Unilever Nigeria PLC for providing funds utilised in colleting the data for this research.
Author details
1
Department of Restorative Dentistry, Faculty of Dentistry, Obafemi Awolowo University, Ile-Ife, Osun State, Nigeria.2Department of Preventive Dentistry,
Faculty of Dentistry, Lagos State University College of Medicine, Lagos, Nigeria.3Dental Department, Ajeromi Ifelodun General Hospital, Lagos,
Nigeria.
Received: 25 April 2014 Accepted: 13 November 2014 Published: 27 November 2014
References
1. Petersen PE, Kwan S:Evaluation of community-based oral health promotion and oral disease prevention–WHO recommendations for improved evidence in public health practice.Community Dent Health 2004,21(suppl):319–329.
2. US Department of Health and Human Services:Oral health in America: A report of the Surgeon General.Rockville, MD: US Department of Health and Human Services, National Institute of Dental and Craniofacial Research, National Institutes of Health; 2000:104–109.
3. Harford J, Spencer AJ:Chapter 7–Oral Health Perceptions.InAustralia’s Dental Generations: The National Survey of Adult Oral Health 2004–06, AIHW Dental Statistics and Research Series No. 34. Edited by Slade GD, Spencer AJ, Roberts–Thomson KF; 2007:173–184.
4. National Institute for Dental Craniofacial Research (NIDCR):Chapter 3: Setting Health Priorities, Establishing Oral Health Objectives and Obtaining Baseline Information.InIn Healthy people 2010 Oral health toolkit; Available at: <http://www.nidcr.nih.gov/EducationalResources/DentalHealthProf/ HealthyPeople2010/Chapter3.htm>. Accessed on 13 March 2014. 5. Petersen PE:Challenges to improvement of oral health in the 21st
century–the approach of the WHO Global Oral Health Programme. Int Dent J2004,54(suppl 1):329–343.
6. Frencken JE, Holmgren CJ, Helderman WHP:[Online]. Basic package of oral care.2002. Available at: <http://www.chdentalinstitute.org/images/ BPOC.pdf>. Accessed on 14thMay.
7. Davies RM, Davies GM, Ellwood RP:Prevention. part 4: toothbrushing: what advice should be given to patients?Brit Dent J2003,195(3):135–141. 8. (FDI) World Dental Federation:Report of the global oral health planning
workshop; 2003.
9. Ainamo J, Parviainen K:Occurrence of plaque, gingivitis and caries as related to self- reported frequency of toothbrushing in fluoride areas in Finland.Commun Dent Oral Epidemio;1979,7:142–146.
10. Adeniyi AA, Sofola OO, Kalliecharan RV:An appraisal of the oral health system in Nigeria.Int Dent J2012,62(6):292–300.
11. Akpata ES:Oral health in Nigeria.Int Dent J2004,54(6 Suppl 1):361–366. 12. Federal Ministry of Health:National Oral Health Policy.Abuja: FMOH; 2012. 13. Adegbembo AO, El Nadeef MA:National survey of periodontal status and
treatment needs among Nigerians.Int Dent J1998,48(1):44–49. 14. Adair PM, Pine CM, Burnside G, Nicoll AD, Gillett A, Anwar S:Familial and
cultural perceptions and beliefs of oral hygiene and dietary practices among ethnically and socio-economically diverse groups.Community Dent Health2004,21(suppl):102–111.
15. Davidson PL, Rams TE, Andersen RM:Socio-behavioral determinants of oral hygiene practices among USA ethnic and age groups.Adv Dent Res 1997,11:245–253.
16. Varenne B, Petersen PE, Fourney F, Msellati P, Gary J, Outarra S, Harang M, Salem G:Illness-related behavior and utilization of oral health services among adult city dwellers in Burkina Faso: evidence froma household survey.BMC Health Serv Res2006,6:164.
17. National Populations Commission:Population census of the Federal Republic of Nigeria, Analytical report at the national level. Abuja, Nigeria; 2009. 18. Office of Population Censuses and Surveys (OPCS):Standard Occupational
Classification Volume 3.London: HMSO; 1991.
19. Sofola OO, Orenuga OO:A survey of the knowledge, attitude and practices of antenatal mothers in Lagos, Nigeria about the primary teeth.Afr J Med Med Sci2005,34:285–291.
20. Jeboda SO, Adeniyi AA, Ogunbodede EO:Assessment of preventive oral health knowledge and practices among rural and urban mothers in Lagos state.Niger Postgrad Med J2009,16:239–244.
21. Umesi-Koleoso DC, Ayanbadejo PO:Oral hygiene practices among adolescents in Surulere, Lagos State, Nigeria.Nig Q J Hosp Med2007, 17(3):112–115.
22. Sofola OO, Agbelusi GA, Jeboda SO:Oral health knowledge, attitude and practices of primary school teachers in Lagos state.Niger J Med2002, 11:73–76.
23. Adegbembo AO:Household utilization of dental services in Ibadan Nigeria.Comm Dent Oral Epidemiol1994,22:338–339.
24. Christensen LB, Petersen PE, Krustrup U, Kjoller M:Self-reported oral hygiene practices among adults in Denmark.Community Dent Health 2003,20:229–235.
25. Villa A, Kreimer AR, Polimeni A, Cicciù D, Strohmenger L, Gherlone E, Abati S:Self-reported oral hygiene habits among dental patients in Italy.Med Princ Pract2012,21:452–456.
26. Christensen LB, Petersen PE, Steding-Jessen M:Consumption of dental services among adults in Denmark 1994–2003.Eur J Oral Sci2007,115:174–179. 27. Hjern A, Grindefjord M, Sundberg H, Rosen M:Social inequality in oral
health and use of dental care in Sweden.Community Dent Oral Epidemiol 2001,29:167–174.
28. Jamieson LM, Thomson WM:Adult oral health inequalities described using area-based and household-based socioeconomic status measures. J Public Health Dent2006,66:104–109.
29. Akpata ES, Danfillo IS, Otoh EC, Mafeni JO:Geographical mapping of fluoride levels in drinking water sources in Nigeria.Afr Health Sci2009, 9(4):227–233.
30. Al-Otaibi M, Zimmerman M, Angmar- Mansson B:Prevailing oral hygiene practices among urban Saudi Arabians in relation to age, gender and socio-economic back- ground.Acta Odontol Scand2003,61:212. 31. Christensen P:The health-promoting family: a conceptual framework for
future research.Soc Sci Med2004,59:377.
32. Peer E, Gamliel E:Too reliable to be true? response bias as a potential source of inflation in paper-and-pencil questionnaire reliability. Pract Assessment Res Eval2011,16(9):1–8.
33. Fisher RJ, Katz JE:Social‐desirability bias and the validity of self‐reported values.Psychol Mark2000,17(2):105–120.
doi:10.1186/1472-6831-14-140