DOI: 10.14738/abr.78.6909.
Le, M. (2019). Performance Comparison and Structure Adjustment of Insurance Business of Property Insurance Companies. Archives of Business Research, 7(8), 180-192.
Performance Comparison and Structure Adjustment of
Insurance Business of Property Insurance Companies
Min Le
School of Insurance,
Central University of Finance and Economics, Beijing, China
ABSTRACT
The insurance business structure directly affects the profitability and sustainable development of property insurance companies. It is more meaningful to study how to adjust the business structure to achieve better performance in the context of diversified insurance operation than to argue about the diversified operation and specialized operation. The research compares the performance of insurance business lines based on rich data of three dimensions: insurance business lines, companies and time. The results indicate that motor insurance has a medium and low level of performance, while household property insurance has a high profitability and the performance is in good equilibrium and stability. Then this paper introduces a cost-volume-profit C-V-P model under uncertainty as quantitative decision-making tools for the adjustment of the business structure of property insurance companies. Uncertainty comes from the variable costs of property insurance companies.
Keywords: Performance Comparison; Insurance Business Lines; Business Structure Adjustment; C-V-P Model under Uncertainty; Property Insurance Companies
INTRODUCTION
Underwriting is the main job of property insurance companies. Corresponding insurance business structure directly affects the profitability and sustainable development of property insurance companies. Previously, the research on the business structure of property insurance companies focus on the impact of diversification or specialization on the performance of insurance companies in the dimension of business types, and empirical studies often have different conclusions.
Liebenberg and Sommer 2008 find that the performance of specialized business is better than that of diversified business, based on the data of non-life insurance business in the United States. In terms of return on assets and return on equity, diversified business is lower than that of specialized business by 1% and 2% respectively [1]. Berry-Stölzle et al 2013 find that the effect of diversification of large insurance companies in underdeveloped areas of capital market is more significant [2]. In the relevant research based on the data of China's property insurance market, the three viewpoints are all supported, that diversification helps to improve the performance of property insurance companies, that diversification reduces the performance of property insurance companies, and that diversification has no significant or complex relationship with the performance of property insurance companies. [3-6]
foreign economic and trade development and cooperation. While other property insurance companies generally operate a variety of kinds of insurance business.
Business lines of Chinese property insurance companies include commercial property insurance, household property insurance, motor insurance, liability insurance, engineering insurance, cargo insurance, hull insurance, credit insurance, guarantee insurance, special risk insurance, agricultural insurance, short-term health insurance and accident insurance and other type. From Figure 1, it can be showed that the number of Chinese property insurance companies operating 10-13 kinds of insurance business lines accounts for the largest proportion, and the number of Chinese property insurance companies operating under 5 kinds of insurance business lines accounts for less than 4%. Even newly-established companies also choose to operate multiple business lines, as shown in Figure 2. From 2011 to 2017, newly-established Chinese property insurance companies has operated an average of six business lines in the first year, and then the number of business lines increase year by year.
Figure 1 Proportion of Chinese property insurance companies operating different numbers of business lines from 2011 to 2017
Figure 2 Average number of business lines operated by newly-established Chinese property insurance companies in Year N since the commencement of business
Therefore, whether in theory or in practice, it is more meaningful to study how to adjust the business structure for better performance in the context of diversified insurance operation than to argue about the two business types of diversified operation and specialized operation. It is also a more important decision-making issue for insurance companies to improve their performance.
evaluate the performance of each insurance business. On this basis, the corresponding suggestions for adjusting the business structure are put forward.
Wang (2005) evaluate the performance of motor insurance, enterprise property insurance, cargo insurance and liability insurance of major property insurance companies in China by using the insurance premium table (IEE) proposed by NAIC (National Association of Insurance Commissioners): loss ratio of motor insurance was higher than that of other types of insurance, and motor insurance business has been continued losing; cargo insurance and commercial property insurance have been maintaining profitable; the performance of liability insurance has changed greatly [7]. Based on the theory of insurance life cycle, Cai (2010) use the business structure and the underwriting profit data of Ping An Property Insurance to analyze the reasons why the business structure affected the company's long-term profit development goals. On this basis, it put forward strategies and measures to adjust the business structure and enhance the underwriting profit under the premise of ensuring the short-term goal [8]. Cao (2013) take Dalian as an example, inspect the performance of property insurance from the perspective of insurance business and companies, uses "coefficient of variation" to inspect the stability of performance between years and the balance of performance among companies, and uses "degree of impact on performance" to measure the impact of various indicators on performance, and offers pertinent proposals on improving performance and business structure [9].
These literatures have some achievement in designing an effective index system to evaluate the contribution of various insurance business lines. They also offer some directional suggestions for adjusting the structure of insurance business. However, the sample size is mostly limited to a province or even a company, and the suggestions for adjusting the business structure are also qualitative descriptions, failing to provide a quantitative model tool that property insurance companies can use when adjusting the business structure.
First, this research compares the performance of insurance business lines based on rich data of three dimensions: insurance business lines, companies and time. Second, it introduces a cost-volume-profit C-V-P model under uncertainty as quantitative decision-making tools for business structure adjustment of property insurance companies. The main contributions lie in the following aspects: (1) The study focus on the adjustment of insurance business structure, not on the dispute between diversified business and specialized business, which is of more practical significance. (2) Enrich the performance research of insurance business of property insurance, and more clearly demonstrate the contribution of different insurance business to the performance. (3) Management accounting provides a very powerful tool: cost-volume-profit (C-V-P) model. The difference between property insurance companies and general companies lies in the uncertainty of variable cost. Hence, this research introduces C-V-P model under uncertainty as quantitative decision-making tools for business structure adjustment of property insurance companies.
PERFORMANCE COMPARISON OF PROPERTY INSURANCE BUSINESS Sample Selection and Comparison Methods
Sample Selection
At present, China's property insurance industry does not carry out sub-insurance accounting. Only sales data of the top five types of insurance business has been disclosed publicly by companies. The data in this research mainly come from the business statistics of property insurance companies in “China Insurance Yearbook”.
Since China began to implement business tax replaced with value-added tax policy in the financial industry in May 2016, the insurance premium income has been recorded in May 2016 without tax revenue, so the business statistics after 2016 and the business statistics of previous years are not comparable. This research use company-level data from 2011 to 2015. Firstly, because the purpose of the study is to compare the performance of different types of insurance business, Lloyd's and SINOSURE are excluded which have one business line; secondly, the companies that merge or separate during the data period are excluded. The final sample consists of the annual observation data of 301 companies and 13 kinds of insurance business as shown in Table 1.
Table 1 Sample selection period and sample size
2011Year 2012 Year 2013 Year 2014 Year 2015 Year
702 741 780 793 897
Performance Comparison Method of Different Insurance Business
The following two kinds of measurement methods are used to evaluate "performance" from the perspective of companies: one is data envelopment analysis (DEA) method; the other is using single or comprehensive financial performance indicator. Both of them take into account the relationship between input (cost) - output (benefit), which embodies the concept of efficiency. The purpose of this part is to compare the performance of different insurance business from microcosmic point of view, not involving the comprehensive performance evaluation of property insurance companies. The results of comparison will be applied to the structure adjustment of insurance business in property insurance industry. Hence, this research uses financial performance indicators to measure and compare the performance of different insurance business.
For different insurance business, the most direct income and cost are premium income and claims paid. For the purpose of comparing different insurance business, we only use premium income and claims paid data without considering other marketing expenses proportional to premium income and the cost which is difficult to distinguish for different insurance business. The specific indicator used to compare the performance of insurance business is expressed in ICR, which are defined as follows, reflecting the ability of insurance business to create profits:
ICR = 1 − CP SR⁄ 1
Among them, SR is premium income of the insurance business and CP is claims paid of the insurance business.
represents the stability of performance of insurance business of company i, and E(ICR)ì represents the equilibrium of performance of insurance business of year t.
S(ICR)ë = σ(ICR)ë⁄´(ICR)ë 2
E(ICR)ì = ¨(ICR)+⁄´(ICR)+ 3
σ(ICR)ëand ´(ICR)ë are the respectively the standard deviation and the mean value of ICR of
all years of company i ¨(ICR)+ and ´(ICR)+ are the respectively the standard deviation and
the mean value of ICR of all the companies in year t.
Results
Overall Status of Insurance Business Structure
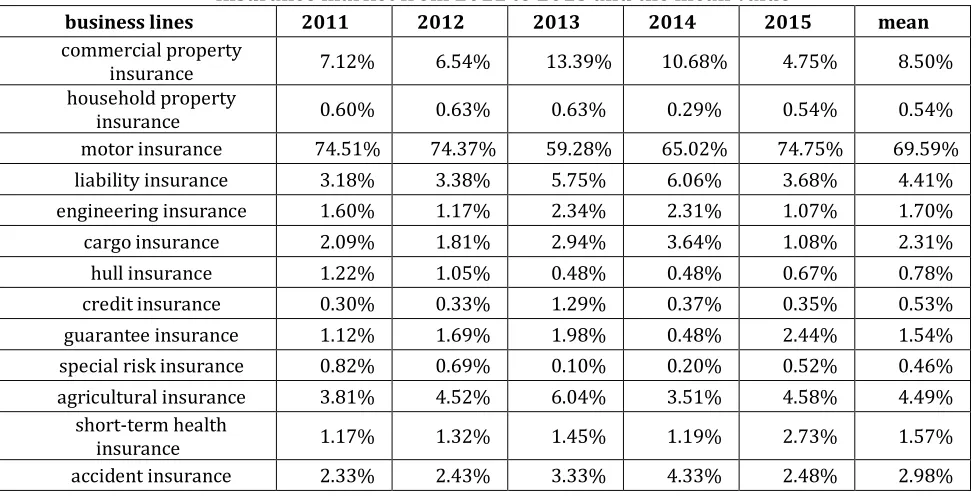
The structure of insurance business refers to the proportion of premium income of different insurance business. Table 2 shows the ratio of premium income of 13 kinds of insurance business lines to total premium in Chinese property insurance market from 2011 to 2015 and the mean value. Obviously, most of the business of property insurance companies still comes from motor insurance. In order to make the chart of performance analysis more clear, this research classify 13 kinds of insurance business lines into A and B according to the mean value of premium income in Table 2. Type A includes motor insurance, commercial property insurance, agricultural insurance, liability insurance, accident insurance, cargo insurance and Type B is the other 7 kinds of insurance business lines which have little market share.
Table 2 Ratio of premium of insurance business to total premium in Chinese property insurance market from 2011 to 2015 and the mean value
business lines 2011 2012 2013 2014 2015 mean commercial property
insurance 7.12% 6.54% 13.39% 10.68% 4.75% 8.50% household property
insurance 0.60% 0.63% 0.63% 0.29% 0.54% 0.54% motor insurance 74.51% 74.37% 59.28% 65.02% 74.75% 69.59% liability insurance 3.18% 3.38% 5.75% 6.06% 3.68% 4.41% engineering insurance 1.60% 1.17% 2.34% 2.31% 1.07% 1.70% cargo insurance 2.09% 1.81% 2.94% 3.64% 1.08% 2.31% hull insurance 1.22% 1.05% 0.48% 0.48% 0.67% 0.78% credit insurance 0.30% 0.33% 1.29% 0.37% 0.35% 0.53% guarantee insurance 1.12% 1.69% 1.98% 0.48% 2.44% 1.54% special risk insurance 0.82% 0.69% 0.10% 0.20% 0.52% 0.46% agricultural insurance 3.81% 4.52% 6.04% 3.51% 4.58% 4.49%
short-term health
insurance 1.17% 1.32% 1.45% 1.19% 2.73% 1.57% accident insurance 2.33% 2.43% 3.33% 4.33% 2.48% 2.98%
insurance, agricultural insurance, liability insurance, accident insurance, cargo insurance and Type B is the other 7 kinds of insurance business lines which have little market share.
Performance Comparison of Insurance Business
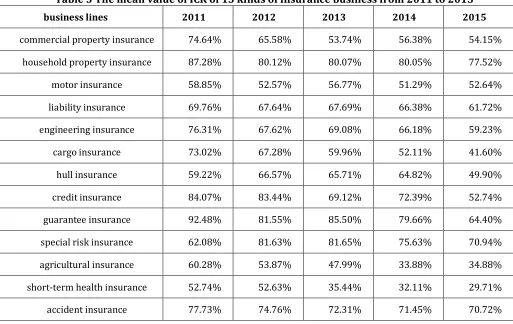
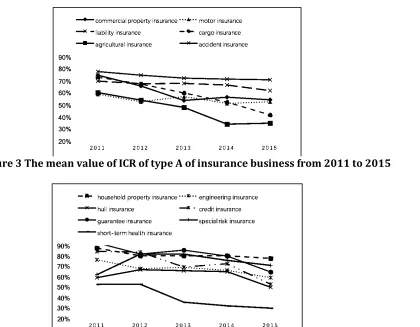
ICR reflects the ability of insurance business to create profits, which is calculated according to the definition 1 . Table 3 shows the mean value of ICR of 13 kinds of insurance business from 2011 to 2015 and Figures 3 and 4 show respectively the trend of mean value of ICR of type A and type B. It can be seen that the overall trend of the performance of all types of insurance business is declining, indicating that the competition in the insurance industry is becoming more intense, and the profit margin of insurance business is further compressed; the ICR of most important motor insurance is between 50% and 60%, which is in the middle and lower levels. The profit margin of household property insurance business is the largest. The performance of liability insurance, accident insurance, credit insurance, guarantee insurance and engineering insurance is also better than that of motor insurance. Agricultural insurance and short-term health insurance have poor performance.
Table 3 The mean value of ICR of 13 kinds of insurance business from 2011 to 2015
business lines 2011 2012 2013 2014 2015
commercial property insurance 74.64% 65.58% 53.74% 56.38% 54.15%
household property insurance 87.28% 80.12% 80.07% 80.05% 77.52%
motor insurance 58.85% 52.57% 56.77% 51.29% 52.64%
liability insurance 69.76% 67.64% 67.69% 66.38% 61.72%
engineering insurance 76.31% 67.62% 69.08% 66.18% 59.23%
cargo insurance 73.02% 67.28% 59.96% 52.11% 41.60%
hull insurance 59.22% 66.57% 65.71% 64.82% 49.90%
credit insurance 84.07% 83.44% 69.12% 72.39% 52.74%
guarantee insurance 92.48% 81.55% 85.50% 79.66% 64.40%
special risk insurance 62.08% 81.63% 81.65% 75.63% 70.94%
agricultural insurance 60.28% 53.87% 47.99% 33.88% 34.88%
short-term health insurance 52.74% 52.63% 35.44% 32.11% 29.71%
accident insurance 77.73% 74.76% 72.31% 71.45% 70.72%
At present, China's publicly available statistics do not disclose the specific premium ceded in or out of property insurance companies, and the operation philosophy of each company will affect all kinds of insurance business at the same time, so this research does not consider the premium ceded in or out when calculating the performance of insurance business.
Figure 3 The mean value of ICR of type A of insurance business from 2011 to 2015
Figure 4 The mean value of ICR of type B of insurance business from 2011 to 2015
E(ICR)ì which represents the equilibrium of ICR is shown in Table 4, Figures 5 and 6 describe
respectively E(ICR)ì of type A and type B. The equilibrium of motor insurance is better, which
Table 4 ≠(ÆØ∞)± which represents the equilibrium of ICR
business lines 2011 2012 2013 2014 2015
commercial property insurance 20.12% 32.95% 57.87% 55.01% 99.95%
household property insurance 15.08% 28.92% 24.40% 19.82% 26.17%
motor insurance 36.90% 41.22% 30.89% 26.08% 41.15%
liability insurance 39.28% 42.95% 44.43% 42.54% 62.25%
engineering insurance 28.72% 59.97% 51.63% 45.40% 74.82%
cargo insurance 25.12% 30.00% 40.68% 96.26% 161.10%
hull insurance 100.52% 51.88% 61.06% 58.92% 166.66%
credit insurance 31.57% 33.99% 101.96% 68.69% 182.18%
guarantee insurance 31.11% 44.95% 39.28% 33.88% 114.15%
special risk insurance 105.61% 43.90% 42.15% 38.25% 51.04%
agricultural insurance 26.77% 63.79% 88.58% 145.05% 145.74%
short-term health insurance 64.77% 57.04% 112.52% 129.21% 180.93%
accident insurance 18.82% 21.15% 32.25% 21.98% 25.67%
Figure 5 ≠(ÆØ∞)± of type A
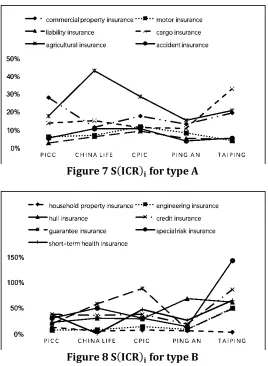
S(ICR)E The stability of ICR, refers to the fluctuation degree of ICR on the time axis for a company. For space reasons, this paper only lists S(ICR)E (table 5) for some mature listed companies. Figures 7 and Figures 8 show S(ICR)E for type A and B respectively.
Compared with Figure 7 and Figure 8, it can be seen that S(ICR)E of type A which accounts for
the vast majority of the insurance market share is within 30%, while the coefficient of variation of the performance of type B is within 75% on the time axis, even 150%. It represents the companies know a lot about insurance business of type A and household property insurance and engineering insurance in type B, and has also a good grasp. But the companies do not know enough about other types of insurance business. Of course, the instability of the performance of insurance business lines which account for small market share is also related to the instability of claims paid caused by the failure of the law of large numbers to play a good role.
From the company's point of view, PICC, as China's No. 1 in insurance industry, has very good stability in all kinds of insurance business lines, which shows that it has a good grasp of all kinds of insurance business lines and accurate actuarial assumptions of expected profits.
Table 5 ≤(ÆØ∞)≥ for some mature listed companies
business lines PICC China Life CPIC Ping An Tai Ping
commercial property insurance 27.98% 11.40% 17.62% 13.00% 19.41%
household property insurance 12.61% 4.71% 6.95% 5.72% 3.03%
motor insurance 6.03% 6.79% 11.64% 8.14% 3.92%
liability insurance 2.63% 6.11% 9.09% 4.99% 4.96%
engineering insurance 7.17% 7.61% 13.52% 8.10% 49.95%
cargo insurance 13.76% 15.08% 11.12% 10.71% 32.72%
hull insurance 21.60% 29.98% 28.36% 67.92% 61.34%
credit insurance 37.68% 35.33% 37.41% 18.27% 85.80%
guarantee insurance 19.27% 58.06% 87.76% 8.03% 48.40%
special risk insurance 29.97% 49.85% 30.33% 13.66% 142.68%
agricultural insurance 17.47% 42.97% 28.54% 15.17% 20.68%
short-term health insurance 36.80% 0.00% 47.27% 25.82% 64.89%
Figure 7 ≤(ÆØ∞)≥ for type A
Figure 8 ≤(ÆØ∞)≥ for type B
THE APPLICATION OF C-V-P MODEL IN THE ADJUSTMENT OF BUSINESS STRUCTURE Traditional C-V-P Model
C-V-P model is a very important decision-making tool provided to us by management accounting. Based on the division and understanding of variable cost and fixed cost, it uses quantitative model to analyze the relationship among cost, sales volume and profit in a certain period of time, so as to help managers understand how operation and marketing decisions will affect profits of enterprises. Firstly, cost is decomposed into fixed cost FC and variable cost VC. Fixed cost is constant in a certain period of time. Then total profits Z can be calculated by the following formula:
Z = SR − VC − FC = (P − VCU) × Q − FC 4
Among them, SR is sales revenue, P is sales price, VCU is unit variable cost, Q is sales volume. This traditional C-V-P equation implies the following assumptions: the uniqueness of income motivation and variable cost motivation, only Q can change the enterprise's income and cost; within the relevant range, the relationship between SR and Q is linear; the relationship between VC and Q is also linear; it is assumed that output and sales are balanced. [10]
The concept of marginal contribution is often used in C-V-P model. The marginal contribution of products refers to the difference between the sales revenue of products minus the corresponding variable costs. It can be expressed in three forms: marginal contribution CM, unit marginal contribution CMU and marginal contribution rate CM%.
CMU = P − VCU 6
CM% = CM SR⁄ = 1 − VC SR⁄ = 1 − VCU P⁄ 7
After introducing the concept of marginal contribution,
Z = CM − FC = CMU × Q − FC = CM% × SR − FC 8
If it is not a single product but a product portfolio, the weighted average marginal contribution per unit or the weighted average marginal contribution rate can be used.
Using the above C-V-P model, we can make some decisions, such as the sales volume needed to achieve the target profit and break-even, whether to increase or decrease product lines, which product lines should be emphasized, and whether to enter the new market. Insurance business lines is a higher level product line of property insurance company. The purpose of this paper is to introduce the model tool to support the decision-making of structural adjustment of insurance business for property insurance company.
The Application of C-V-P Model in the Adjustment of Business Structure
The particularity of the insurance industry makes it impossible for the insurance companies to calculate profits according to the cost of individual business as the general company does. It should be calculated according to the aggregate of total business. This is the inevitable result of the insurance operation based on the law of large numbers. Therefore, the decision variable of C-V-P model in the application of property insurance companies is no longer sales volume but sales revenue. Because relaxing the hypothesis, the relations available are:
Z = SR − VC − FC = CM − FC = CM% × SR − FC 9
First of all, we need to analyze the cost behavior of property insurance companies and distinguish variable cost VC from fixed cost FC. For property insurance companies, variable costs include claims paid, reserves to be drawn, marketing expenses such as handling charges expenses and sales tax, and administration expenses unrelated to specific business as fixed costs. Considering that the handling charges expenses and sales tax are generally proportional to the sales revenue of insurance business, they can be simplified to SR × E%. The reserve of property insurance companies can be simplified to SR × R% because it is extracted in proportion to premium income. Therefore, reserves to be drawn can be expressed as the difference between the reserve and the reserve already made last year:
SR × R% − SR (1 + V%)⁄ × R% = SR × (V% × R%) (1 + V%)⁄ 10
V% is the growth rate of annual premium; synthesizing the above analysis, and assuming that the return on investment is I%, the total profits of property insurance companies can be denoted as follows:
Z = SR − CP − SR × E% − SR × (V% × R%) (1 + V%)⁄ + SR × I% − FC
= SR × ICR + SR × (I% − E% − (V% × R%) (1 + V%)⁄ ) − FC 11
Now consider the situation of operating multiple insurance business lines at the same time, suppose that the premium income of property insurance company's n kinds of insurance can be expressed as
SR = ∂ ∑û.
⋮
∑ûπ
∫ 12
and the performance of n types of insurance business is as follows
ICR = ∂
ù†û.
⋮
ù†ûπ
∫ 13
so
Z = SRª∙ ICR − SRª× (I% − E% − (V% × R%) (1 + V%)⁄ ) − FC
= ∑π ∑ûëù†ûë
ëG. + (I% − E% − (V% × R%) (1 + V%)⁄ ) × ∑πëG.∑ûë− FC 14
Further introduction of uncertainty,[11] due to the particularity of the insurance industry, although the pricing of insurance products has been based on the regularity of risks faced by various insurance products, ICR as a random variable is obviously more realistic, assuming that it obeys the normal distribution ICR~N(´, Σ)
µ = ∂ ´.
⋮
´π∫ Σ = ø
¨.. ¨.3 ⋯
¨3. ¨33 ⋯
⋮ ⋮ ⋮ ¨.π ¨3π ⋮
¨π. ¨π3 ⋯ ¨ππ
¿ ¨ë¡ = Q ¨ë
3(¬ = √)
ƒë¡¨ë¨¡(¬ ≠ √) 15
It can be deduced
ã(Z) = SRª∙ ´ − SRª× (I% − E% − (V% × R%) (1 + V%)⁄ ) − FC
= ∑π ∑ûë´ë
ëG. + (I% − E% − (V% × R%) (1 + V%)⁄ ) × ∑πëG.∑ûë − FC 16
•≈û(Z) = SRª∙ Σ ∙ SR
= [∑û., ⋯ , ∑ûπ] ø
¨.. ¨.3 ⋯
¨3. ¨33 ⋯
⋮ ⋮ ⋮ ¨.π ¨3π ⋮
¨π. ¨π3 ⋯ ¨ππ
¿ ∂∑û⋮. ∑ûπ∫
= ∑ ∑π ¨ë¡∑ûë∑û¡
¡G. π
ëG. 17
At this time, the total profits of property insurance companies is also a random variable subject to normal distribution:
Z~Ntã(Z), •≈û(Z)u
E%, V%, R%, I% and ´, Σ of ICR can be obtained by using historical data and actuarial assumptions, so that we can use Formula (16) and Formula (17) to calculate the average ã(Z)
and the corresponding risk •≈û(Z) in different business structure, i.e. different SR = ∂∑û⋮.
∑ûπ
This model provides a quantitative basis for the decision-making of the business structure adjustment of the insurance company's management.
CONCLUSION
The results of performance comparison show that, as the first major business of the property insurance industry, motor insurance has a medium and low level of performance in the existing insurance business, while household property insurance has high profitability with good equilibrium and stability. The efforts to develop a household property insurance business are conducive to improving the performance of property insurance companies. The poor performance of agricultural insurance and short-term health insurance also explains why these two insurance businesses require government involvement to stimulate supply.
According to these performance data of the insurance business line, the property insurance company can use the C-V-P model under uncertainty established in this paper as a quantitative decision when adjusting the business structure of a given target profit. The model can also be used for sales budgets, break-even analysis, and more. The applicability of the model depends on the improvement of the accounting system of the property insurance company's sub-insurance. The more accurate the empirical data, the more accurate the model results. It not only helps to achieve the short-term profit target of property insurance companies, but also facilitates product development, cost control and business management while mastering the profitability of various insurance businesses.
References
Liebenberg, A. P., Sommer, D. W., Effects of Corporate Diversification: Evidence from the Property Liability Insurance Industry. Social Science Electronic Publishing, Vol. 75, No. 4 (Dec., 2008), pp. 893-919.
Berry Stölzle, T.R., Hoyt, R.E., Wende, S., Capital Market Development, Competition, Property Rights, and the Value of Insurer Product Line Diversification: A Cross Country Analysis. Journal of Risk & Insurance, 2013, 80(2):423-459.
Yu, L.L., Performance analysis of diversification of insurance companies in China. Hunan University, 2010. Zhao, G.Q., Wu, H., The Impact of Diversification and Competition on the Performance of Property Insurance Industry in China. Economic Management, 2014 (1): 101-109.
Wang, Z.F., Zhang Q.C., The impact of diversification of insurance companies on performance. Journal of Chongqing University (Social Science Edition), 2015, 21 (5): 107-115.
Xu, L., Fan, X.P., Zhang, N., Empirical Study on Diversification and Performance of Property Insurance Companies in China. Insurance Research, 2010 (5): 10-18.
Wang, F.X., Performance Analysis of Domestic Property Insurance Company Subdivision Simulation . Second CCISSR Forum of Peking University, 2005.
Cai, W.B., Research on Relation Between Adjustments of Business Structure to improvement in Underwriting Profit. South China Univesity of C hina, 2010.
Cao, Y.B., Research on the Performance of Property Insurance lines in China: A Case of Dalian. Dongbei University of Finance and Economics, 2013.
Gordon Institute of Finance and Economics, Financial Decision-making (Textbook for Certification Examination of Certified Management Accountant ). China Financial and Economic Publishing House, February 2017.