http://www.sciencepublishinggroup.com/j/es doi: 10.11648/j.es.20170202.12
Modelling and Simulation of Partial Deposition of Ionic
Content in Silty Clay at Igwuruta Area of Rivers State
Ezeilo F. E.
1, Eluozo S. N.
21
Department of Civil Engineering, Rivers State University of Science and Technology, Nkpolu Oruwurokwu, Port-Harcourt, Nigeria
2
Department of Civil and Environmental Engineering, Subaka Nigeria Limited Port Harcourt, Port Harcourt, Nigeria
Email address:
[email protected] (Ezeilo F. E.), [email protected] (Ezeilo F. E.), [email protected] (Eluozo S. N.), [email protected] (Eluozo S. N.)
To cite this article:
Ezeilo F. E., Eluozo S. N. Modelling and Simulation of Partial Deposition of Ionic Content in Silty Clay at Igwuruta Area of Rivers State.
Engineering Science. Vol. 2, No. 2, 2017, pp. 37-44. doi: 10.11648/j.es.20170202.12 Received: October 26, 2016; Accepted: February 24, 2017; Published: March 28, 2017
Abstract:
In this research work investigates the deposition of ionic content in silty clay penetrating unconfined bed. The study monitored partial deposition of ionic content in silty clay to penetrating unconfined bed. Several experts have worked on the transport process of ionic content, but thorough evaluation has not been done to monitor the behaviour of ionic content applying the conceptual frame work. The study has generated data on the rate of ionic content concentration penetrating unconfined deposition. Predicted and experimental results from model validation show decreasing concentration with respect to change in depths, higher concentrations were observed at the impermeable depositions found between 3 and 12 metres, while decrease was experienced from 15 to 40 metres. The generated values were from the simulation produced from the developed model. The study is imperative because the developed model can generate better results applying this type of mathematical techniques for ionic transport penetrating unconfined bed through thorough evaluation in the study area. This conceptualized approach is to monitor ionic transport in soil and water environment.Keywords:
Modelling and Simulation, Ionic Content, Partially Deposition, Silty Clay1. Introduction
The environmental problems posed by heavy metals are that they are non-destructive and most often have toxic effects on living organisms on exceeding a certain concentration. Furthermore, some heavy metals are being subjected to bioaccumulation and may pose a risk to human health when transferred to the food chain [16]. Soils, whether in urban or agricultural areas represent a major sink for metals released into the environment from a wide variety of anthropogenic sources. [13, 14, 15, and 16] Generally in soil environment, sorption is the dominating speciation process and thus the largest fraction of heavy metal in a soil is related with the solid phase of that soil. Pollution quandary arises when heavy metals are mobilized into the soil solution and taken up by plants or transported to the surface and ground water. The properties of the soil are thus very important in the attenuation of heavy metals in the environment [12, 13]. The solubility of heavy metals in soil is controlled by reactions with solid phases. Understanding the process
governing the migration and plant availability of trace metals in soils is essential for predicting the environmental impact of spreading metal containing wastes on agricultural land. The adverse effect of heavy metals is inseparably related to the soil’s ability to absorb and retain sub elements. The pH of the soil solution maintained at neutral to slightly alkaline condition showed low mobility of all heavy metals. To increase the mobility of heavy metals, the pH of the soil solution should be lowered. The solubility of Pb in soil solution was pH dependent, increasing as the pH was
adjusted from 6 to 3. At near neutral pH, the activity of Pb2+
decreasing mobility and bioavailability. However because of the complexation of metals by soluble OM, the addition of OM can result in release of metals from solids to the soil solution [6, 7, 8, and 9]. The increase in the solubility of the Cu and Pb is related to the dissolution of the HA component of the organic matter. This indicates that solution phase speciation reactions with organic matter dominate the partition of these metals at higher pH. Thus due to high pH, the DOM increases as a result solubility of HA. In general, sorption increases with increasing pH. That is, the lower the pH value, the more metal can be found in solution and thus more metal is mobilized. When pH falls below five, mobility is enhanced as a result of the increased proton concentration [10, 11, 12, and 15]. High solubility of heavy metals in soil solution at alkaline pH was attributed to enhanced formation of organic matter metal complexes after ionization of weak acid groups. Extensive evidence exist that in this pH range most dissolved heavy metals are present as metal soluble organic lag and complexes [14, 15, and 16]. The degree of stabilization achieved by compost appears to be very important in determining potential mobility of heavy metals. [9, 13, 15] reported that, Cd can move readily in sandy loam soils, but OM in the surface layer will act as a sink for Cd and will reduce the rate of movement. Destructions of heavy metals between soil and solute is the key for evaluating the environment impact of the metals. For Cu, in particular OM both solid and dissolved can affect its mobility substantially [3, 5, and 9. [4, 5, and 10] reported that the role of organic acids in Cd mobilization is especially important since modern agriculture increasingly involves minimum tillage practices that recycle plant residues. Complexations of metals by organic lag ands play an important role in controlling metal solubility. The amount of metals adsorbed decreases with increasing ionic strength for minerals with permanent surface charge density [14, 16] reported that regardless of pH, Zn
adsorption was always superior for the most diluted CaCl2
solution utilized. This shows that the reaction took place on the negative surface of colloids. For these surfaces, the reduction of ionic strength makes the surface electric potential more negative, and thus ion adsorption is greater. The soil texture plays an important role in mobility of metals in soil. Texture reflects the particle size distribution of the soil and thus the content of fine particles like oxides and clay. These compounds are important adsorption media for heavy metals in soils. The clay soil retains high amount of metals when compared to sandy soil. [13] concluded that the fine textured soils contain higher amounts of Pb (3889 mg kg-1) and coarse textured soil contains (530 mg kg-1) lower amount of Pb. [11] Reported that the metal content of top and middle layer of soil was comparatively higher than bottom layer of soil. [1, 2, 5, 6, and 11] concluded that the content of DTPA- extractable metals in light textured soils were low in soils irrigated with sewage water for the past 50 years. Alesi et al. (1980) reported that the soil texture and structure as evaluated by bulk density i.e. the solution flux. This plays a part in diffusion of metal ions into and out of soil aggregates in such a way that movement of elements through soil may
be predicated with greater accuracy by having some knowledge of flow velocities. [12] Reported that colloids with high surface charge and soils with greater macro porosity contributed more Pb mobility and transport. When the temperature rises, the metal activity in the soil solution as well as that of the plant roots may be more active and has faster absorption rates. Furthermore, the absorption rate of the roots may be increased as a result of higher evapotranspiration from the plant. [10, 11] concluded that considerable enrichment of heavy metals in the sub micron range occurs during vaporizations of heavy metals in the high temperature environment and the subsequent condensation in lower temperature regions of the systems. Duration and temperature increased the percentage of Pb that was bound to the carbonates decreased with a concomitant increase of residual Pb. [8, 9, and 11] reported that, higher soil temperature enhances the degradation soil organic matter, thereby releasing organic acids, which increase the mobility of heavy metals in soils. Thus their availability is increased.
2. Governing Equation
2 1
2 x t 0
d c dc dc
V
dx dx
dx
τ
ϕ
∆ − + = (1)
(
)
2 1
2 x t 0
d c dc
V
dx dx
τ
ϕ
∆ − − = (2)
Let
0 n n n
C a x
∞ = =
∑
1 1 1 n n nC na x
∞ − = =
∑
(
)
11 2 2 1 n n nC n n a x
∞
−
=
=
∑
−(
)
(
)
1 2 1
2 1
1 n n 0
n x t n
n n
n a x V na x
τ
∞ −ϕ
∞ −= =
∆
∑
− − −∑
= (3)Replace n in the 1st term by n+2 and in the 2nd term by
n+1, so that we have;
(
)(
)
(
) (
)
1
2 1
2 0
2 1 n 1 n 0
n x t n
n n
n n n a x V n a x
τ ∞ + ϕ ∞ +
= =
∆
∑
+ + − +∑
+ = (4)i.e.
(
)(
)
(
)(
)
1
2 1
2 1 n x t 1 n
n n a V n a
τ
+ϕ
+∆ + + = − − (5)
(
)(
)
(
)(
)
12 1
1 2 1
x t n
n
V n a
a n n ϕ τ + + − + =
∆ + + (6)
(
)
(
)
12 1
2
x t n
n V a a n ϕ τ + + − =
( )
( 1 )0 1
x t
V x
C x a a
ϕ τ
− ∆
= + ℓ for
(
)
1 2 1 0, 2 x t V a
n a
ϕ
τ
−= =
∆ (8)
For
(
)
(
)
22 1
3 1 1 1
1,
3 2 3
x t x t
V a V a
n a ϕ ϕ
τ τ τ
− −
= = =
∆ ∆ • ∆ (9)
For
(
)
(
) (
)
(
)
33 1 1
4 1 1 1 1 1 1
2;
4 3 2 4 3
x t x t x t x t
V a V V a V a
n a ϕ ϕ ϕ ϕ
τ τ τ τ τ τ
− − − −
= = = • =
∆ ∆ ∆ • ∆ ∆ • ∆ (10)
For
(
)
(
)
41
5 1 1 1 1 1
3;
5 5 4 3 2
x t t
V V a
n a ϕ ϕ
τ τ τ τ τ
− −
= = =
∆ ∆ • ∆ • ∆ • ∆ (11)
For
(
)
11 1 1 ; ! n x t n n V a n a n ϕ τ − − − −
∆ (12)
( )
2 3 4 50 1 2 3 4 5 ... n n
C x = a +a x a x+ +a x +a x +a x + a x (13)
( ) 2 ( ) 3 ( ) 4 ( )5
1 1
0 1 1 2 3 4
2! 3! 4! 5!
x t x t x t x t
V a x V a x V x V a a x ϕ ϕ ϕ ϕ
τ τ τ τ
− − − −
= + + + + +
∆ ∆ ∆ ∆ (14)
( ) 0 1 ( )1 2 ( )22 3 ( )33 4 ( 4) 5 ...
2! 3! 4! 5!
x t x t x t x t
V x V x V x V x C x a a x ϕ ϕ ϕ ϕ
τ τ τ τ
− − − −
= + + + + + +
∆ ∆ ∆ ∆
(15)
( ) ( 1)
0 1
x t
V x
C x a a
ϕ τ − ∆
= + ℓ (16)
3. Materials and Method
Standard laboratory experiments where performed to monitor ionic concentration at different formations. The soil depositions of the strata were collected in sequences according to the structural deposition at different locations. Samples collected at different locations generated variation at different depths producing different migration of ionic concentration through ASS at different strata. Experimental results are applied which compared favourably with theoretical values thereby validating of the developed model.
4. Result and Discussion
Results and discussion are presented in tables, including graphical representation of ionic concentration
Table 1. Predicted Values of Ionic Concentrations at Different Depths.
Depth [M] ionic Concentration
3 1.11E+00
6 7.12E-01
9 3.65E-01
12 1.61E-01
15 7.23E-02
Depth [M] ionic Concentration
18 3.10E-02
21 2.10E-02
24 1.40E-02
27 4.50E-03
30 3.57E-03
33 2.61E-04
36 1.20E-04
37 3.54E-05
39 4.53E-05
Table 2. Predicted and Measured Values ionic Concentrations at Different Depths.
Depth [M] Predicted Values Measured Values
3 1.11E+00 1.18
6 7.12E-01 0.81
9 3.65E-01 0.41
12 1.61E-01 1.70E-01
15 7.23E-02 8.10E-02
18 3.10E-02 4.00E-02
21 2.10E-02 3.00E-02
24 1.40E-02 1.30E-02
27 4.50E-03 3.32E-03
30 3.57E-03 2.44E-03
33 2.61E-04 2.52E-04
36 1.20E-04 2.10E-05
37 3.54E-05 3.23E-05
39 4.53E-05 4.52E-05
Table 3. Predictive Values ionic Concentrations at Different Depths.
Depth [M] ionic Concentration
3 8.10E-01
6 5.40E-01
9 2.0E-01
12 1.14E-01
15 3.60E-02
18 1.48E-02
21 5.30E-03
24 1.73E-03
27 2.18E-03
30 2.32E-04
33 7.32E-05
36 2.47E-05
37 7.75E-06
39 2.66E-06
Table 4. Predicted and Measured ionic Concentrations at Different Depths.
Depth [M] Predicted Values Measured Values
3 8.10E-01 7.60E-01
6 5.40E-01 4.70E-01
9 2.0E-01 2.11E-01
12 1.14E-01 1.11E-01
15 3.60E-02 3.55E-02
18 1.48E-02 1.26E-02
21 5.30E-03 5.00E-03
24 1.73E-03 1.67E-03
27 2.18E-03 2.07E-03
30 2.32E-04 2.04E-04
33 7.32E-05 6.89E-05
36 2.47E-05 2.11E-05
37 7.75E-06 7.66E-06
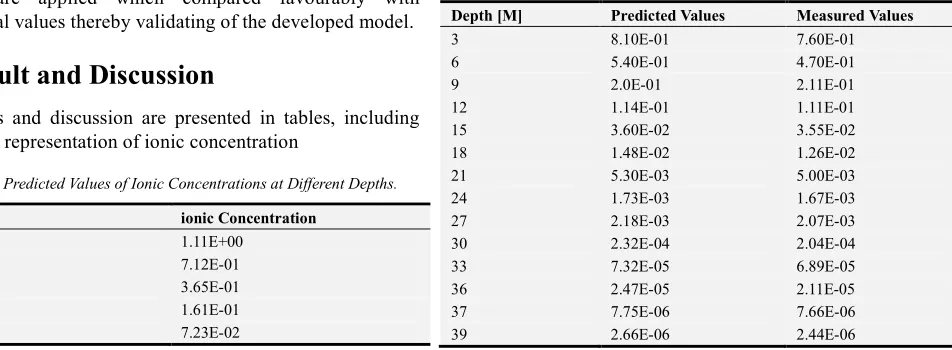
Table 5. Predicted Values of ionic Concentrations at Different Depths.
Depth [M] ionic Concentration
3 8.30E-01
6 4.50E-01
9 1.85E-01
12 6.62E-02
15 2.34E-02
18 1.51E-02
21 2.47E-03
24 7.61E-04
27 2.34E-03
30 7.23E-05
33 2.31E-05
36 6.41E-06
37 1.88E-06
39 5.61E-07
Table 6. Predicted and Measured Values of Ionic Concentrations at Different Depths.
Depth [M] Predicted Values Measured Values
3 8.30E-01 8.50E-01
6 4.50E-01 4.43E-01
9 1.85E-01 2.23E-01
12 6.62E-02 5.81E-02
15 2.34E-02 3.11E-02
18 1.51E-02 1.46E-02
21 2.47E-03 3.70E-03
24 7.61E-04 6.61E-03
27 2.34E-03 2.44E-03
30 7.23E-05 6.45E-04
33 2.31E-05 3.89E-05
36 6.41E-06 6.11E-05
37 1.88E-06 1.66E-06
39 5.61E-07 5.44E-06
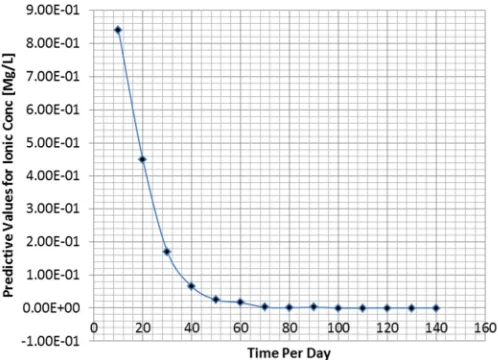
Table 7. Predicted Values of ionic Concentration at Different Depth.
Time Per Day ionic Concentration
10 8.40E-01
20 4.50E-01
30 1.70E-01
40 6.50E-02
50 2.50E-02
60 1.63E-02
70 2.44E-03
80 7.56E-04
90 2.46E-03
100 7.29E-05
110 2.27E-05
120 6.59E-06
130 1.82E-06
140 5.79E-07
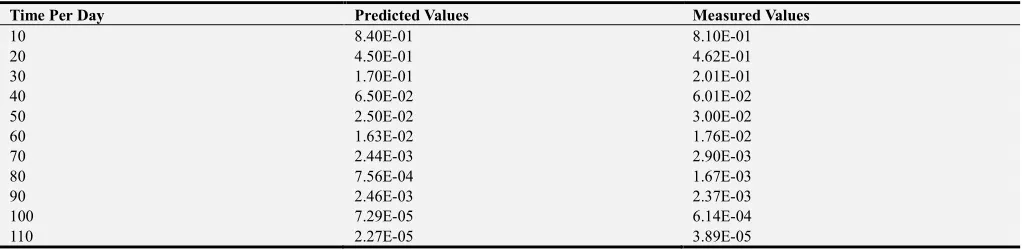
Table 8. Predicted and Measured Values of Ionic Concentrations at Different Depths.
Time Per Day Predicted Values Measured Values
10 8.40E-01 8.10E-01
20 4.50E-01 4.62E-01
30 1.70E-01 2.01E-01
40 6.50E-02 6.01E-02
50 2.50E-02 3.00E-02
60 1.63E-02 1.76E-02
70 2.44E-03 2.90E-03
80 7.56E-04 1.67E-03
90 2.46E-03 2.37E-03
100 7.29E-05 6.14E-04
Time Per Day Predicted Values Measured Values
120 6.59E-06 5.71E-05
130 1.82E-06 2.66E-06
140 5.79E-07 5.44E-06
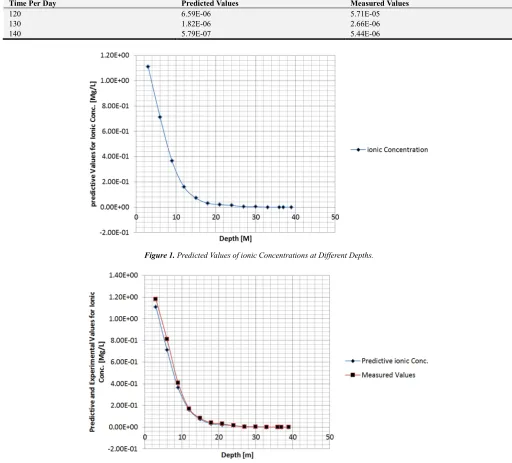
Figure 1. Predicted Values of ionic Concentrations at Different Depths.
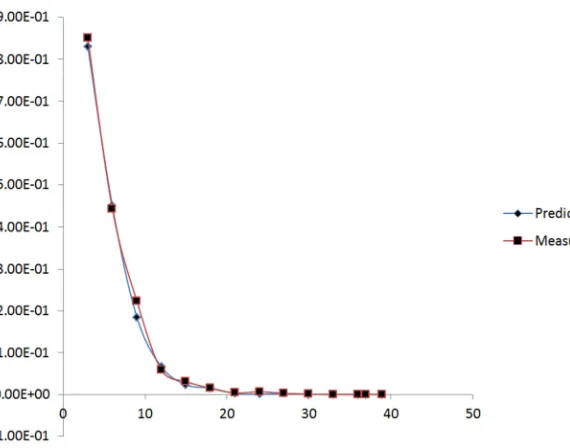
Figure 2. Predicted and Measured Values of ionic Concentrations at Different Depths.
Figure 4. Predicted and Measured Values of ionic Concentrations Different Depths.
Figure 5. Predictive Values of ionic Concentrations at Different Depths.
Figure 7. Predictive Values of ionic Concentrations at Different Times in Days.
Figure 8. Predicted and Measured Values of ionic Concentrations at Different Times in Days.
The study generated physical process from the graphical representation observed from the deposition of ionic content in various depositions. The figures from one to two shows ionic rate of concentration at different formations between the clay to silty soil deposition where low concentration were observed due to higher permeability. At the clay deposition, low permeability was experienced developing higher concentration causing an accumulation between the impermeable layers. The rates of concentration were observed to reduce in penetrating phreatic bed due to this natural purification process. Thus due to their structure, the rate of migration between the clay deposition and accumulation were observed. While Figures three and four produced similar results, though experiencing variation in concentration rate at different strata, it is observed to decreases with change in depth based on the structural variation of the strata thereby influencing variation in deposition of permeability in the formation. Slight changes in these depositions were observed to influence the transport process of the contaminant in the study area. Therefore there is an observed decrease in concentration rate compared to figure one and two. Figures five and six maintained their degradation process as the rate of accumulation and
impermeable formation were observed to reduce their migration process in its level depositions. It finally reduces the rate of concentration to penetrating phreatic bed. Figures seven and eight shows more decrease in concentration. The rates of transport were inhibited by impermeable deposition that could not allow rapid migration to the penetrating phreatic bed. The deposited semi unconfined bed experienced lower concentration compared to other figures. The study shows these results through simulation from the developed model. The theoretical values were compared with experimental results, both parameters generating best fits validating the developed model.
5. Conclusion
environment. The transport process in soil varies due to the influences from geological histories. The behaviour of the ionic content depends on the depositions of formation characteristics in the study area. The study applied this concept and discovered a variation in the rate of concentrations in silty clay. Several factors in ionic content are found to affect the deposition of this contaminant in the study area. The developed model was simulated to predict the rate of depositions in silty clay penetrating unconfined bed. The varying rate of concentrations is expressed through the simulation values.
References
[1] AmaralSobrinho, N. M. B., L. M. Costa, C. de Oliveira and A. C. X. Vellosa. (1992). Heavy metals in some fertililzers and lime. (In Portugese) R. Bras, Ci. Solo, Campinas 16: 271-276. [2] Casagrande, C., R. F Alleoni, (2001), Camergo and A.
Arnone,. Ionic strength and pH influence on Zn adsorption in a variable change soil. In: Proceedings. 6th International conference on the biogeo Chemistry of trace elements. Guelph.
[3] Carrillo-Gongaley and Rowell. (2001). Metal displacement through a sandy soil; Effect of organic matter content. In: Proceedings. 6th International conference on the biogeo chemistry of trace elements; Guelph.
[4] Naidu. R. and R. Harter. (1998). The role of metal organic complexes on metal sorption by soils. Adv. Agron. 55: 219-263.
[5] Karthanasis, A. D. (2001). Mineral controls in colloid mediated transport of metals in sub surface environments. In: Proc. 6th International conference on biogeochemistry of trace elements Guelph.
[6] Raven, K. P. and R. H. Laeppert. (1997). Trace element composition of fertilizer and soil amendments. J. Environ. Qual. 26: 551-557.
[7] Yu-Ling-Wei and Yu Ling Huang. (1998). Behaviour of sequential extraction of lead from thermally treated lead (II)
Doped Alumina J. Environ. Qual. 27: 343-348.
[8] SebastienSauve, Murray McBride and William Hendershot. (1998). Soil solution speciation of lead (II) effects of organic matterand pH. Soil Sci. Soc. Am. J. 62: 618-621.
[9] Michel J. Mench, Valerie L. Didier, Monika Loffles, Alain Gomey, and Pierre Masson.(1994). A minricked in-situ remediationstudy of metal contaminated soils with emphasis on cadmiumand lead. J. Environ. Qual. 23: 58-63.
[10] Thompson Jacob, Jaya paulAzariah, Paul Appasamy and GunnarJacks. (1995). Impact of textile industries on the groundwater quality of Tirupur. In: Proceedings of 4th Nationalsymposium on Environment, Madras, February.
[11] Friesl, W; E. Lombi; O. Horak and W. W. Wenzel. (2001). Amendments to reduce trace elements mobility. In: Proceedings 6th International conference on the biogeochemistry of trace elements; Guelph.
[12] Khan. S., N. N. Khan and Iqbal. N. (1991). Studies on the effects ofsome organic pollutants on the heavy metal transport in anIndian Soil Environmental Pollution. 70: 2, 109-115. [13] Khattak, R. A., and A. L. Page. (1992). Mechanism of
manganeseadsorption on soil constituents. 383-400. In D. C. Adrian(ed.) Biogeochemistry of trace metals. Lewis Publ., BocaRaton, FL.
[14] Chideshwari, T. (1999). Studies on the sewage biosolid composts andtheir effect on soil and crops. Ph. D thesis submitted toDepartment of Soil Science and Agricultural Chemistry, TNAU, Coimbatore.
[15] Sherene T. (2010) Mobility and transport of heavy metals in polluted soil environmentBiological Forum — An International Journal, 2 (2): 112-121