Residential Electricity Demand Forecasting
using Data Mining
Student Ms. Seema Kore1, Prof. V. S. Khandekar2
Department of Information Technology, Smt.Kashibai Navale College of Engineering, Savitribai Phule Pune University, Pune, India
Abstract —In this paper, the proposed system is designed which predicts the electricity demand. Data mining techniques are used such as data cleaning, data smoothing to get the data required for prediction.The Artificial Neural Network (ANN) plays a great role in forecasting the electricity consumption. The existing methodology used to find the electricity consumption and demand prediction for household used ANN, data mining and data preprocessing. The context features like weather, temperature, humidity and public holiday are used as input for the prediction system. Along with context features seasonwise electricity consumption forecasting to achieve improved accuracy is done using proposed system which is based on Support Vector Regression (SVR) and Linear Regression (LR). LR and SVR gives better accuracy than the existing system. LR produces the MAPE value of 0.59% and SVR produces MAPE value of 0.11%. The RMSE (Root Mean Squared Error) performance metrics is used to evaluate the system performance. The RMSE value for LR is 0.73 and for SVR it is 0.34.
Keywords — Predictive modeling, Data mining, Artificial Neural Network, Context Features, Support Vector Regression, Linear Regression
I. INTRODUCTION
Electricity is correlated with the economic growth of the country. It provides working flow for the industries all over the world. The shortage of electricity leads normal economic growth. Electricity is the day-to-day need of the people. Electricity could not be invented as it is a natural phenomenon. It has great importance in our life as it illuminates houses, switch on the televisions, helps in cooking food, reduces work load with the help of many electric appliances. Electricity comes from photo voltaic energy, non renewable fuels, hydroelectric energy, nuclear energy, wind energy. Energy is the reliable source to supply electricity which is pollution free. For no pollution, we can simply go for NAP i.e., North American Power. It offers a gas which is called “cleangas”, that don’t cause pollution. They also provide a product called “greenelectric”. They also carry out the generation of uncontaminated energy from renewable sources.
The electricity forecasting is done using articficial neural networks, data mining techniques, regression
amalysis and many more. In this paper regression methods such as Linear Regression and Support Vector Regression is used with data mining techniques.
In this paper, the techniques of data mining are used to calculate the electricity demand. For this we need to know what is data mining ?
A. Data Mining Definition
Basically data mining is also known as knowledge discovery. Data mining is extracting data from large databases and transform it into understandable structure for further use. Data mining is the analysis step of the “knowledge discovery in databases” process or KDD. Data mining is defined in various forms. Some of these definitions are listed below: • Data mining or knowledge discovery in databases, as it is also known, is the non-trivial extraction of implicit, previously unknown and potentially useful information from the data. This encompasses a number of technical approaches such as clustering, data summarization, classification, finding dependency networks, analyzing changes and detecting anomalies.
• Data mining is the search for the relationships and global patterns that exist in large databases but are hidden among vast amounts of data, such as the relationship between patient data and their medical diagnosis. This relationship represent valuable knowledge about the database and the objects in the database, if the database is the faithful mirror of the real world registered by the database.
B. Linear Regression(LR)
Linear Regression depicts the relation between the dependent variable and explanatory variable (independent variable). LR is used to predict the value y i.e., independent variable from the value of x i.e., dependent variable . It describes a straight line which minimizes squared deviations of observed values of y from those on the regression line. Equation for Simple Linear Regression:
the equation can also be written in different form as:
y= α + βx + ε - (2)
where
α, β are model parameters;
ε is the unpredictable random disturbance term
C. Support Vector Regression(SVR)
Support Vector Machine (SVM) is supervised learning model with associated learning algorithms that analyse data used for classification and regression analysis. SVR is similar to the SVM but a margin of tolerance is set in SVR. But the main idea is same i.e., to minimize the error. There is a function called SMOReg which used for SVR in weka tool. LibSVM performs same as SMOReg so it can be used for calculating SVR. LibSVM is the library for SVM algorithms.
II. LITERATURE SURVEY
There are various approaches used to predict the electricity demand. Various data mining techniques have been used for forecasting electricity demand. The work done for prediction of electricity is discussed below:
A. Forecasting Electricity using Neural Networks
In [2], the value prediction method is implemented with artificial neural network. The meteorological factors such as temperature, humidity, rainfall, public holidays, etc are considered. The two methods for load forecasting are categorized as models and methods. Time series and regression analysis contribute as models and methods belong to computational and artificial intelligence. Regression based models are used because regression methods are easy to implement. Time series are the oldest methods used for load forecasting. To improve the load forecasting the approach can be explored to predict the agricultural electricity consumption.
In [3], a technique for calculating hourly electricity prices for wholesale electricity market in Ontario, Canada using feed forward neural network combined with data mining is proposed. For training the neural network 135 days are selelcted. The forecasting is done for nine days from different seasons. The similar prices days are used for each hour from a set of 90 days. The proposed method predicts the accurate electricity consumption from low to medium price.
In [4], an idea is put forth of forecasting model on hourly basis for large commercial office buildings based on radial basis function neural network (RBFNN) which uses weather and historical load data. It is beneficial because it does not require any
trial and error procedures. The data required consists only the weather and electric power consumption.
In [5], electricity prediction using artificial neural network of China is discussed. The goal of his study is to provide accurate estimation model of electricity demand. The multilayer perceptron ANN model i.e., Artificial Neural Network with error back-propagation algorithm is used. This algorithm is used to estimate the electricity demand.
In [6], a new method regression tree and Normalized Radial Basis Function Network i.e., NRBFN for electricity price forecasting is introduced. If-then rules are used to classify the input data. The combination of ANN and regression reduced the maximum errors for forecasting electricity prices.
B. Other Approaches
[7] has used data mining techniques to predict the electricity consumption in Iran- Mazandaran province. The regression model is used for the prediction. The prediction variables used are temperature, moisture and electricity consumption price. The research aimed at predicting recent years electricity consumption and prediction of future consumption.
[8] has described the idea of short term load forecasting using SVM (Support Vector Machine) based on clustering. In this the available past data is clustered for forecasting the next day load. All the similar patterns of the day are considered for training the SVM. Also the threshold between the daily average loads of all the input training patterns and input testing patterns are used. The results of both with clustering and without clustering are put forth and form the different cluster patterns for different threshold values. This method avoids heavy computation.
[9] has presented an approach of data mining techniques for long term electricity forecasting in Egyptian Electrical Network. The knowledge discovery steps are implemented. Preprocessing is used to find the missing values, odd values, outliers and normalize data. Eleven different cases are tested with actual data collected from different sites. Comparison is done between these different cases.
the day type time parameters are important factors to classify the total electric power usage. Correlation analysis show the energy facility working patterns are strongly related to local weather conditions. The developed model can be used to replace a wattmeter to a computer
application. The model can be also applied for optimal control problems in smart grid.
In [11], an automatic method of explanatory variable selection using additive model is presented. There are thousands of time series which need to be studied so some automatic method is required. This approach tells how to correct the middle term errors for short term load forecasting. EDF portfolio consumption is considered as load demand at aggregate level and GEFCom2012 (Global Electricity Forecasting competition 2012) is considered at loacal application. This methodology combines nonlinear regression and variable selection procedure. This approach simplifies the analysis. But the disadvantage is that it breaks the longitudinal aspects of the observed data.
[12] introduces a new data fusion algorithm for electricity forecasting. A single forecast engine is not enough to capture all the patterns of price signal. Therefore, artificial neural network, adaptive neuro-fuzzy inference system, autoregressive moving average are selected as forecast engine. The new data fusion algorithm i.e., modified ordered weight average (modified OWA) is proposed to combine the three forecast engines. The proposed method provides more accurate results than the primary agents i.e., engines. The system can yield even more accurate results if the primary agents provide accurate forecasts at the initial stage.
In [13], an integrated method of price and load is presented. Through this methodology consumer can make electricity usage according to the price. At the initial stage price and load are treated separately. In second stage, price and load interaction is done by considering input from initial stage. The adaptive wavelet neural network (AWNN) is used which forecasts the 24 hour electricity for the next day. The ARIMA and GARCH models are used. The system forecasts on price or load and does not require the information of the forecast day. But weather conditions, power changes may affect the performance of the system. Feature selection can be added to the system to improve the performance in the future.
III.PROPOSED METHODOLOGY
In the proposed system the efforts are made to enhance the accuracy and performance of the system.
A. Algorithm for Forecasting Electricity Consumption
1. Let U be the set of Users U={u1,u2,u3…..un} for each u in U. Where, u=household user.
2. Collect previous M consumption records {f1,f2….fM} Where, M=consumption record.
3. Now, Calculate mean electricity consumption using formula giver below
Mean electricity consumption =
Where, m=no. of previous records of energy consumption
Fk=energy consumed at kth instances
4. The calculating the linear regression(LR) y= α + βx + ε
5. Calculating the support vector regression(SVR)
f(x,ω)=∑j=1m ωjgj(x) + b
7. Output demand electricity improve accuracy result.
B. Algorithm for SVR
The jar files of weka are imported in java .i.e., weka.jar. Interfacing of weka with eclipse is done. The working of the SVR algorithm in java will be the same as in weka tool. The algorithm is as follows:
1. Choose the LibSVM button under the functions group.
2. Click on name of the algorithm to view the configuration
3. Click on start button to start the algorithm 4. On the result screen the output of SVR is
displayed.
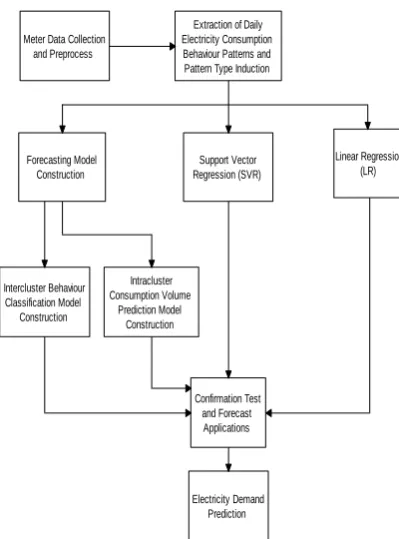
C. System Architecture
Meter Data Collection and Preprocess
Extraction of Daily Electricity Consumption Behaviour Patterns and Pattern Type Induction
Forecasting Model Construction
Intercluster Behaviour Classification Model
Construction
Intracluster Consumption Volume
Prediction Model Construction
Support Vector Regression (SVR)
Confirmation Test and Forecast Applications
Electricity Demand Prediction
Linear Regression (LR)
Fig 1: Proposed System Architecture for Electricity Consumption Forecasting
Step by step working of the proposed system is explained as follows:
1.Meter data collection and preprocess: In figure 2, the very first step is to collect the individual meter data for an adequate time period. The time series were composed of consecutive data points. The daily time series is sorted because noisy and missing data is unavoidable during meter data transmission.
2. Extraction of daily electricity consumption behavior pattern and pattern type induction: At this stage daily electricity consumption behavior pattern is found. Data smoothing and data granulation is done. Data smoothing fetches the data by removing the noisy data. In data granulation, the data is divided into finite granular intervals to reduce the resolution.
3. Forecasting model construction: Two classification models are constructed at this stage:
i. InterclusterBehaviour Classification Model Construction This model takes the day-dependent context feature as input. The behavior class label treated as the output. Each cluster is treated as a behavior class and days in the same class exhibit similar electricity consumption patterns.
ii. Intracluster Consumption Volume Prediction Model Construction The minute-dependent context feature is the input for this model. also the historical load data is also the input. The output is the electricity consumption volume. Back propagation neural network is applied to construct the estimation function of a time point electricity
consumption volume using minute-dependent context features and historical load data for each of the cluster.
4. SVR and LR Methodology:
Support Vector Regression: Support Vector Machine can also be used as a regression method, maintaining all the main features that characterize the algorithm (maximal margin). The Support Vector Regression (SVR) uses the same principles as the SVM for classification, with only a few minor differences. First of all, because output is a real number it becomes very difficult to predict the information at hand, which has infinite possibilities. In the case of regression, a margin of tolerance (epsilon) is set in approximation to the SVM which would have already requested from the problem. In SVR, the input x is first mapped onto a m-dimensional feature space using some fixed (nonlinear) mapping and then a linear model is constructed. SVR is calculated as follows:
f(x,ω)=∑j=1m ωjgj(x) + b - (3)
where gj(x), j=1,2,...m is the set of non linear
transformations and b is the bias term.
Linear Regression: It is the simplest form of regression that just contains predictor and prediction. The relationship between the two can be mapped on a two dimensional space and the records plotted for the prediction values along the Y axis and the predictor values along the X axis. The simple linear regression model then could be viewed as the line that minimized the error rate between the actual prediction values and the point on the line.
Y= a + bX - (from 1) Where, Y= dependent variable X= independent variable a= intercept of line b= slope of line
In Fig 1, by using the forecasting model, LR and SVR method the daily basis demand of the predicated electricity is calculated. The results using the forecasting model i.e., inetrcluster classification model and intracluster volume consumption model and SVR, LR are compared. The assumption is that the forecasting using SVR and LR will improve accuracy as behavior patterns are also analysed at this stage.
construction model are checked. If the results are correct forecasting applications are initiated.
D. Error Calculation
To compare the results of existing system and proposed system error is calculated. MAPE (Mean Absolute Percentage Error) is calculated and one additional error which is modification to the proposed system i.e., RMSE (Root Mean Squared Error) value is calculated. Error calculation for regression is as follows:
Error calculation for LR:
MAPE
=
-
(4)Where, yi= actual meter reading
= predicted value
MAPE= 0.59%
RMSE
=
-
(5)Where, n=total no.of readings
RMSE= 0.73
Error calculation for SVR:
MAPE
=
= 0.11%
RMSE
=
= 0.34
IV.RESULT AND DISCUSSION
The existing system produced an error i.e., MAPE value of 3.23%. From the error calculation section it is clear that the proposed system for electricity consumption forecasting for household gives less error. The MAPE error for LR is 0.59% and RMSE value is 0.73. the MAPE error for SVR is 0.11% and RMSE value is 0.34. Error calculation shows that electricity demand prediction is more accurate than the existing system. Ultimately the improved accuracy improves the performance of the forecasting system.
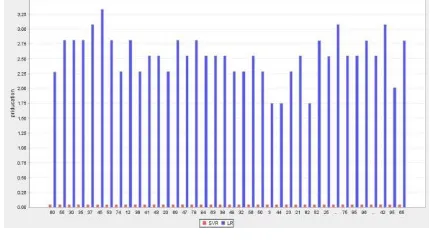
In Fig 2 the prediction for LR methodology is shown . The meter reading is plotted on X-axis and the prediction is plotted on Y-axis.
Fig 2: Graph for LR prediction
In Fig 3, the graph for prediction through SVR methodology is plotted. Here also, the X-axis indicates meter reading and the Y-axis indicates the prediction.
Fig 3: Graph for SVR prediction
In Fig 4, the comparison between the SVR and LR methodology is shown. The graph indicates that the prediction done with SVR is less than the LR. So from the graph it is clear that the SVR methodology yields better results. And hence, the accuracy of prediction is improved.
V. CONCLUSIONS
The proposed system is designed to predict the electricity demand. The system shows that the consumer’s behaviour patterns are affected by the external factors. The proposed system works on behavioural patterns of electricity consumption using SVR and LR. The SVR and LR are implemented using weka tool which classifies and clusters the data. SVR and LR. The error produced
by the SVR and LR methodology is much less as compared to the existing methodology. The MAPE value for SVR is 0.11% and RMSE value is 0.34. For LR the MAPE value is 0.59% and RMSE value is 0.73. The error calculation shows that the proposed system provides improved accuracy as well as the improved performance. The regression methods used prove that the regression yields better results.
ACKNOWLEDGMENT
For everything achieved, the credit goes to all those who had really helped us to complete this work successfully. We are extremely thankful to P. G. Coordinator Prof. N.P. Kulkarni and Prof. V. S. Khandekar project guide for guidance and review of this paper. I am very much grateful to our Project coordinator Dr. L. V. Patil for providing all the facilities. I would also indebted to Dr. K. R. Borole, Vice-Principal Smt. Kashibai Navale College of Engineering, Pune for providing the facilities needed for completion of the dissertation and necessary guidance. I would also indebted to Dr. A. V. Deshpande, Principal Smt. Kashibai Navale College of Engineering, Pune for providing the facilities needed for completion of the dissertation and necessary guidance. I would also like to thanks the all faculty members of ”SKN College Of Engineering”.
REFERENCES
[1] Yu-Hsiang Hsiao, “Household Electricity Demand Forecast Based on Context Information and User Daily Schedule Analysis From Meter Data”, IEEE
Transactions on Industrial Informatics, Vol. 11, No. 1, February,2015.
[2] Navjot Kaur and Amrit Kaur, “Predictive Modelling Approach to Data Mining for forecasting electricity consumption ”, 6th International Conference-Cloud System and Big Data Engineering(Confluence),2016.
[3] Harmanjot Singh Sandhu, Liping Fang and Ling Guan, “Forecasting Day-Ahead Electricity Prices using Data Mining and Neural Network Techniques”,2014.
[4] Weijie Mai and C. Y. Chung, “Electric Load Forecasting for Large Office Building Based on Radial Basis Function Neural Network”, 2014.
[5] Jian Deng, “Modelling and Prediction of China’s Electricity Consumption using Artificial Neural Network”, 6th International Conference on Natural Computation,2010. [6] Hiroyuki Mori and Akira Awata, “Data Mining of
Electricity Price Forecasting with Regression Tree and Normalized Radial Basis Function Network”, IEEE, 2007 [7] Noorollah Karimtabar and Sadegh Pasban, “Analysis and
predicting electricity energy consumption using data mining techniques- A case study I.R. Iran - Mazandaran province”, 2015 2nd International Conference on Pattern Recognition and Image Analysis (IPRIA 2015) March 11-12, 2015.
[8] Amit Jain, “Clustering based Short Term Load Forecasting using Support Vector Machines”, IEEE Bucharest Power Tech Conference, 2009.
[9] Hoda K. Mohamed, “Data Mining for Electrical Load Forecasting In Egyptian Electrical Network”, IEEE, 2006. [10] Jongwoo Choi and Youn Kwae Jeong, “Development of
the Simple Building Electric Power Prediction Model with Local Weather Forecast based on Clustering and Silhouette Algorithm”, IEEE, 2015.
[11] Vincent Thouvenot and Audrey Pichavant, “Electricity Forecasting Using Multi-Stage Estimators of Nonlinear Additive Models”, IEEE Transactions on Power Systems,VOL.31,NO.5,September 2016.
[12] Ali Darudi and Masoud Bashari, “Electricity Price Forecasting using A New Data Fusion Algorithm”, The Institution of Engineering and Technology Generation, Transmission, Distribution, Vol.9, 2015.