http://www.sciencepublishinggroup.com/j/ajme doi: 10.11648/j.ajme.20180402.11
ISSN: 2575-3908 (Print); ISSN: 2575-3797 (Online)
Performance Analysis and Economic Evaluation of Surface
Irrigation Pumps Using Solar PV (Case Study)
Sami Abdel Fattah El Shaikh, Ibrahim Ragab Teaima, Mohamed Attia Abdellatif
Mechanical and Electrical Research Institute, National Water Research Center, Ministry of Water Resources and Irrigation, Delta Barrages, Egypt
Email address:
To cite this article:
Sami Abdel Fattah El Shaikh, Ibrahim Ragab Teaima, Mohamed Attia Abdellatif. Performance Analysis and Economic Evaluation of Surface Irrigation Pumps Using Solar PV (Case Study). American Journal of Modern Energy. Vol. 4, No. 2, 2018, pp. 7-16.
doi: 10.11648/j.ajme.20180402.11
Received: March 5, 2018; Accepted: April 12, 2018; Published: May 10, 2018
Abstract:
This study aims at evaluating performance of the solar powered surface irrigation pumps during field operation. The evaluation process was performed for four months from May to August 2016 where the measurements were conducted on El Afeer Mesqa Pumping Station, Behera Governorate. The results of the study indicate that the use of solar cells as energy source in lifting water achieves the purpose regularly and effectively. The research shows that the cost of the solar PV system is 64.2% of the cost of the diesel pump over a 10-year life cycle. The maximum power reached was at 12 p.m. and the pump motors are loaded more than four hours. The maximum overall efficiency of the pump system is appeared at 8.00 a.m. with value about 30% and continued for 8 hours with minimum efficiency about 12%. The overall efficiency starts to increase and reached to 20% at 4.00 p.m. due to the consumed power by electric motor is suitable for the amount of PV generated power at that time. The maximum overall efficiency is appeared in July and reached to 33.69% compared to the other months. The efficiency of the cells in the lowest case at the highest solar radiation and this is due to the sun radiation falling on them is very large compared to the capacity out of them. It is recommended to adopt the solar PV arrays of very small irrigation channel (Mesqas) pumping stations in future projects to save electric and diesel power.Keywords:
Solar Energy, Case Study, Surface Irrigation Pumps, PV, Solar Economics1. Introduction
The Irrigation Improvement Project organizes water that used at the very small irrigation channel (Mesqa) level through a package of hardware and software interventions. Those interventions are efficient techniques of approved Mesqa water use efficiency and in introducing equitable water distribution among the users. Among the most important hardware interventions development process is the replacement of the multiple single user pump sets along the old type of Mesqa with collective single-point pumping stations at the heads of the approved Mesqa.
Alternative energy sources were undermined until fuel prices started to rise significantly in the last few years. High initiating costs of PV generators was a limiting factor for those users to utilize such renewable and clean energy source. Even though this solar technology may have a higher starting cost than that of conventional fossil fuel, the low
maintenance and operation cost and the ability to operate without fuel make the solar powered systems cheaper to be usable.
the PV pumping system. System efficiencies and pump discharge was studied. Photovoltaic Pumping system (PVP) was related with daily solar radiation intensity derived from "Meteo-Norm" software. Solar irrigation system needs to take account of the fact that demand for irrigation water will vary throughout the year. Pande, et al. [4], designed and developed a solar photovoltaic pump (PVP) operated drip irrigation system for growing orchards in and region considering different design parameters, like pumps size, water requirements, and the diurnal variation in the pressure of the pump due to change in irradiance and pressure compensation in the emitters. Short and Thompson [5], showed that solar powered water pumping has the potential to bring sustainable supplies of potable water to millions of people in developing countries. Mueller et al. [6] said that due to the high initial costs of PV-generators the power requirement of the system has to be minimized from the beginning. Since the hydraulic power is the product of flow and pressure, following targets are set reduction of the required flow by avoidance of water losses and reduction of pressure loss by an optimum hydraulic system layout.
Betka and Moussi [7], stated that performances of a photovoltaic pumping system based on an induction motor are degraded once insolation varies far from the value called nominal, where the system was sized. Bione et al. [8], proposed a photovoltaic pumping systems with solar tracking, coupled to low concentration cavities, as a viable alternative to reduce the final cost of the pumped water volume. PVP's initiation costs are a limiting factor to be utilized by farmers for irrigation. Studies were always concerning the increase of PVP system efficiencies as an indirect way to decrease the costs.
Initially a solar-powered pumping system generally costs more than a gas, diesel, or propane-powered generator but again requires far less maintenance and labor. Comparing installation costs (including labor), fuel costs and maintenance costs over 10 years, it’s observed solar pump is an economical choice than diesel or electricity driven pumps [9]. The key to PV’s success is the low labor and maintenance cost relative to the other options. The long-term economics make PV pumps superior to most other remote watering options in the rural area where there is no electricity supply.
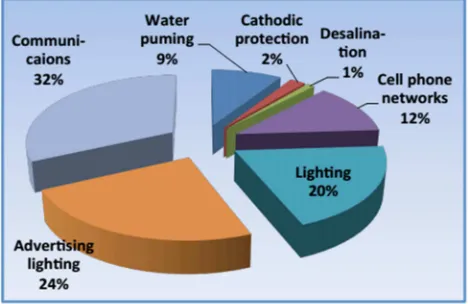
Egypt is one of the Sunbelt countries that enjoy one of the largest potentials of solar energy applications. The concept of renewable energy (RE) is not new to Egypt. Development of the renewable energy has become a priority over recent years. Egypt’s present energy strategy aims at increasing the share of renewable energy to 20% of Egypt’s energy mix by 2020. The RE resources with the greatest potential for widespread application in Egypt are solar and wind, both of which are substantial in the country. The total installed capacity of solar photovoltaic (PV) systems in Egypt is around 10 MW for lighting, water pumping, wireless communications, cooling and commercial advertisements on highways, as shown in “Figure 1” [10].
Figure 1. PV Applications in egypt by usage.
Now it is high time to introduce solar energy into another irrigation system which demands major electricity supply during the maximum water needs season. In Egypt there is more than 1.5 million units of mechanized (diesel and electric) irrigation pumps. Among these pumps, 15% of pumps are electric and 85% of pumps are diesel pump. Diesel pump running costs were estimated as one kWh consuming 0.60 liter of fuel and 0.02 liter of lubrication oil. The financial costs of fuel, oil and electricity were based on their subsidized prices and tariff (one liter of fuel costs LE 3.35 and one liter of oil costs LE 45).
2. Mathematical Methodology
The incident solar irradiation power to hydraulic power circuit is shown in “Figure 2”.
Incident Solar radiation falling on the PV array (in watts) gives energy inputs to the area are given by:
(1)
Where:
Pi: Power at Surface of PV Panel
Is: Intensity on PV Panel
As: Panel Area
The output power D. C. from the photovoltaic array is given by:
∘ (2)
Where:
Po: Output DC power
V: Output volt from PV Panel I: Output Current from PV Panel
The hydraulic power output of the pump (Ph) is the power required to lift a volume of water over a given head or it is equivalent to total hydraulic power in discharge at particular head from the suction point.
(3)
Where:
Ph: Hydraulic power
g:Gravity Q: Discharge H: Head
PV Array efficiency (Ea) is the measure of how efficient
the PV array is in converting sunlight to electricity.
∘ (4)
Where:
Ea: PV Array Efficiency
Efficiency of Subsystem (Es) is the efficiency of the entire
system components (inverter, motor, and pump).
∘ (5)
Where:
Es: Efficiency of Subsystem
The Overall efficiency (Eo) indicates how efficiently the
overall system converts solar radiation into water delivery at a given head.
∘ (6)
Where:
Eo: Overall Efficiency
It can be written in the form of efficiencies as:
∘ (7)
2.1. System Description
A solar irrigation pump system methods needs to take account of the fact that demand for irrigation system water will vary throughout the year. Peak demand during the irrigation system seasons is often more than twice the average demand. This means that solar pumps for irrigation are under-utilized for most of the year. Attention should be paid to the system of irrigation water distribution and application to the crops. The irrigation pump system should minimize water losses, without imposing significant additional head on the irrigation pumping system and be of low cost.
There are four selected Mesqa used PV array as the power source at El-Afeer region. The first Mesqa is namely EL-AFEER (1) Mesqa pumping station serves a total command area of about 56 feddan through nine valves. The second Mesqa is namely EL-AFEER (2) Mesqa pumping station serves a total command area of about 76 feddan through seven valves. The third Mesqa is namely EL-AFEER (3) Mesqa pumping station serves a total command area of about 70 feddan through nine valves. The last one is namely EL-AFEER (4) Mesqa pumping station four a total command area of about 40 feddan through nine valves. The pipeline material is composed of PVC with diameter of 200 mm, as shown in “Figure 2” The pipeline has suitable number of outlets at intervals along its length which serves quaternary units (Marwas). Each outlet has a butterfly valve allowing water to be discharged into open channel.
Figure 2. Input output power circuit.
Each pumping station consists of two small single stage end suction centrifugal pumps driven by 20-HP electric motor and one pump driven by diesels engine. On the other hand each Mesqa have a surface pump used PV array as a power source.
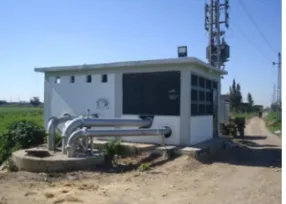
Each Mesqa has 14.4 kW of PV arrays and each pump give a flow rate 45 L/s, head 12.7 m, rated power 10.2 HP at 1450 rpm. The Sun Edison Inverter is used to convert has DC power generated from PV arrays to AC Power to drive the pump motors. A PV solar water pumping station is installed at El-Afeer intake canal, Kafer El-Dwar, El-Behara governorate, Egypt. The system is used to lift water from El-Afeer canal for irrigation purposes. The station consists of one pumping unit discharging into a main header. The main components of the pumping station are the photovoltaic panels on an adjustable structure, inverters, surface pump and piping system, as shown in “Figures 3 & 4”. The solar photovoltaic generator is arranged into four groups, each drives a surface pump driven by an AC motor.
Figure 3. El-Afeer Pumping station.
Figure 4. El-Afeer PV array.
direct voltage of the PV generator into three phase AC voltage to drive the pumps.
Figure 5. PV based water pumping system.
Four surface pumps are installed in a pump house to lift water from water sump. The pumps are driven by three phase motors. Each motor has with 7.5 kW power (380 V, 14 A, 50 Hz).
3. Field Measurements
The program evaluation of surface pumps is done during four months from May to August. The data of solar radiation refer to reference [11]. This data was used prior to the readings of solar radiation in that region in comparing the design determinants of the units with the actual readings. All field measurements of flow, volts, ampere, and power are the average readings of multiple measurements on different consecutive days of the month. All readings that were affected
by clouds, rain or measurement errors were observed.
The system performance is evaluated by measuring the pumped water flow rate and the pump power. The following transducers have been used for the various measurements. Ultrasonic flow meters have been used for the flow rate measurements. The flow meters work in the range of zero to 25 m/s with an accuracy of ±0.5%. The power consumption has been measured using three phase power analyzer, Fluke 434 instrument with an accuracy of ±0.5%. All data recorded along day at each one hour.
4. Results and Discussions
Average values for each hour of the day have been obtained. The hourly average values for power consumption has been measured and the relation between power consumption and time are obtained. The hourly discharge of the pumping system has been measured and the flow rate time relation has been obtained as shown in “Figures 6, 7, 8, and 9”.
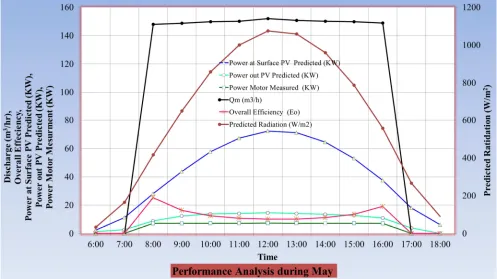
The power consumption and pump flow rate during May is illustrated from “Figure 6 &Table 1”, it can shows that, the starting time is 6 a.m. and stopping time is 6pm, consequentially the irrigated period time is varied from day to another according to the intensity of solar radiation. On the other hand the pumped flow rate and power consumption greater values at noon hour. The efficiency of the cells in the lowest case at the highest solar radiation and this is due to the sun radiation falling on them is very large compared to the capacity out of them. This does not affect the performance of the system, the system outputs are measured throughout the day and not in a moment.
Table 1. Performance Analysis during May.
Hour Q m (m3/h) Predicted Radiation (W/m2)
Power at Surface PV Predicted (KW)
Power out PV Predicted (KW)
Power Motor Measured (KW)
Overall Efficiency (Eo)
6:00 0.00 35.00 2.35 1.32 0.00 0.000
7:00 0.00 167.00 11.22 2.75 0.00 0.000
8:00 147.92 417.00 28.02 8.88 7.11 25.373
9:00 148.75 650.00 43.68 12.32 7.15 16.369
10:00 149.79 859.00 57.72 13.81 7.20 12.473
11:00 150.21 1001.00 67.27 14.10 7.22 10.733
12:00 152.08 1076.00 72.31 14.59 7.31 10.110
13:00 150.83 1059.00 71.16 14.08 7.25 10.188
14:00 150.21 960.00 64.51 13.50 7.22 11.192
15:00 149.79 788.00 52.95 12.83 7.20 13.597
16:00 148.96 558.00 37.50 10.93 7.16 19.095
17:00 0.00 268.00 18.01 3.91 0.00 0.000
18:00 0.00 92.00 6.18 0.00 0.00 0.000
The design is therefore suitable for the requirements for which it is designed to raise an appropriate amount of water over a period of time. Generally it is found that, system efficiency increases with increasing solar radiation until the pump reached their maximum power.
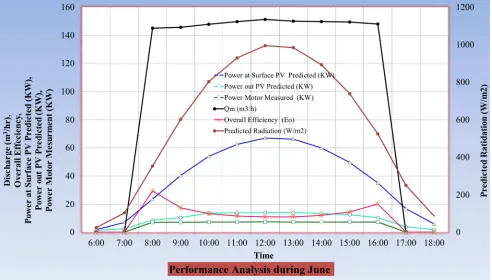
Figure 7 & Table 2 show that the performance evaluation in June, the radiation intensity is decreases compared with the previous month and the pump flow rate is decreased also.
On the other hand side the overall efficiency of PV array is increased with small value. The maximum overall efficiency is appeared at 8.00 a. m. then decreased until 2.00 p.m. from this moment the overall efficiency starts to increase other time and the maximum increases appeared at 4.00 p.m. due to the consumed power by electric motor is suitable for the amount of PV generated power.
Figure 7. Performance analysis during June.
Table 2. Performance Analysis during June
Hour Q m (m3/h) Predicted Radiation (W/m2)
Power at Surface PV Predicted (KW)
Power out PV Predicted (KW)
Power Motor Measured (KW)
Overall Efficiency (Eo)
6:00 0.00 25.00 1.68 1.26 0.00 0.000
7:00 0.00 103.00 6.92 2.41 0.00 0.000
8:00 145.22 353.00 23.72 8.49 6.98 29.425
9:00 145.84 602.00 40.45 10.39 7.01 17.328
10:00 147.92 803.00 53.96 13.65 7.11 13.176
Hour Q m (m3/h) Predicted Radiation (W/m2)
Power at Surface PV Predicted (KW)
Power out PV Predicted (KW)
Power Motor Measured (KW)
Overall Efficiency (Eo)
12:00 151.46 995.00 66.86 14.07 7.28 10.888
13:00 150.21 984.00 66.12 13.99 7.22 10.919
14:00 149.79 892.00 59.94 13.33 7.20 12.012
15:00 149.59 739.00 49.66 12.46 7.19 14.478
16:00 148.13 524.00 35.21 10.37 7.12 20.220
17:00 0.00 250.00 16.80 3.77 0.00 0.000
18:00 0.00 85.00 5.71 1.74 0.00 0.000
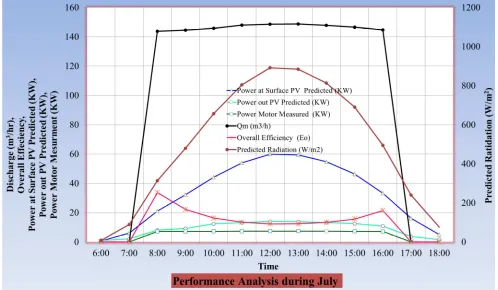
The performance evaluation is done one day in July. From “Figure 8 &Table 3” it can be illustrated that, the maximum power is reached at 10 o’clock and the pump motors is
loaded more than four hours. The maximum overall efficiency is appeared in July and reached to 33.69% compared to the other months.
Figure 8. Performance analysis during July.
Table 3. Performance Analysis during July.
Hour Q m (m3/h) Predicted Radiation (W/m2)
Power at Surface PV Predicted (KW)
Power out PV Predicted (KW)
Power Motor Measured (KW)
Overall Efficiency (Eo)
6:00 0.00 9.00 0.60 1.04 0.00 0.000
7:00 0.00 90.00 6.05 2.20 0.00 0.000
8:00 143.81 314.00 21.10 8.09 7.11 33.695
9:00 144.62 480.00 32.26 9.11 7.15 22.166
10:00 145.84 657.00 44.15 12.42 7.21 16.331
11:00 148.06 804.00 54.03 13.15 7.32 13.548
12:00 148.67 892.00 59.94 13.93 7.35 12.262
13:00 148.87 884.00 59.40 13.84 7.36 12.390
14:00 147.86 814.00 54.70 13.21 7.31 13.364
15:00 146.64 690.00 46.37 12.53 7.25 15.636
16:00 144.82 495.00 33.26 10.79 7.16 21.525
17:00 0.00 240.00 16.13 3.70 0.00 0.000
The performance evaluation during August month is shown in “Figure 9 & Table 4”. From figure 9 it can illustrated that the maximum flow rate is decreases compared to the previous months, this decreases because the surface
temperature of PV arrays is very high and the efficiency of transfer the solar radiation to DC power is decrease. The maximum power is taken at 12:00 and the maximum flow rate produced from the pumps also reached at the same time.
Figure 9. Performance analysis during August.
Table 4. Performance Analysis during August.
Hour Q m
(m3/h)
Predicted Radiation (W/m2)
Power at Surface PV Predicted (KW)
Power out PV Predicted (KW)
Power Motor Measured (KW)
Overall Efficiency (Eo)
6:00 0.00 19.00 1.28 1.10 0.00 0.000
7:00 0.00 100.00 6.72 2.24 0.00 0.000
8:00 144.62 339.00 22.78 8.22 7.15 31.386
9:00 145.63 551.00 37.03 10.40 7.20 19.445
10:00 146.24 763.00 51.27 12.91 7.23 14.101
11:00 148.67 879.00 59.07 14.15 7.35 12.443
12:00 149.27 977.00 65.65 14.45 7.38 11.241
13:00 149.07 971.00 65.25 13.90 7.37 11.295
14:00 148.26 890.00 59.81 13.66 7.33 12.256
15:00 146.85 725.00 48.72 13.24 7.26 14.901
16:00 145.63 500.00 33.60 10.87 7.20 21.429
17:00 0.00 245.00 16.46 3.77 0.00 0.000
18:00 0.00 80.00 5.38 1.71 0.00 0.000
In general the solar pumping stations are advantageous over the electric and diesel ones from many perspectives: Technically solar pumping system, require less maintenance and labor costs than the diesel and electric pumps and decrease maintenance costs beyond cleaning of the panels once a week.Economically, although the estimated total capital cost of the solar pumping stations is higher than the estimated cost of the electric and diesel pumps, the annual total cost per feddan of the solar pumping stations is lower because of their lower running costs during the project period. Socially, recent farmer surveys indicate that the
5. Economic Study
In order to generalize a PV pumping system in a wide area of applications, their cost must be less expensive or comparable to the costs of the mechanical pumping alternatives, such as Diesel, wind or other electric systems. Life cycle cost (LCC) analysis, presented by Brandumahel [12], is considered the most widely used method for evaluating the cost of a desired system. Life cycle cost analysis gives the total cost of the PV powered water pumping system including all expenses incurred over the life of the system, and it is helpful for comparing the costs of different system designs. A PV pumping system will operate for a period of time before it needs replacement. For example, the PV panels may be replaced after 20–30 years, whereas the pump may be replaced after 5–10 years. The life cycle costs of a PV pumping system are the initial cost of the complete system in the event of installation plus the annual operation, repair and maintenance expenses.
The life cycle cost analysis consists of finding the present worth of any expenses expected to occur over the life cycle of the system. The effects of different system components with different reliabilities and lifetimes can be studied using LCC analysis. In LCC analysis, the present worth value (PW) of all the capital and recurring costs for the PV powered pumping system is calculated. For example, the present worth (Apw) of a future sum of money (A) in a given year (N)
at a given discount rate (d) is given by
/(1 + ) (8)
For example, with a 10% discount rate, this means that a $100 cost today may be considered equivalent to a $110 cost incurred 1 year from today, or a $121 cost incurred 2 years from today.
In LCC analysis, the present worth (PW) of all the capital and recurring costs for the PV powered pump system is calculated. The life cycle cost of a system can be calculated using the following equation:
+ + (9)
The capital cost C, of a system includes the initial capital expenses for equipment’s, the system design and the system installation. This cost is always considered as a single payment occurring in the initial year of the system installation. Maintenance (M) is the sum of all yearly scheduled operation and maintenance costs. Replacement cost (R) is the sum of all repair and equipment replacement costs anticipated over the life of the system, and normally, the replacement costs occur only in specific years. Several factors should be considered when the period for an LCC analysis is chosen. For example, PV modules are usually assumed to operate for 20 years or more without failure, so 20 years is the normal period chosen to evaluate the economic feasibility of PV systems. However, the pump and motor may not last 20 years, so replacement costs for this case must be considered in the calculation if a comparison is
to be made with alternative water pumping systems.
To evaluate, economics of solar PV water pumping Vis-a-Vis Diesel powered water pumping systems, the life cycle cost (LCC) of the PV water pumping system, the period of analysis is assumed to be 20 years at a discount rate of 10% with an annual increase in fuel cost of 5%. There are four major elements in the capital costs of a PV powered water system: PV array modules, surface water pump and motor, distribution system and installation costs for the PV systems. Since the distribution system would be the same for all power sources for the water pumping systems, it will be ignored in the present analysis. The type of PV module is EMMVEE ESC300, and the current PV module average price is approximately $4.5 per Wp as provided by the module manufacturer.
A surface centrifugal solar powered pump is proposed for this study. The cost of a surface centrifugal pump, including all electrical and mechanical hardware and labor work required, is about $2700. The installation costs for PV systems, due to their requirement for array foundations, additional shipping cost, and labor to assemble the structures etc., are assumed to be about 10% of the PV array cost. The operations and maintenance costs of a PV pumping system are difficult to estimate accurately, so a figure of about LE90 per year is assumed. The pump and motor subsystem is usually replaced after about 8 years. To evaluate the economic feasibility of the PV pumping system, its life cycle cost is compared to the life cycle cost of an alternative Diesel pumping system. Diesel engines suitable for pumping systems are usually 14.65 kW (20 HP) or larger [13]. This means that for pumping systems requiring lower power, the Diesel engine will be underutilized.
As a result, the Diesel engine capital costs are higher than needed based on the power requirements; however, this is partially offset by lower fuel and maintenance costs since the Diesel engine will be able to pump the required water in a shorter period of time. It is usually advised that a Diesel pump should not run for more than 8 h/day for practical reasons. The installed cost per kilowatt for typical Diesel pumping systems is about $ 750 per kW. So, the installed capital cost of the 14.65 kW Diesel pumping system (the minimum practical size) would cost about $10978.5. The lifetime of the engine and pump for rural installations is assumed to be 8 years. So, an average life of 8 years is assumed, after which time the complete system must be replaced. Maintenance costs for a Diesel pumping system in the size range chosen for this study can be estimated as a proportion of the capital cost [13]. For Diesel, an average typical yearly maintenance costs would be 10% of the capital cost (i.e. $1097.85 per year).
Table 5. 10 HP Pump Powered by a 20 HP DG Set vis-as-vis a Solar PV Water Pumping System.
Item PV water pump system Diesel pump
Cost of a surface centrifugal pump, including all electrical and mechanical hardware and labor work required 45000 LE 29300 LE
Installation costs for PV systems 4500 LE
The operations and maintenance costs 90 LE 18000 LE
Life cycle period (in years) 20 year 8 year
Discount rate 10% 10%
In addition, we will assume $ 350 per year for operation and maintenance costs. For the same amount of pumped water as in the PV case, the present worth value for the Diesel system case can be directly compared to that for an equivalent PV powered pumping system. It should be kept in mind that the results of the comparison between PV and Diesel pumping systems would be influenced by changes in any of the key assumptions used. For example, increases in fuel price sharply increase the cost of pumping with Diesel, relative to PV. On the other hand, the use of a higher discount rate improves the cost of the Diesel system because most of the cost of the PV system occurs in the first year and is not sensitive to the discount rate factor. Compared with diesel pumping systems, the cost of the solar PV system is 64.2% of the cost of the diesel pump over a 10-year life cycle. Based on the above assumptions, it also finds that users in the solar PV system can pay the cost of the solar PV water system from its diesel savings in about 4 years. The previous results let one conclude that well-designed PV pumping systems are feasible in Egypt even at the current expensive prices of PV modules. Moreover, with the increased diesel prices and the steadily falling PV prices these systems will be more economic in the near future due to the anticipated reduction in the prices of photovoltaic modules.
6. Conclusions
The Irrigation Improvement Project organizes water use at Mesqa level through a package of hardware and software interventions. Those interventions are efficient means of improving Mesqa water use efficiency and in introducing equitable water distribution among the users. Among the most important hardware interventions is the replacement of the multiple single user pump sets along the old meskas with collective single-point pumping stations at the heads of the improved Mesqa. So far, the IIP has been using electric or diesel-driven pump sets in the improved Mesqa pumping stations. This research shows that the use of solar pump sets is more advantageous over using electric or diesel pumps from different perspectives:
1)Costs of PV equipment and water pumps are expected to decrease more and more over the next few years as the demand for PV systems goes up worldwide. These factors will make PV pumping systems more economic in the near future.
2)Compared with diesel pumping systems, the cost of the solar PV system is 64.2% of the cost of the diesel pump over a 10-year life cycle.
3)The maximum overall efficiency is appeared at 8.00 a.m. then decreased until 4.00 p.m. from this moment
the overall efficiency starts to increase other time and the maximum increases appeared at 4.00 p.m. due to the consumed power by electric motor is suitable for the amount of PV generated power.
4)The efficiency of the cells in the lowest case at the highest solar radiation and this is due to the sun radiation falling on them is very large compared to the capacity out of them.
5)Technically PV solar pump stations require less maintenance and labor costs than the diesel and electric pumps electric motors.
6)The estimated total capital cost of the solar pumping stations is higher than the estimated cost of the electric and diesel pumps, the annual total cost per feddan of the solar pumping stations is lower because of their lower running costs.
References
[1] Posorski R. Photovoltaic water pumps, an attractive tool for rural drinking water supply. Solar Energy 1996; 58(4:6):155:63. [2] Mayer O. and J. Mueller; 1996. Photovoltaic und ihre anwending in Bewaesserungs-system, Wasserwirtschaft, 86(4): 190-193.
[3] Merino, G. G.; L. O. Lagos and J. E. Gontupil; 2008. Monitoring and evaluation of a direct coupled photovoltaic pumping system, App. Eng. in Ag., 24(3): 277-284.
[4] Pande P. C., A. K. Singh, S. Ansari, S. K. Vyas and B. K. Dave; 2003. Design development and testing of a solar PV pump based drip system for orchards, Renewable Energy, 28, 385–396.
[5] Short, T. D. and P. Thompson;- 2003, Breaking the mould: solar water pumping -the challenges and the reality, Solar Energy, 75: 1–9.
[6] Mueller J.; K. Koeller, S. Algohary and A. Hegazi; 1998. Solar power drip Irrigation in Egypt, Land technic, 53(3): 138-139.
[7] Betka A. and A. Moussi; 2004. Performance optimization of a photovoltaic induction motor pumping system, Renewable Energy, 29:2167-2181.
[8] Bione J.; O. C. Vilela and N. Fraidenraich; 2004. Comparison of the performance of PV water pumping systems driven by fixed, tracking and V-trough generators, Solar Energy, 76:703-711. [9] Helikson, H. J and Others, Pumping water for irrigation using
solar energy, University of Florida, USA, 1995.
[11] E. H. Amer and M. A. Younes, Estimating the monthly discharge of a photovoltaic water pumping system: Model verification, Energy Conversion and Management, 2006; 47, pp. 2092-2102.
[12] Brandemuehl MJ, Beckman WA. Economic evaluation and optimization of solar heating systems. Solar Energy 1979;23: 1–10.